plotilleresample 1.0__tar.gz → 1.0.2__tar.gz
This diff represents the content of publicly available package versions that have been released to one of the supported registries. The information contained in this diff is provided for informational purposes only and reflects changes between package versions as they appear in their respective public registries.
- {plotilleresample-1.0 → plotilleresample-1.0.2}/PKG-INFO +14 -10
- {plotilleresample-1.0 → plotilleresample-1.0.2}/README.md +12 -8
- {plotilleresample-1.0 → plotilleresample-1.0.2}/plotilleresample.egg-info/PKG-INFO +14 -10
- {plotilleresample-1.0 → plotilleresample-1.0.2}/pyproject.toml +2 -2
- {plotilleresample-1.0 → plotilleresample-1.0.2}/LICENSE +0 -0
- {plotilleresample-1.0 → plotilleresample-1.0.2}/plotilleresample/__init__.py +0 -0
- {plotilleresample-1.0 → plotilleresample-1.0.2}/plotilleresample/plotilleresample.py +0 -0
- {plotilleresample-1.0 → plotilleresample-1.0.2}/plotilleresample.egg-info/SOURCES.txt +0 -0
- {plotilleresample-1.0 → plotilleresample-1.0.2}/plotilleresample.egg-info/dependency_links.txt +0 -0
- {plotilleresample-1.0 → plotilleresample-1.0.2}/plotilleresample.egg-info/top_level.txt +0 -0
- {plotilleresample-1.0 → plotilleresample-1.0.2}/setup.cfg +0 -0
- {plotilleresample-1.0 → plotilleresample-1.0.2}/tests/test_plotilleresample.py +0 -0
|
@@ -1,11 +1,11 @@
|
|
|
1
1
|
Metadata-Version: 2.4
|
|
2
2
|
Name: plotilleresample
|
|
3
|
-
Version: 1.0
|
|
3
|
+
Version: 1.0.2
|
|
4
4
|
Summary: Python module to resample datasets before plotting with Plotille.
|
|
5
5
|
Author-email: "Carlos A. Planchón" <carlosandresplanchonprestes@gmail.com>
|
|
6
6
|
License-Expression: MIT
|
|
7
7
|
Project-URL: Homepage, https://github.com/carlosplanchon/plotilleresample
|
|
8
|
-
Keywords: plotting,ascii,math,resample
|
|
8
|
+
Keywords: plotting,ascii,math,resample,plotille
|
|
9
9
|
Classifier: Intended Audience :: Developers
|
|
10
10
|
Classifier: Topic :: Scientific/Engineering :: Visualization
|
|
11
11
|
Classifier: Topic :: Terminals
|
|
@@ -21,9 +21,9 @@ License-File: LICENSE
|
|
|
21
21
|
Dynamic: license-file
|
|
22
22
|
|
|
23
23
|
# plotilleresample
|
|
24
|
-

|
|
24
|
+
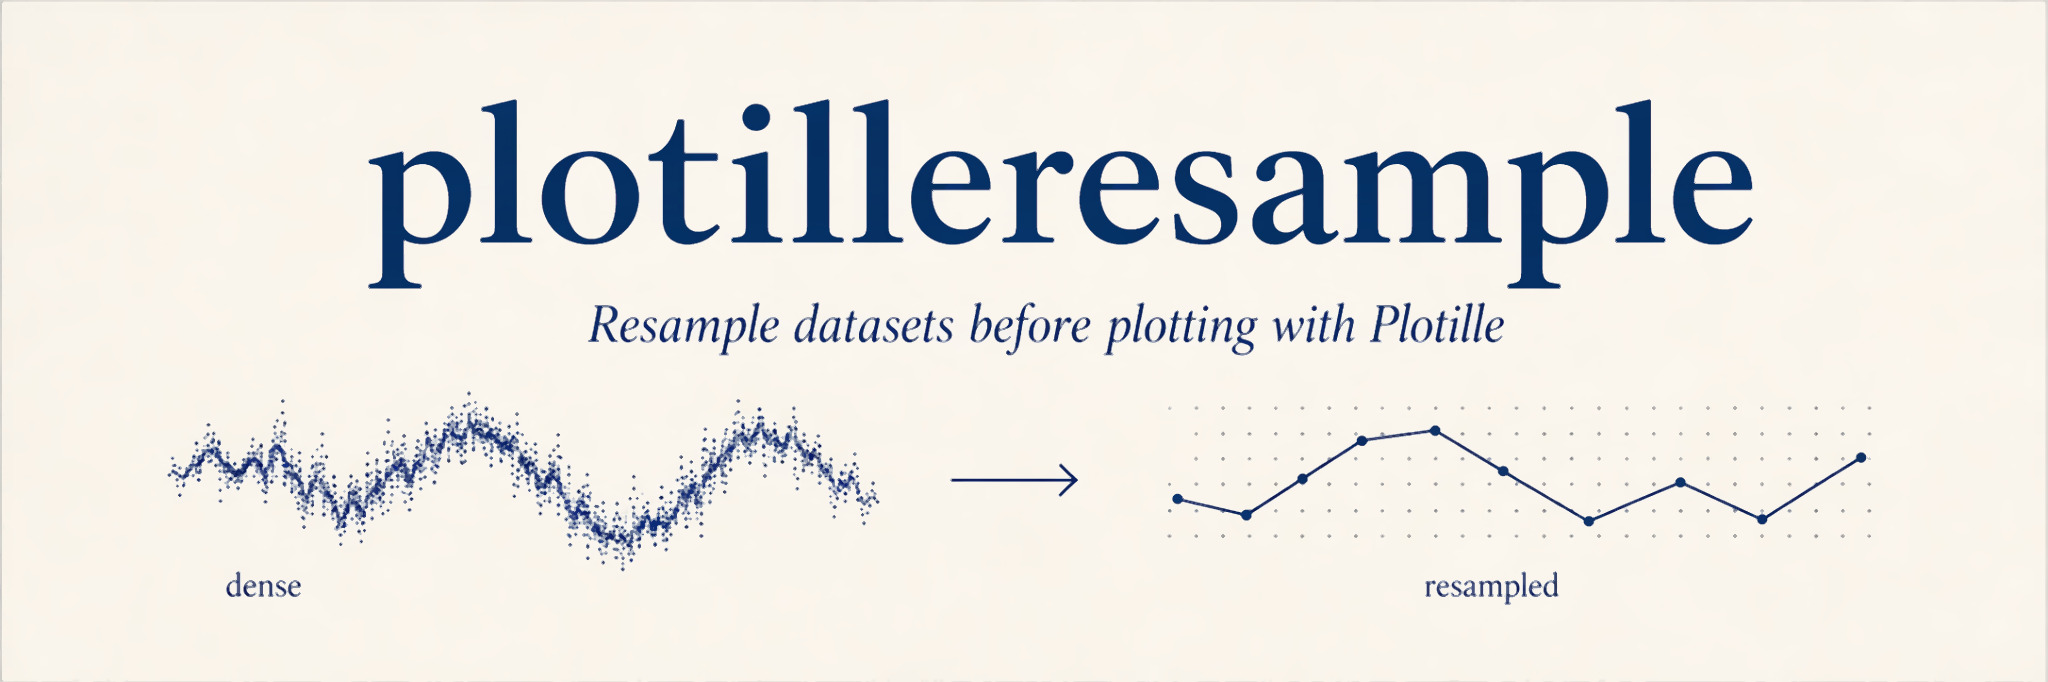
|
|
25
25
|
|
|
26
|
-
*Python module to resample datasets before plotting with Plotille.*
|
|
26
|
+
*Python module to resample datasets before plotting with [Plotille](https://github.com/tammoippen/plotille).*
|
|
27
27
|
|
|
28
28
|
[](https://github.com/carlosplanchon/plotilleresample/actions/workflows/ci.yml)
|
|
29
29
|
[](https://pypi.org/project/plotilleresample/)
|
|
@@ -42,7 +42,7 @@ Plotille rasterizes to a terminal canvas of braille dots: `width * 2` columns by
|
|
|
42
42
|
| `resample_plot_minmax_lttb` | minmax preselection + LTTB | shape-faithful line, large inputs |
|
|
43
43
|
| `resample_scatter` | uniform stride | large scatter inputs |
|
|
44
44
|
|
|
45
|
-
The uniform stride keeps one point every N: fast and predictable, but a narrow peak that falls between two kept points disappears from the plot. `resample_plot_minmax` instead makes one bucket per braille dot column and keeps the minimum and the maximum Y of each bucket, so the envelope of the signal
|
|
45
|
+
The uniform stride keeps one point every N: fast and predictable, but a narrow peak that falls between two kept points disappears from the plot. `resample_plot_minmax` instead makes one bucket per braille dot column and keeps the minimum and the maximum Y of each bucket, so the envelope of the signal, spikes included, always survives:
|
|
46
46
|
|
|
47
47
|
```python
|
|
48
48
|
X = list(range(10000))
|
|
@@ -56,11 +56,11 @@ _, y_minmax = plotilleresample.resample_plot_minmax(X, Y)
|
|
|
56
56
|
1000.0 in y_minmax # True: the envelope survives
|
|
57
57
|
```
|
|
58
58
|
|
|
59
|
-
`resample_plot_lttb` implements Largest-Triangle-Three-Buckets (Steinarsson, 2013): it always keeps the first and the last point and picks the most shape-representative point of each bucket, giving a single clean line that looks like the original. It keeps one point per bucket, so
|
|
59
|
+
`resample_plot_lttb` implements Largest-Triangle-Three-Buckets (Steinarsson, 2013): it always keeps the first and the last point and picks the most shape-representative point of each bucket, giving a single clean line that looks like the original. It keeps one point per bucket, so (unlike min/max) one of two opposing extremes falling in the same bucket can be dropped: shape fidelity instead of envelope guarantee.
|
|
60
60
|
|
|
61
|
-
`resample_plot_minmax_lttb` is the hybrid (MinMaxLTTB, Van der Donckt et al., 2023; the plotly-resampler default): on large inputs a minmax pass preselects the per bucket extremes and LTTB runs over those candidates only. Visually close to pure LTTB and faster, with a gap that grows with input size
|
|
61
|
+
`resample_plot_minmax_lttb` is the hybrid (MinMaxLTTB, Van der Donckt et al., 2023; the plotly-resampler default): on large inputs a minmax pass preselects the per bucket extremes and LTTB runs over those candidates only. Visually close to pure LTTB and faster, with a gap that grows with input size (about 1.6x end to end at 100,000 points, and about 3.4x on the resampling pass alone at 1,000,000), and the true extremes are always among the candidates.
|
|
62
62
|
|
|
63
|
-
All four plot resamplers work in sample order
|
|
63
|
+
All four plot resamplers work in sample order: they bucket by index, so X is expected to be already sorted, as in a time series (`resample_scatter` makes no ordering assumption). They keep at most `width * 4` points and `resample_scatter` keeps at most `width * 2 * height`, so plotille only receives what the canvas can actually display.
|
|
64
64
|
|
|
65
65
|
## Benchmark
|
|
66
66
|
|
|
@@ -93,7 +93,7 @@ uv add plotilleresample
|
|
|
93
93
|
pip install plotilleresample
|
|
94
94
|
```
|
|
95
95
|
|
|
96
|
-
plotilleresample has no runtime dependencies
|
|
96
|
+
plotilleresample has no runtime dependencies, not even plotille: it only reduces sequences. To run the example below, install [plotille](https://pypi.org/project/plotille/) as well (`uv add plotille` or `pip install plotille`).
|
|
97
97
|
|
|
98
98
|
## Usage
|
|
99
99
|
```python
|
|
@@ -111,4 +111,8 @@ X, Y = resample_plot_minmax_lttb(X, Y, width=80, height=40)
|
|
|
111
111
|
print(plotille.plot(X, Y, width=80, height=40))
|
|
112
112
|
```
|
|
113
113
|
|
|
114
|
-
The full interactive demo, running every resampler on the same dataset, lives in [`examples/demo.py`](examples/demo.py).
|
|
114
|
+
The full interactive demo, running every resampler on the same dataset, lives in [`examples/demo.py`](https://github.com/carlosplanchon/plotilleresample/blob/master/examples/demo.py).
|
|
115
|
+
|
|
116
|
+
## Acknowledgements
|
|
117
|
+
|
|
118
|
+
plotilleresample exists to serve [plotille](https://github.com/tammoippen/plotille) by Tammo Ippen, which now lists this project in its README. The min/max strategy grew out of the feedback in [plotille#22](https://github.com/tammoippen/plotille/issues/22), back in 2019.
|
|
@@ -1,7 +1,7 @@
|
|
|
1
1
|
# plotilleresample
|
|
2
|
-

|
|
2
|
+

|
|
3
3
|
|
|
4
|
-
*Python module to resample datasets before plotting with Plotille.*
|
|
4
|
+
*Python module to resample datasets before plotting with [Plotille](https://github.com/tammoippen/plotille).*
|
|
5
5
|
|
|
6
6
|
[](https://github.com/carlosplanchon/plotilleresample/actions/workflows/ci.yml)
|
|
7
7
|
[](https://pypi.org/project/plotilleresample/)
|
|
@@ -20,7 +20,7 @@ Plotille rasterizes to a terminal canvas of braille dots: `width * 2` columns by
|
|
|
20
20
|
| `resample_plot_minmax_lttb` | minmax preselection + LTTB | shape-faithful line, large inputs |
|
|
21
21
|
| `resample_scatter` | uniform stride | large scatter inputs |
|
|
22
22
|
|
|
23
|
-
The uniform stride keeps one point every N: fast and predictable, but a narrow peak that falls between two kept points disappears from the plot. `resample_plot_minmax` instead makes one bucket per braille dot column and keeps the minimum and the maximum Y of each bucket, so the envelope of the signal
|
|
23
|
+
The uniform stride keeps one point every N: fast and predictable, but a narrow peak that falls between two kept points disappears from the plot. `resample_plot_minmax` instead makes one bucket per braille dot column and keeps the minimum and the maximum Y of each bucket, so the envelope of the signal, spikes included, always survives:
|
|
24
24
|
|
|
25
25
|
```python
|
|
26
26
|
X = list(range(10000))
|
|
@@ -34,11 +34,11 @@ _, y_minmax = plotilleresample.resample_plot_minmax(X, Y)
|
|
|
34
34
|
1000.0 in y_minmax # True: the envelope survives
|
|
35
35
|
```
|
|
36
36
|
|
|
37
|
-
`resample_plot_lttb` implements Largest-Triangle-Three-Buckets (Steinarsson, 2013): it always keeps the first and the last point and picks the most shape-representative point of each bucket, giving a single clean line that looks like the original. It keeps one point per bucket, so
|
|
37
|
+
`resample_plot_lttb` implements Largest-Triangle-Three-Buckets (Steinarsson, 2013): it always keeps the first and the last point and picks the most shape-representative point of each bucket, giving a single clean line that looks like the original. It keeps one point per bucket, so (unlike min/max) one of two opposing extremes falling in the same bucket can be dropped: shape fidelity instead of envelope guarantee.
|
|
38
38
|
|
|
39
|
-
`resample_plot_minmax_lttb` is the hybrid (MinMaxLTTB, Van der Donckt et al., 2023; the plotly-resampler default): on large inputs a minmax pass preselects the per bucket extremes and LTTB runs over those candidates only. Visually close to pure LTTB and faster, with a gap that grows with input size
|
|
39
|
+
`resample_plot_minmax_lttb` is the hybrid (MinMaxLTTB, Van der Donckt et al., 2023; the plotly-resampler default): on large inputs a minmax pass preselects the per bucket extremes and LTTB runs over those candidates only. Visually close to pure LTTB and faster, with a gap that grows with input size (about 1.6x end to end at 100,000 points, and about 3.4x on the resampling pass alone at 1,000,000), and the true extremes are always among the candidates.
|
|
40
40
|
|
|
41
|
-
All four plot resamplers work in sample order
|
|
41
|
+
All four plot resamplers work in sample order: they bucket by index, so X is expected to be already sorted, as in a time series (`resample_scatter` makes no ordering assumption). They keep at most `width * 4` points and `resample_scatter` keeps at most `width * 2 * height`, so plotille only receives what the canvas can actually display.
|
|
42
42
|
|
|
43
43
|
## Benchmark
|
|
44
44
|
|
|
@@ -71,7 +71,7 @@ uv add plotilleresample
|
|
|
71
71
|
pip install plotilleresample
|
|
72
72
|
```
|
|
73
73
|
|
|
74
|
-
plotilleresample has no runtime dependencies
|
|
74
|
+
plotilleresample has no runtime dependencies, not even plotille: it only reduces sequences. To run the example below, install [plotille](https://pypi.org/project/plotille/) as well (`uv add plotille` or `pip install plotille`).
|
|
75
75
|
|
|
76
76
|
## Usage
|
|
77
77
|
```python
|
|
@@ -89,4 +89,8 @@ X, Y = resample_plot_minmax_lttb(X, Y, width=80, height=40)
|
|
|
89
89
|
print(plotille.plot(X, Y, width=80, height=40))
|
|
90
90
|
```
|
|
91
91
|
|
|
92
|
-
The full interactive demo, running every resampler on the same dataset, lives in [`examples/demo.py`](examples/demo.py).
|
|
92
|
+
The full interactive demo, running every resampler on the same dataset, lives in [`examples/demo.py`](https://github.com/carlosplanchon/plotilleresample/blob/master/examples/demo.py).
|
|
93
|
+
|
|
94
|
+
## Acknowledgements
|
|
95
|
+
|
|
96
|
+
plotilleresample exists to serve [plotille](https://github.com/tammoippen/plotille) by Tammo Ippen, which now lists this project in its README. The min/max strategy grew out of the feedback in [plotille#22](https://github.com/tammoippen/plotille/issues/22), back in 2019.
|
|
@@ -1,11 +1,11 @@
|
|
|
1
1
|
Metadata-Version: 2.4
|
|
2
2
|
Name: plotilleresample
|
|
3
|
-
Version: 1.0
|
|
3
|
+
Version: 1.0.2
|
|
4
4
|
Summary: Python module to resample datasets before plotting with Plotille.
|
|
5
5
|
Author-email: "Carlos A. Planchón" <carlosandresplanchonprestes@gmail.com>
|
|
6
6
|
License-Expression: MIT
|
|
7
7
|
Project-URL: Homepage, https://github.com/carlosplanchon/plotilleresample
|
|
8
|
-
Keywords: plotting,ascii,math,resample
|
|
8
|
+
Keywords: plotting,ascii,math,resample,plotille
|
|
9
9
|
Classifier: Intended Audience :: Developers
|
|
10
10
|
Classifier: Topic :: Scientific/Engineering :: Visualization
|
|
11
11
|
Classifier: Topic :: Terminals
|
|
@@ -21,9 +21,9 @@ License-File: LICENSE
|
|
|
21
21
|
Dynamic: license-file
|
|
22
22
|
|
|
23
23
|
# plotilleresample
|
|
24
|
-

|
|
24
|
+

|
|
25
25
|
|
|
26
|
-
*Python module to resample datasets before plotting with Plotille.*
|
|
26
|
+
*Python module to resample datasets before plotting with [Plotille](https://github.com/tammoippen/plotille).*
|
|
27
27
|
|
|
28
28
|
[](https://github.com/carlosplanchon/plotilleresample/actions/workflows/ci.yml)
|
|
29
29
|
[](https://pypi.org/project/plotilleresample/)
|
|
@@ -42,7 +42,7 @@ Plotille rasterizes to a terminal canvas of braille dots: `width * 2` columns by
|
|
|
42
42
|
| `resample_plot_minmax_lttb` | minmax preselection + LTTB | shape-faithful line, large inputs |
|
|
43
43
|
| `resample_scatter` | uniform stride | large scatter inputs |
|
|
44
44
|
|
|
45
|
-
The uniform stride keeps one point every N: fast and predictable, but a narrow peak that falls between two kept points disappears from the plot. `resample_plot_minmax` instead makes one bucket per braille dot column and keeps the minimum and the maximum Y of each bucket, so the envelope of the signal
|
|
45
|
+
The uniform stride keeps one point every N: fast and predictable, but a narrow peak that falls between two kept points disappears from the plot. `resample_plot_minmax` instead makes one bucket per braille dot column and keeps the minimum and the maximum Y of each bucket, so the envelope of the signal, spikes included, always survives:
|
|
46
46
|
|
|
47
47
|
```python
|
|
48
48
|
X = list(range(10000))
|
|
@@ -56,11 +56,11 @@ _, y_minmax = plotilleresample.resample_plot_minmax(X, Y)
|
|
|
56
56
|
1000.0 in y_minmax # True: the envelope survives
|
|
57
57
|
```
|
|
58
58
|
|
|
59
|
-
`resample_plot_lttb` implements Largest-Triangle-Three-Buckets (Steinarsson, 2013): it always keeps the first and the last point and picks the most shape-representative point of each bucket, giving a single clean line that looks like the original. It keeps one point per bucket, so
|
|
59
|
+
`resample_plot_lttb` implements Largest-Triangle-Three-Buckets (Steinarsson, 2013): it always keeps the first and the last point and picks the most shape-representative point of each bucket, giving a single clean line that looks like the original. It keeps one point per bucket, so (unlike min/max) one of two opposing extremes falling in the same bucket can be dropped: shape fidelity instead of envelope guarantee.
|
|
60
60
|
|
|
61
|
-
`resample_plot_minmax_lttb` is the hybrid (MinMaxLTTB, Van der Donckt et al., 2023; the plotly-resampler default): on large inputs a minmax pass preselects the per bucket extremes and LTTB runs over those candidates only. Visually close to pure LTTB and faster, with a gap that grows with input size
|
|
61
|
+
`resample_plot_minmax_lttb` is the hybrid (MinMaxLTTB, Van der Donckt et al., 2023; the plotly-resampler default): on large inputs a minmax pass preselects the per bucket extremes and LTTB runs over those candidates only. Visually close to pure LTTB and faster, with a gap that grows with input size (about 1.6x end to end at 100,000 points, and about 3.4x on the resampling pass alone at 1,000,000), and the true extremes are always among the candidates.
|
|
62
62
|
|
|
63
|
-
All four plot resamplers work in sample order
|
|
63
|
+
All four plot resamplers work in sample order: they bucket by index, so X is expected to be already sorted, as in a time series (`resample_scatter` makes no ordering assumption). They keep at most `width * 4` points and `resample_scatter` keeps at most `width * 2 * height`, so plotille only receives what the canvas can actually display.
|
|
64
64
|
|
|
65
65
|
## Benchmark
|
|
66
66
|
|
|
@@ -93,7 +93,7 @@ uv add plotilleresample
|
|
|
93
93
|
pip install plotilleresample
|
|
94
94
|
```
|
|
95
95
|
|
|
96
|
-
plotilleresample has no runtime dependencies
|
|
96
|
+
plotilleresample has no runtime dependencies, not even plotille: it only reduces sequences. To run the example below, install [plotille](https://pypi.org/project/plotille/) as well (`uv add plotille` or `pip install plotille`).
|
|
97
97
|
|
|
98
98
|
## Usage
|
|
99
99
|
```python
|
|
@@ -111,4 +111,8 @@ X, Y = resample_plot_minmax_lttb(X, Y, width=80, height=40)
|
|
|
111
111
|
print(plotille.plot(X, Y, width=80, height=40))
|
|
112
112
|
```
|
|
113
113
|
|
|
114
|
-
The full interactive demo, running every resampler on the same dataset, lives in [`examples/demo.py`](examples/demo.py).
|
|
114
|
+
The full interactive demo, running every resampler on the same dataset, lives in [`examples/demo.py`](https://github.com/carlosplanchon/plotilleresample/blob/master/examples/demo.py).
|
|
115
|
+
|
|
116
|
+
## Acknowledgements
|
|
117
|
+
|
|
118
|
+
plotilleresample exists to serve [plotille](https://github.com/tammoippen/plotille) by Tammo Ippen, which now lists this project in its README. The min/max strategy grew out of the feedback in [plotille#22](https://github.com/tammoippen/plotille/issues/22), back in 2019.
|
|
@@ -4,7 +4,7 @@ build-backend = "setuptools.build_meta"
|
|
|
4
4
|
|
|
5
5
|
[project]
|
|
6
6
|
name = "plotilleresample"
|
|
7
|
-
version = "1.0"
|
|
7
|
+
version = "1.0.2"
|
|
8
8
|
description = "Python module to resample datasets before plotting with Plotille."
|
|
9
9
|
readme = "README.md"
|
|
10
10
|
|
|
@@ -14,7 +14,7 @@ license-files = ["LICENSE"]
|
|
|
14
14
|
authors = [
|
|
15
15
|
{name = "Carlos A. Planchón", email = "carlosandresplanchonprestes@gmail.com"}
|
|
16
16
|
]
|
|
17
|
-
keywords = ["plotting", "ascii", "math", "resample"]
|
|
17
|
+
keywords = ["plotting", "ascii", "math", "resample", "plotille"]
|
|
18
18
|
classifiers = [
|
|
19
19
|
"Intended Audience :: Developers",
|
|
20
20
|
"Topic :: Scientific/Engineering :: Visualization",
|
|
File without changes
|
|
File without changes
|
|
File without changes
|
|
File without changes
|
{plotilleresample-1.0 → plotilleresample-1.0.2}/plotilleresample.egg-info/dependency_links.txt
RENAMED
|
File without changes
|
|
File without changes
|
|
File without changes
|
|
File without changes
|