plotext-plus 1.0.5__tar.gz → 1.0.8__tar.gz
This diff represents the content of publicly available package versions that have been released to one of the supported registries. The information contained in this diff is provided for informational purposes only and reflects changes between package versions as they appear in their respective public registries.
- {plotext_plus-1.0.5 → plotext_plus-1.0.8}/.gitignore +3 -3
- {plotext_plus-1.0.5 → plotext_plus-1.0.8}/PKG-INFO +4 -5
- {plotext_plus-1.0.5 → plotext_plus-1.0.8}/README.md +3 -4
- {plotext_plus-1.0.5 → plotext_plus-1.0.8}/docs/basic.md +145 -1
- {plotext_plus-1.0.5 → plotext_plus-1.0.8}/docs/chart_classes.md +72 -0
- {plotext_plus-1.0.5 → plotext_plus-1.0.8}/docs/environments.md +2 -2
- {plotext_plus-1.0.5 → plotext_plus-1.0.8}/docs/image.md +2 -2
- {plotext_plus-1.0.5 → plotext_plus-1.0.8}/docs/mcp-server.md +115 -1
- {plotext_plus-1.0.5 → plotext_plus-1.0.8}/examples/interactive_demo.py +268 -58
- {plotext_plus-1.0.5 → plotext_plus-1.0.8}/pyproject.toml +1 -1
- {plotext_plus-1.0.5 → plotext_plus-1.0.8}/src/plotext_plus/__init__.py +1 -1
- {plotext_plus-1.0.5 → plotext_plus-1.0.8}/src/plotext_plus/_api.py +51 -0
- {plotext_plus-1.0.5 → plotext_plus-1.0.8}/src/plotext_plus/_core.py +21 -0
- {plotext_plus-1.0.5 → plotext_plus-1.0.8}/src/plotext_plus/_dict.py +2 -2
- {plotext_plus-1.0.5 → plotext_plus-1.0.8}/src/plotext_plus/_figure.py +3 -0
- {plotext_plus-1.0.5 → plotext_plus-1.0.8}/src/plotext_plus/_monitor.py +403 -0
- {plotext_plus-1.0.5 → plotext_plus-1.0.8}/src/plotext_plus/_themes.py +3 -2
- {plotext_plus-1.0.5 → plotext_plus-1.0.8}/src/plotext_plus/charts.py +2 -2
- {plotext_plus-1.0.5 → plotext_plus-1.0.8}/src/plotext_plus/mcp_server.py +306 -0
- {plotext_plus-1.0.5 → plotext_plus-1.0.8}/src/plotext_plus/plotting.py +1 -1
- plotext_plus-1.0.8/tests/test_aspect_ratio.py +57 -0
- plotext_plus-1.0.8/tests/test_doughnut_simple.py +149 -0
- plotext_plus-1.0.8/tests/test_final_pie.py +62 -0
- plotext_plus-1.0.8/tests/test_legend_colors.py +50 -0
- plotext_plus-1.0.8/tests/test_pie_chart.py +45 -0
- plotext_plus-1.0.8/tests/test_pie_fill.py +61 -0
- plotext_plus-1.0.8/tests/test_pie_gaps.py +69 -0
- plotext_plus-1.0.8/tests/test_pie_slices.py +37 -0
- {plotext_plus-1.0.5 → plotext_plus-1.0.8}/LICENSE +0 -0
- {plotext_plus-1.0.5 → plotext_plus-1.0.8}/docs/api.md +0 -0
- {plotext_plus-1.0.5 → plotext_plus-1.0.8}/docs/aspect.md +0 -0
- {plotext_plus-1.0.5 → plotext_plus-1.0.8}/docs/bar.md +0 -0
- {plotext_plus-1.0.5 → plotext_plus-1.0.8}/docs/datetime.md +0 -0
- {plotext_plus-1.0.5 → plotext_plus-1.0.8}/docs/decorator.md +0 -0
- {plotext_plus-1.0.5 → plotext_plus-1.0.8}/docs/notes.md +0 -0
- {plotext_plus-1.0.5 → plotext_plus-1.0.8}/docs/settings.md +0 -0
- {plotext_plus-1.0.5 → plotext_plus-1.0.8}/docs/special.md +0 -0
- {plotext_plus-1.0.5 → plotext_plus-1.0.8}/docs/subplots.md +0 -0
- {plotext_plus-1.0.5 → plotext_plus-1.0.8}/docs/themes.md +0 -0
- {plotext_plus-1.0.5 → plotext_plus-1.0.8}/docs/utilities.md +0 -0
- {plotext_plus-1.0.5 → plotext_plus-1.0.8}/docs/video.md +0 -0
- {plotext_plus-1.0.5 → plotext_plus-1.0.8}/examples/advanced_features.py +0 -0
- {plotext_plus-1.0.5 → plotext_plus-1.0.8}/examples/basic_plots.py +0 -0
- {plotext_plus-1.0.5 → plotext_plus-1.0.8}/examples/chart_classes_demo.py +0 -0
- {plotext_plus-1.0.5 → plotext_plus-1.0.8}/examples/theme_showcase_demo.py +0 -0
- {plotext_plus-1.0.5 → plotext_plus-1.0.8}/src/plotext_plus/__main__.py +0 -0
- {plotext_plus-1.0.5 → plotext_plus-1.0.8}/src/plotext_plus/_build.py +0 -0
- {plotext_plus-1.0.5 → plotext_plus-1.0.8}/src/plotext_plus/_date.py +0 -0
- {plotext_plus-1.0.5 → plotext_plus-1.0.8}/src/plotext_plus/_default.py +0 -0
- {plotext_plus-1.0.5 → plotext_plus-1.0.8}/src/plotext_plus/_doc.py +0 -0
- {plotext_plus-1.0.5 → plotext_plus-1.0.8}/src/plotext_plus/_doc_utils.py +0 -0
- {plotext_plus-1.0.5 → plotext_plus-1.0.8}/src/plotext_plus/_global.py +0 -0
- {plotext_plus-1.0.5 → plotext_plus-1.0.8}/src/plotext_plus/_matrix.py +0 -0
- {plotext_plus-1.0.5 → plotext_plus-1.0.8}/src/plotext_plus/_output.py +0 -0
- {plotext_plus-1.0.5 → plotext_plus-1.0.8}/src/plotext_plus/_shtab.py +0 -0
- {plotext_plus-1.0.5 → plotext_plus-1.0.8}/src/plotext_plus/_utility.py +0 -0
- {plotext_plus-1.0.5 → plotext_plus-1.0.8}/src/plotext_plus/api.py +0 -0
- {plotext_plus-1.0.5 → plotext_plus-1.0.8}/src/plotext_plus/core.py +0 -0
- {plotext_plus-1.0.5 → plotext_plus-1.0.8}/src/plotext_plus/mcp_cli.py +0 -0
- {plotext_plus-1.0.5 → plotext_plus-1.0.8}/src/plotext_plus/plotext_cli.py +0 -0
- {plotext_plus-1.0.5 → plotext_plus-1.0.8}/src/plotext_plus/themes.py +0 -0
- {plotext_plus-1.0.5 → plotext_plus-1.0.8}/src/plotext_plus/utilities.py +0 -0
- {plotext_plus-1.0.5 → plotext_plus-1.0.8}/src/plotext_plus/utils.py +0 -0
- {plotext_plus-1.0.5 → plotext_plus-1.0.8}/tests/__init__.py +0 -0
- {plotext_plus-1.0.5 → plotext_plus-1.0.8}/tests/test_chart_classes.py +0 -0
- {plotext_plus-1.0.5 → plotext_plus-1.0.8}/tests/test_image_video.py +0 -0
- {plotext_plus-1.0.5 → plotext_plus-1.0.8}/tests/test_integration.py +0 -0
- {plotext_plus-1.0.5 → plotext_plus-1.0.8}/tests/test_new_api.py +0 -0
|
@@ -1,6 +1,6 @@
|
|
|
1
1
|
Metadata-Version: 2.4
|
|
2
2
|
Name: plotext_plus
|
|
3
|
-
Version: 1.0.
|
|
3
|
+
Version: 1.0.8
|
|
4
4
|
Summary: Modern terminal plotting library with enhanced visual features, themes, and AI integration
|
|
5
5
|
Project-URL: Homepage, https://github.com/ccmitchellusa/plotext_plus
|
|
6
6
|
Project-URL: Repository, https://github.com/ccmitchellusa/plotext_plus.git
|
|
@@ -42,18 +42,17 @@ Description-Content-Type: text/markdown
|
|
|
42
42
|
# 📊 Plotext+ - Modern Terminal Plotting
|
|
43
43
|
|
|
44
44
|
[](https://badge.fury.io/py/plotext_plus)
|
|
45
|
-
[](https://github.com/ccmitchellusa/plotext_plus/stargazers)
|
|
46
45
|
[](https://pepy.tech/project/plotext_plus)
|
|
47
46
|
[](https://github.com/ccmitchellusa/plotext_plus/issues)
|
|
48
47
|
[](https://github.com/ccmitchellusa/plotext_plus/pulls)
|
|
49
48
|
|
|
50
|
-

|
|
51
50
|
|
|
52
51
|
**Plotext+ plots directly in your terminal** with stunning visuals, modern APIs, and professional styling. Plotext+ is a redesigned version of the original [plotext](https://github.com/piccolomo/plotext) library by Savino Piccolomo. New features include an updated API with object oriented features, an MCP server to make the project easily usable with AI & LLM scenarios, new themes and integration with chuk-term to make sure it works in the awesome [mcp-cli](https://github.com/chrishayuk/mcp-cli) by Chris Hay.
|
|
53
52
|
|
|
54
53
|
## ✨ Key Features
|
|
55
54
|
|
|
56
|
-
🎯 **Multiple Plot Types**: [scatter](docs/basic.md#scatter-plot), [line](docs/basic.md#line-plot), [bar](docs/bar.md), [histogram](docs/bar.md#histogram-plot), [candlestick](docs/datetime.md#candlestick-plot), [heatmap](docs/special.md), [confusion matrix](docs/special.md#confusion-matrix), and more
|
|
55
|
+
🎯 **Multiple Plot Types**: [scatter](docs/basic.md#scatter-plot), [line](docs/basic.md#line-plot), [bar](docs/bar.md), [histogram](docs/bar.md#histogram-plot), [candlestick](docs/datetime.md#candlestick-plot), [heatmap](docs/special.md), [confusion matrix](docs/special.md#confusion-matrix), [pie](docs/basic.md#pie-plot), [doughnut](docs/basic.md#doughnut-charts) and more
|
|
57
56
|
|
|
58
57
|
🎨 **Rich Visuals**: [Banner mode](docs/chart_classes.md), [themes](docs/themes.md), [colored text](docs/utilities.md#colored-text), automatic terminal width detection
|
|
59
58
|
|
|
@@ -65,7 +64,7 @@ Description-Content-Type: text/markdown
|
|
|
65
64
|
|
|
66
65
|
⚡ **Zero Dependencies**: No required dependencies (optional packages for multimedia and AI integration)
|
|
67
66
|
|
|
68
|
-

|
|
69
68
|
|
|
70
69
|
## 🚀 Quick Start
|
|
71
70
|
|
|
@@ -1,18 +1,17 @@
|
|
|
1
1
|
# 📊 Plotext+ - Modern Terminal Plotting
|
|
2
2
|
|
|
3
3
|
[](https://badge.fury.io/py/plotext_plus)
|
|
4
|
-
[](https://github.com/ccmitchellusa/plotext_plus/stargazers)
|
|
5
4
|
[](https://pepy.tech/project/plotext_plus)
|
|
6
5
|
[](https://github.com/ccmitchellusa/plotext_plus/issues)
|
|
7
6
|
[](https://github.com/ccmitchellusa/plotext_plus/pulls)
|
|
8
7
|
|
|
9
|
-

|
|
10
9
|
|
|
11
10
|
**Plotext+ plots directly in your terminal** with stunning visuals, modern APIs, and professional styling. Plotext+ is a redesigned version of the original [plotext](https://github.com/piccolomo/plotext) library by Savino Piccolomo. New features include an updated API with object oriented features, an MCP server to make the project easily usable with AI & LLM scenarios, new themes and integration with chuk-term to make sure it works in the awesome [mcp-cli](https://github.com/chrishayuk/mcp-cli) by Chris Hay.
|
|
12
11
|
|
|
13
12
|
## ✨ Key Features
|
|
14
13
|
|
|
15
|
-
🎯 **Multiple Plot Types**: [scatter](docs/basic.md#scatter-plot), [line](docs/basic.md#line-plot), [bar](docs/bar.md), [histogram](docs/bar.md#histogram-plot), [candlestick](docs/datetime.md#candlestick-plot), [heatmap](docs/special.md), [confusion matrix](docs/special.md#confusion-matrix), and more
|
|
14
|
+
🎯 **Multiple Plot Types**: [scatter](docs/basic.md#scatter-plot), [line](docs/basic.md#line-plot), [bar](docs/bar.md), [histogram](docs/bar.md#histogram-plot), [candlestick](docs/datetime.md#candlestick-plot), [heatmap](docs/special.md), [confusion matrix](docs/special.md#confusion-matrix), [pie](docs/basic.md#pie-plot), [doughnut](docs/basic.md#doughnut-charts) and more
|
|
16
15
|
|
|
17
16
|
🎨 **Rich Visuals**: [Banner mode](docs/chart_classes.md), [themes](docs/themes.md), [colored text](docs/utilities.md#colored-text), automatic terminal width detection
|
|
18
17
|
|
|
@@ -24,7 +23,7 @@
|
|
|
24
23
|
|
|
25
24
|
⚡ **Zero Dependencies**: No required dependencies (optional packages for multimedia and AI integration)
|
|
26
25
|
|
|
27
|
-

|
|
28
27
|
|
|
29
28
|
## 🚀 Quick Start
|
|
30
29
|
|
|
@@ -5,6 +5,7 @@
|
|
|
5
5
|
- [Line Plot](https://github.com/ccmitchellusa/plotext_plus/blob/master/docs/basic.md#line-plot)
|
|
6
6
|
- [Log Plot](https://github.com/ccmitchellusa/plotext_plus/blob/master/docs/basic.md#log-plot)
|
|
7
7
|
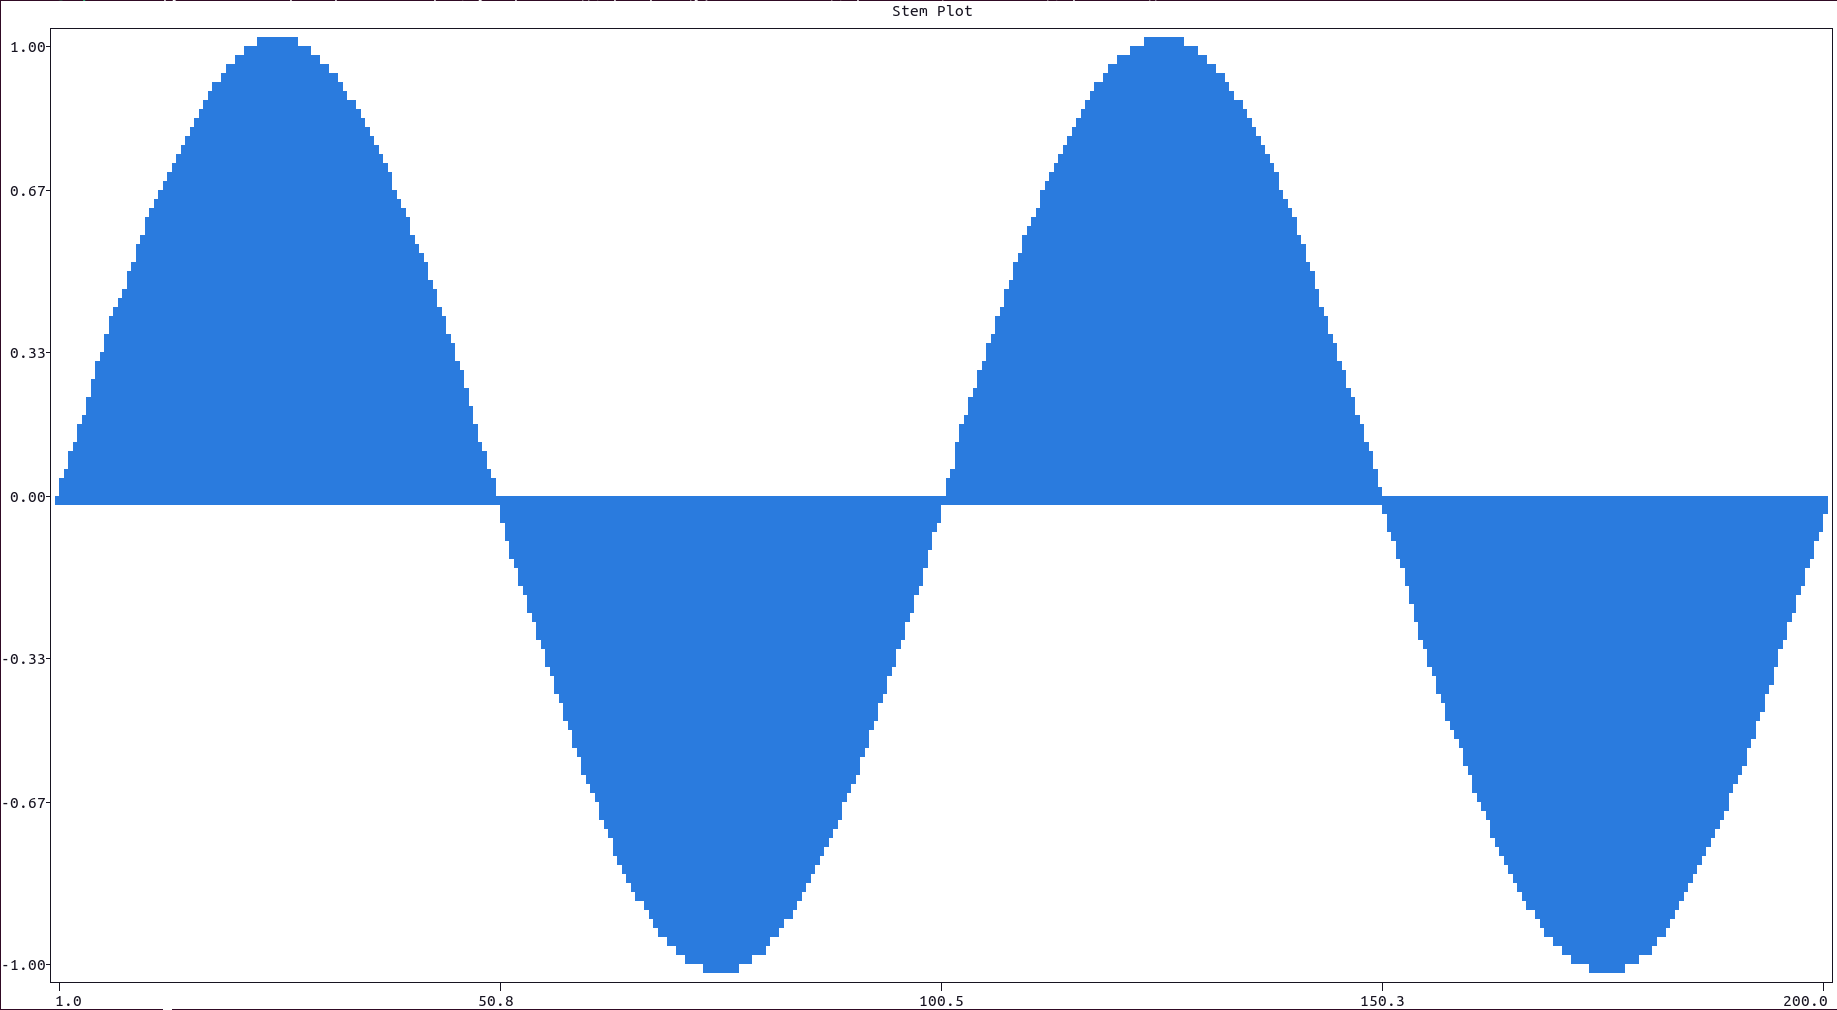
- [Stem Plot](https://github.com/ccmitchellusa/plotext_plus/blob/master/docs/basic.md#stem-plot)
|
|
8
|
+
- [Pie Plot](https://github.com/ccmitchellusa/plotext_plus/blob/master/docs/basic.md#pie-plot)
|
|
8
9
|
- [Multiple Data Sets](https://github.com/ccmitchellusa/plotext_plus/blob/master/docs/basic.md#multiple-data-sets)
|
|
9
10
|
- [Multiple Axes Plot](https://github.com/ccmitchellusa/plotext_plus/blob/master/docs/basic.md#multiple-axes-plot)
|
|
10
11
|
|
|
@@ -23,7 +24,7 @@ plt.title("My First Plot")
|
|
|
23
24
|
plt.show()
|
|
24
25
|
```
|
|
25
26
|
|
|
26
|
-
### Modern Object-Oriented API
|
|
27
|
+
### Modern Object-Oriented API
|
|
27
28
|
|
|
28
29
|
```python
|
|
29
30
|
import plotext_plus as plt
|
|
@@ -197,6 +198,149 @@ python3 -c "import plotext_plus as plt; y = plt.sin(); plt.plot(y, fillx = True)
|
|
|
197
198
|
|
|
198
199
|
[Main Guide](https://github.com/ccmitchellusa/plotext_plus#guide), [Basic Plots](https://github.com/ccmitchellusa/plotext_plus/blob/master/docs/basic.md#basic-plots)
|
|
199
200
|
|
|
201
|
+
## Pie Plot
|
|
202
|
+
|
|
203
|
+
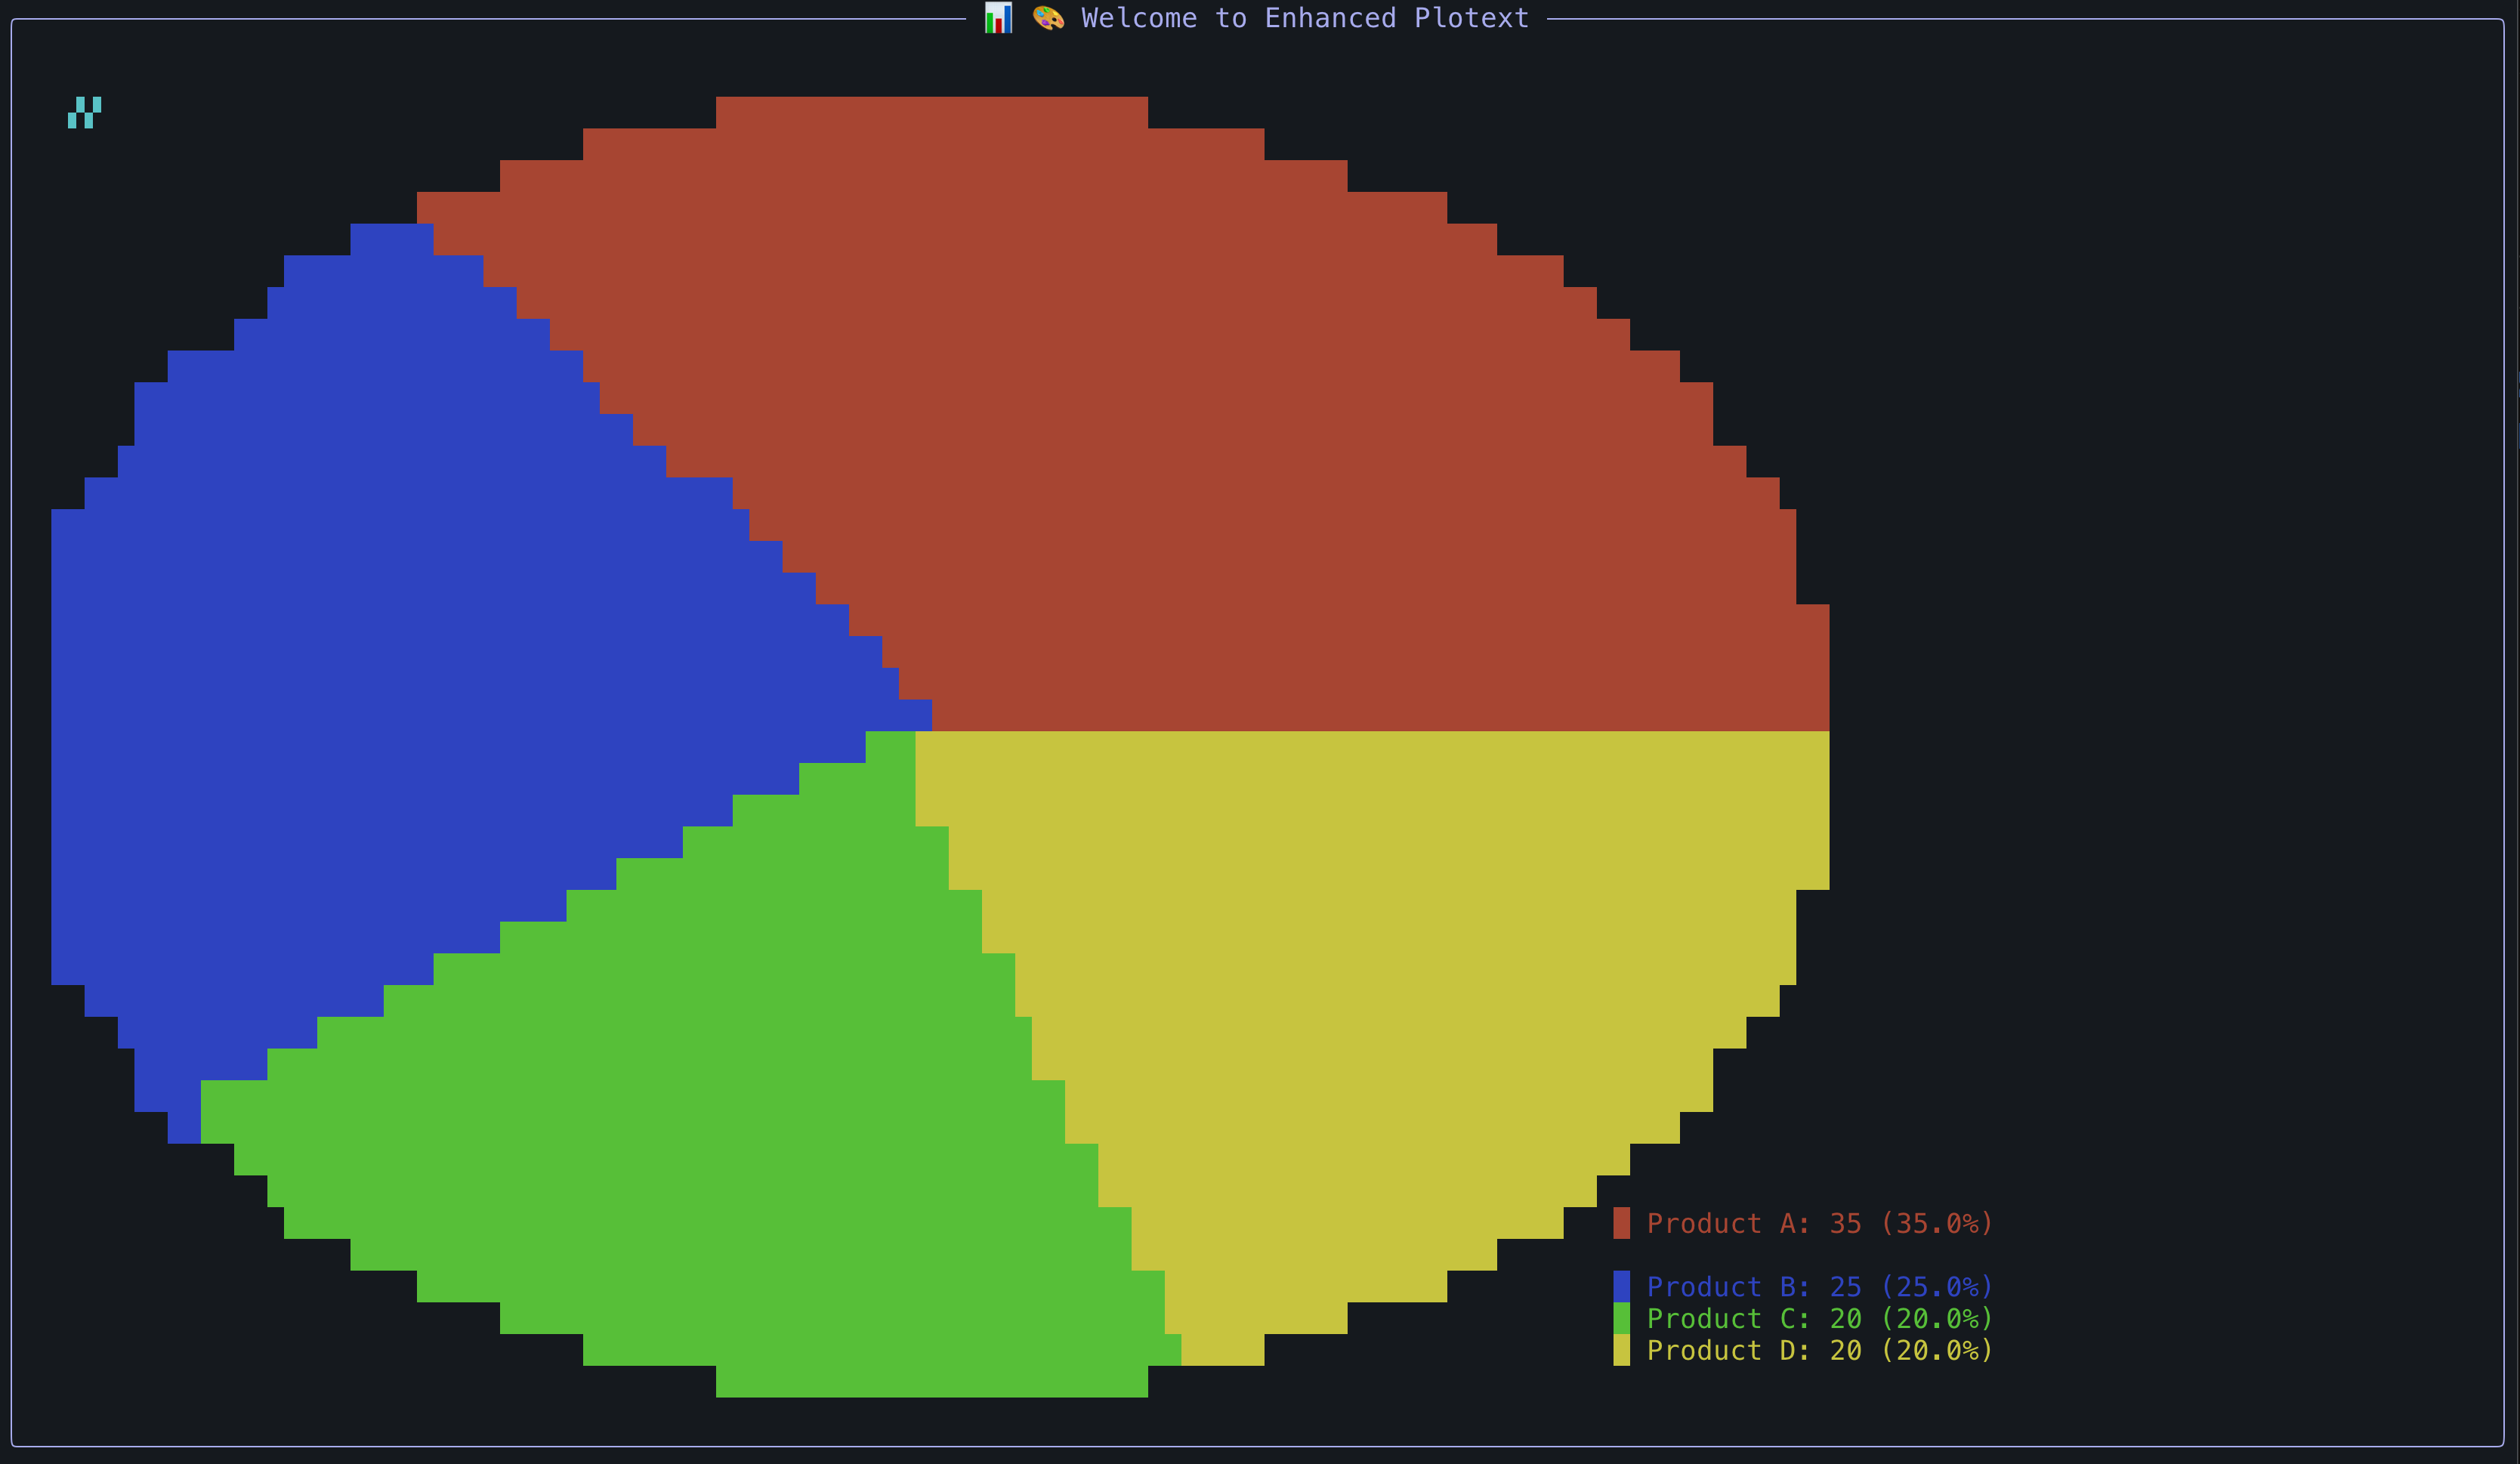
For a pie chart visualization use the `pie()` function. Pie charts are ideal for showing proportional data and work best with a small number of segments for better terminal readability.
|
|
204
|
+
|
|
205
|
+
|
|
206
|
+
|
|
207
|
+
**Best Practices for Pie Charts**:
|
|
208
|
+
|
|
209
|
+
- Use full terminal dimensions for optimal resolution: `plt.plotsize(terminal_width, terminal_height - 5)`
|
|
210
|
+
- Limit to 4-6 data segments for clarity in terminal environment
|
|
211
|
+
- Each segment will be rendered with solid block characters and proper aspect ratio
|
|
212
|
+
|
|
213
|
+
Here is an example:
|
|
214
|
+
|
|
215
|
+
```python
|
|
216
|
+
import plotext_plus as plt
|
|
217
|
+
|
|
218
|
+
# Sample data
|
|
219
|
+
labels = ["Python", "JavaScript", "Go", "Rust"]
|
|
220
|
+
values = [45, 30, 15, 10]
|
|
221
|
+
colors = ["blue", "green", "orange", "red"]
|
|
222
|
+
|
|
223
|
+
# Create pie chart using full terminal dimensions
|
|
224
|
+
terminal_width, terminal_height = plt.terminal_size()
|
|
225
|
+
plt.clear_figure()
|
|
226
|
+
plt.plotsize(terminal_width, terminal_height - 5)
|
|
227
|
+
|
|
228
|
+
plt.pie(labels, values, colors=colors, title="Programming Languages Usage")
|
|
229
|
+
plt.show()
|
|
230
|
+
```
|
|
231
|
+
|
|
232
|
+
or directly on terminal:
|
|
233
|
+
|
|
234
|
+
```console
|
|
235
|
+
python3 -c "import plotext_plus as plt; labels = ['Python', 'JS', 'Go', 'Rust']; values = [45, 30, 15, 10]; w, h = plt.terminal_size(); plt.clear_figure(); plt.plotsize(w, h-5); plt.pie(labels, values, title='Languages'); plt.show()"
|
|
236
|
+
```
|
|
237
|
+
|
|
238
|
+
**Key Features**:
|
|
239
|
+
|
|
240
|
+
- **Colored block legend**: Each data label is prefixed with a colored block (█) matching the segment
|
|
241
|
+
- **Percentage display**: Shows both values and percentages in the legend
|
|
242
|
+
- **Dynamic sizing**: Radius automatically adjusts to terminal dimensions
|
|
243
|
+
- **Aspect ratio correction**: Ensures circular appearance across different plot sizes
|
|
244
|
+
- **Gap-free rendering**: Comprehensive scanning ensures solid segment filling
|
|
245
|
+
|
|
246
|
+
**Parameters**:
|
|
247
|
+
|
|
248
|
+
- `labels`: List of segment labels
|
|
249
|
+
- `values`: List of corresponding values (will be converted to percentages)
|
|
250
|
+
- `colors`: Optional list of colors for segments (defaults to standard palette)
|
|
251
|
+
- `radius`: Optional custom radius (defaults to optimal size for terminal)
|
|
252
|
+
- `show_values`: Show numeric values in legend (default: True)
|
|
253
|
+
- `show_percentages`: Show percentage values in legend (default: True)
|
|
254
|
+
- `show_values_on_slices`: Display values directly on pie segments (default: False)
|
|
255
|
+
- `title`: Chart title
|
|
256
|
+
|
|
257
|
+
### Single-Value Pie Charts
|
|
258
|
+
|
|
259
|
+
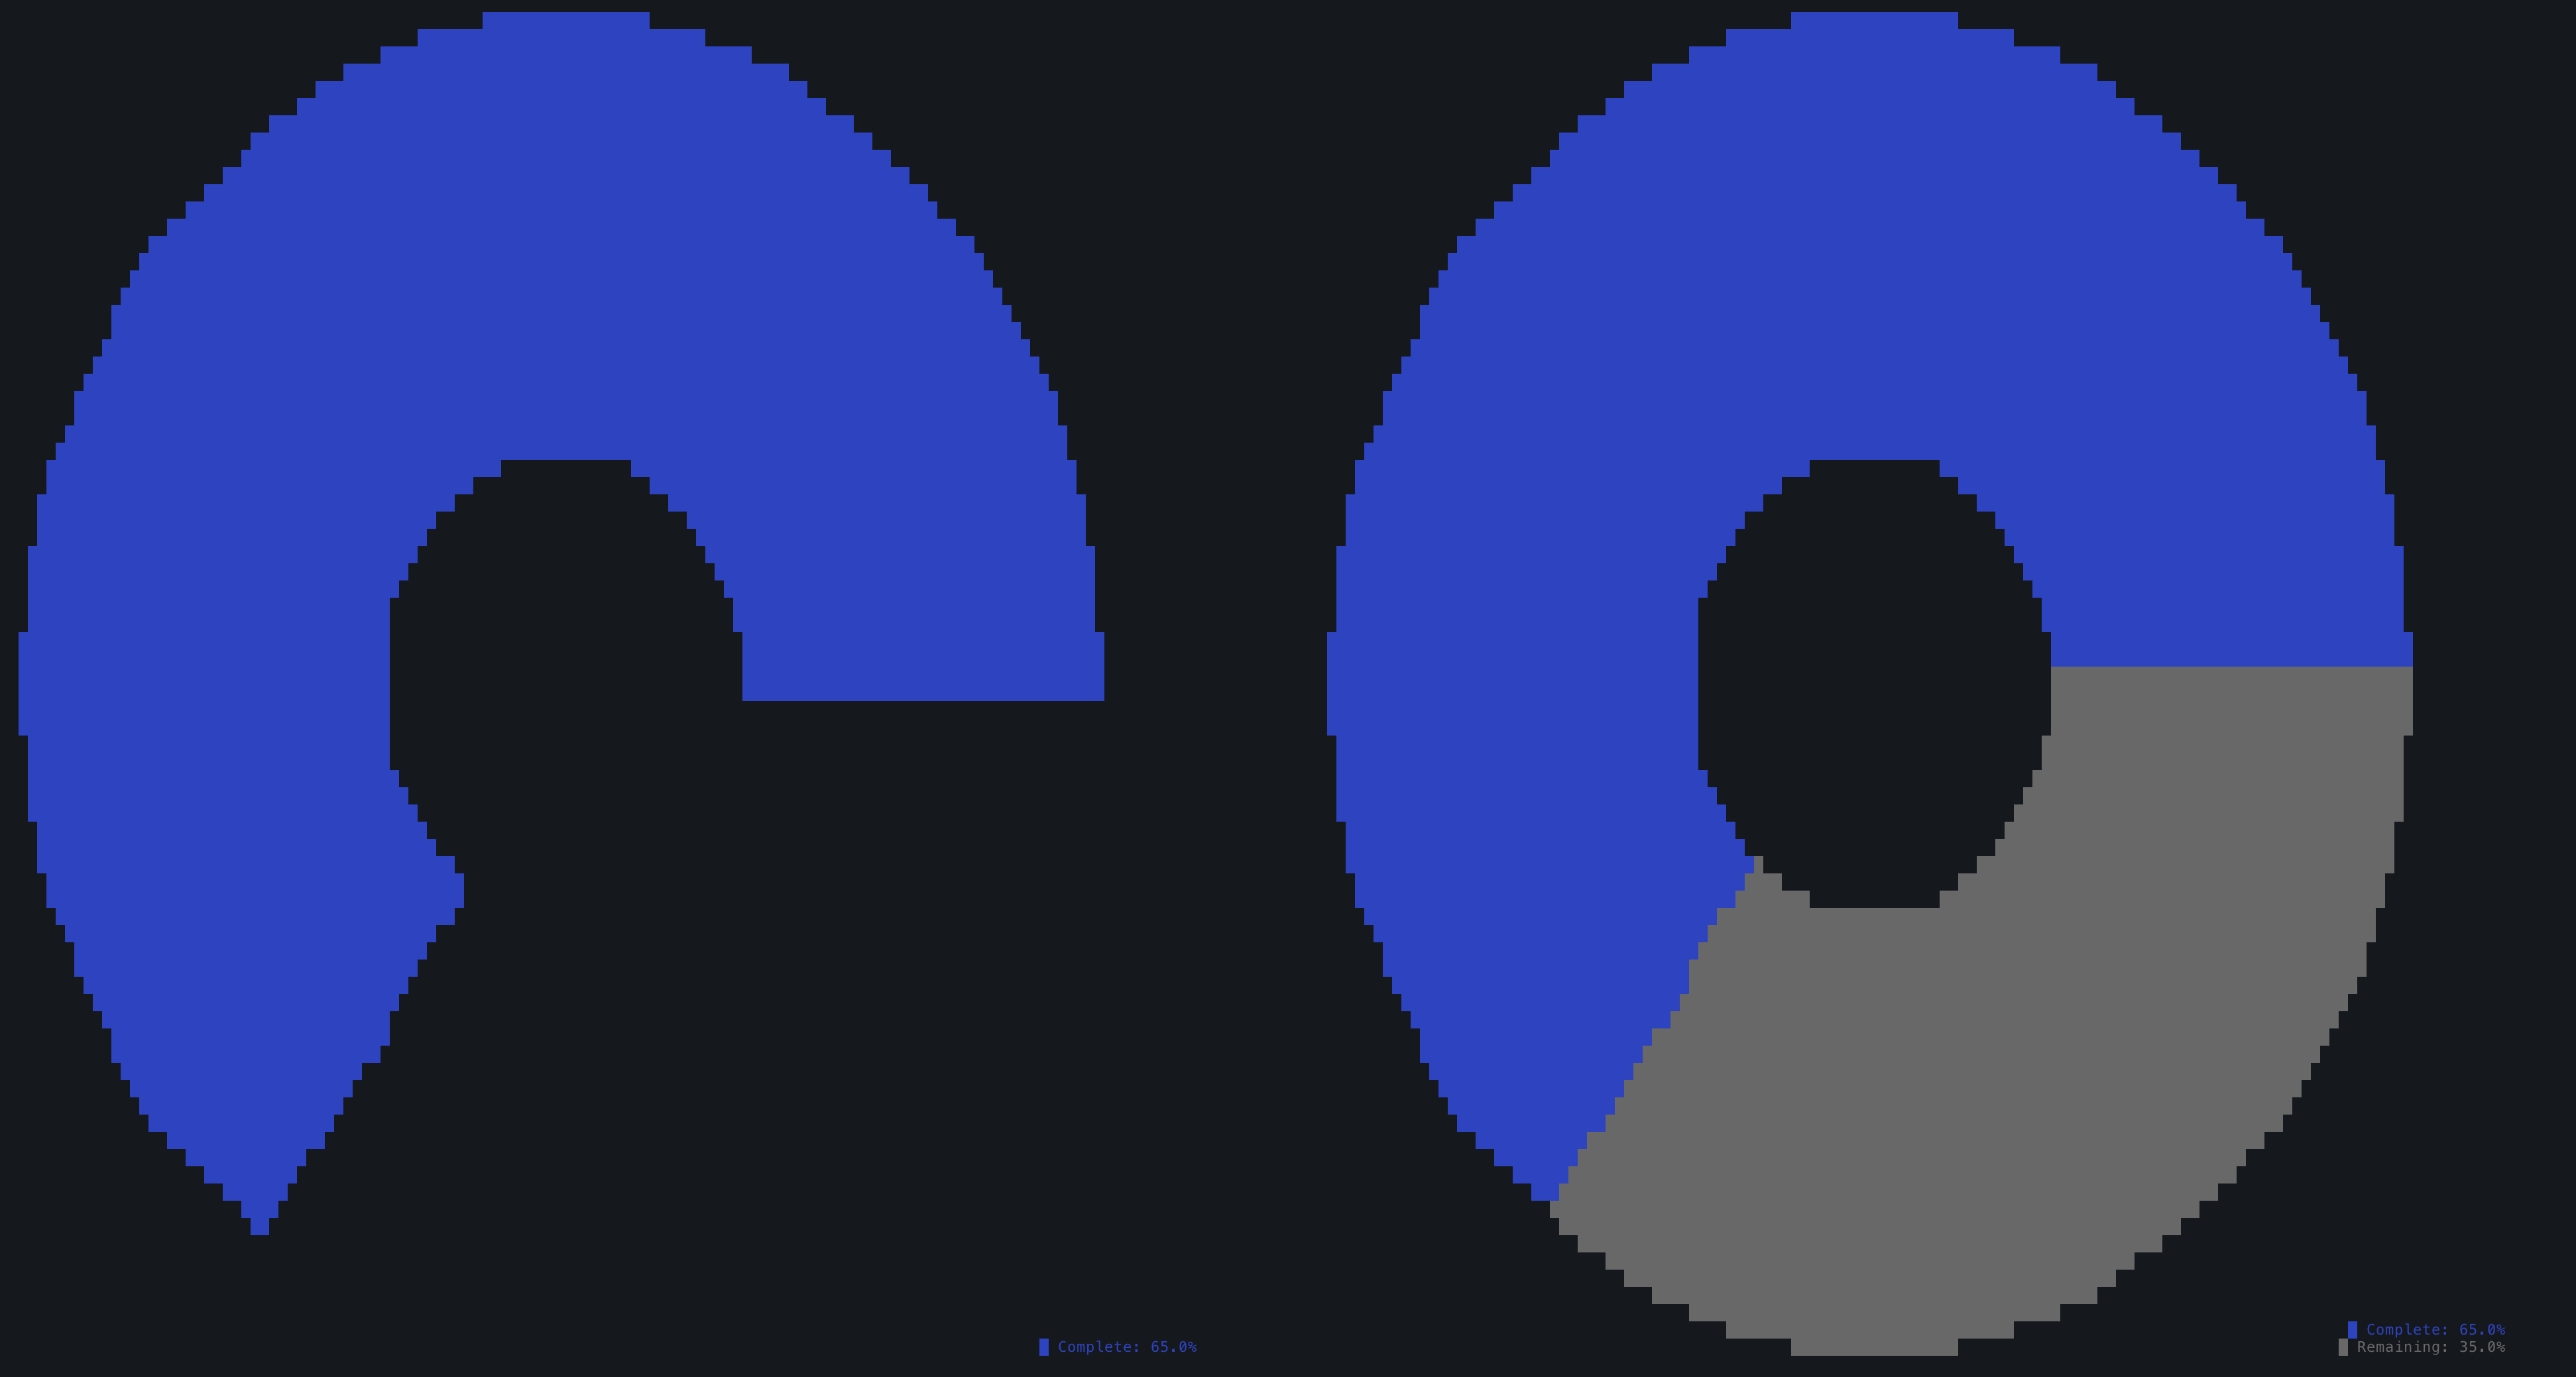
Single-value pie charts are perfect for progress indicators, completion rates, and other single-metric visualizations. They show a colored segment for the data value and handle the remainder specially.
|
|
260
|
+
|
|
261
|
+

|
|
262
|
+
|
|
263
|
+
```python
|
|
264
|
+
import plotext_plus as plt
|
|
265
|
+
|
|
266
|
+
# Basic single-value pie chart (remainder as spaces)
|
|
267
|
+
plt.clear_figure()
|
|
268
|
+
plt.plotsize(50, 12)
|
|
269
|
+
plt.pie(["Progress", "Remaining"], [75, 25], colors=["green", "default"],
|
|
270
|
+
show_values=False, show_percentages=True,
|
|
271
|
+
title="Project Progress: 75%")
|
|
272
|
+
plt.show()
|
|
273
|
+
|
|
274
|
+
# Single-value pie with colored remainder
|
|
275
|
+
plt.clear_figure()
|
|
276
|
+
plt.pie(["Complete", "Remaining"], [60, 40], colors=["blue", "default"],
|
|
277
|
+
remaining_color="gray", # Colors the remaining slice
|
|
278
|
+
show_values=False, show_percentages=True,
|
|
279
|
+
title="Task Completion: 60%")
|
|
280
|
+
plt.show()
|
|
281
|
+
```
|
|
282
|
+
|
|
283
|
+
**Key Features**:
|
|
284
|
+
|
|
285
|
+
- **Smart legend filtering**: Only shows the data value, hides "Remaining" entry by default
|
|
286
|
+
- **Remaining area options**:
|
|
287
|
+
- Without `remaining_color`: Remaining area stays as blank spaces
|
|
288
|
+
- With `remaining_color`: Remaining area gets colored and appears in legend
|
|
289
|
+
- **Perfect for dashboards**: Progress bars, completion meters, utilization rates
|
|
290
|
+
|
|
291
|
+
### Doughnut Charts
|
|
292
|
+
|
|
293
|
+
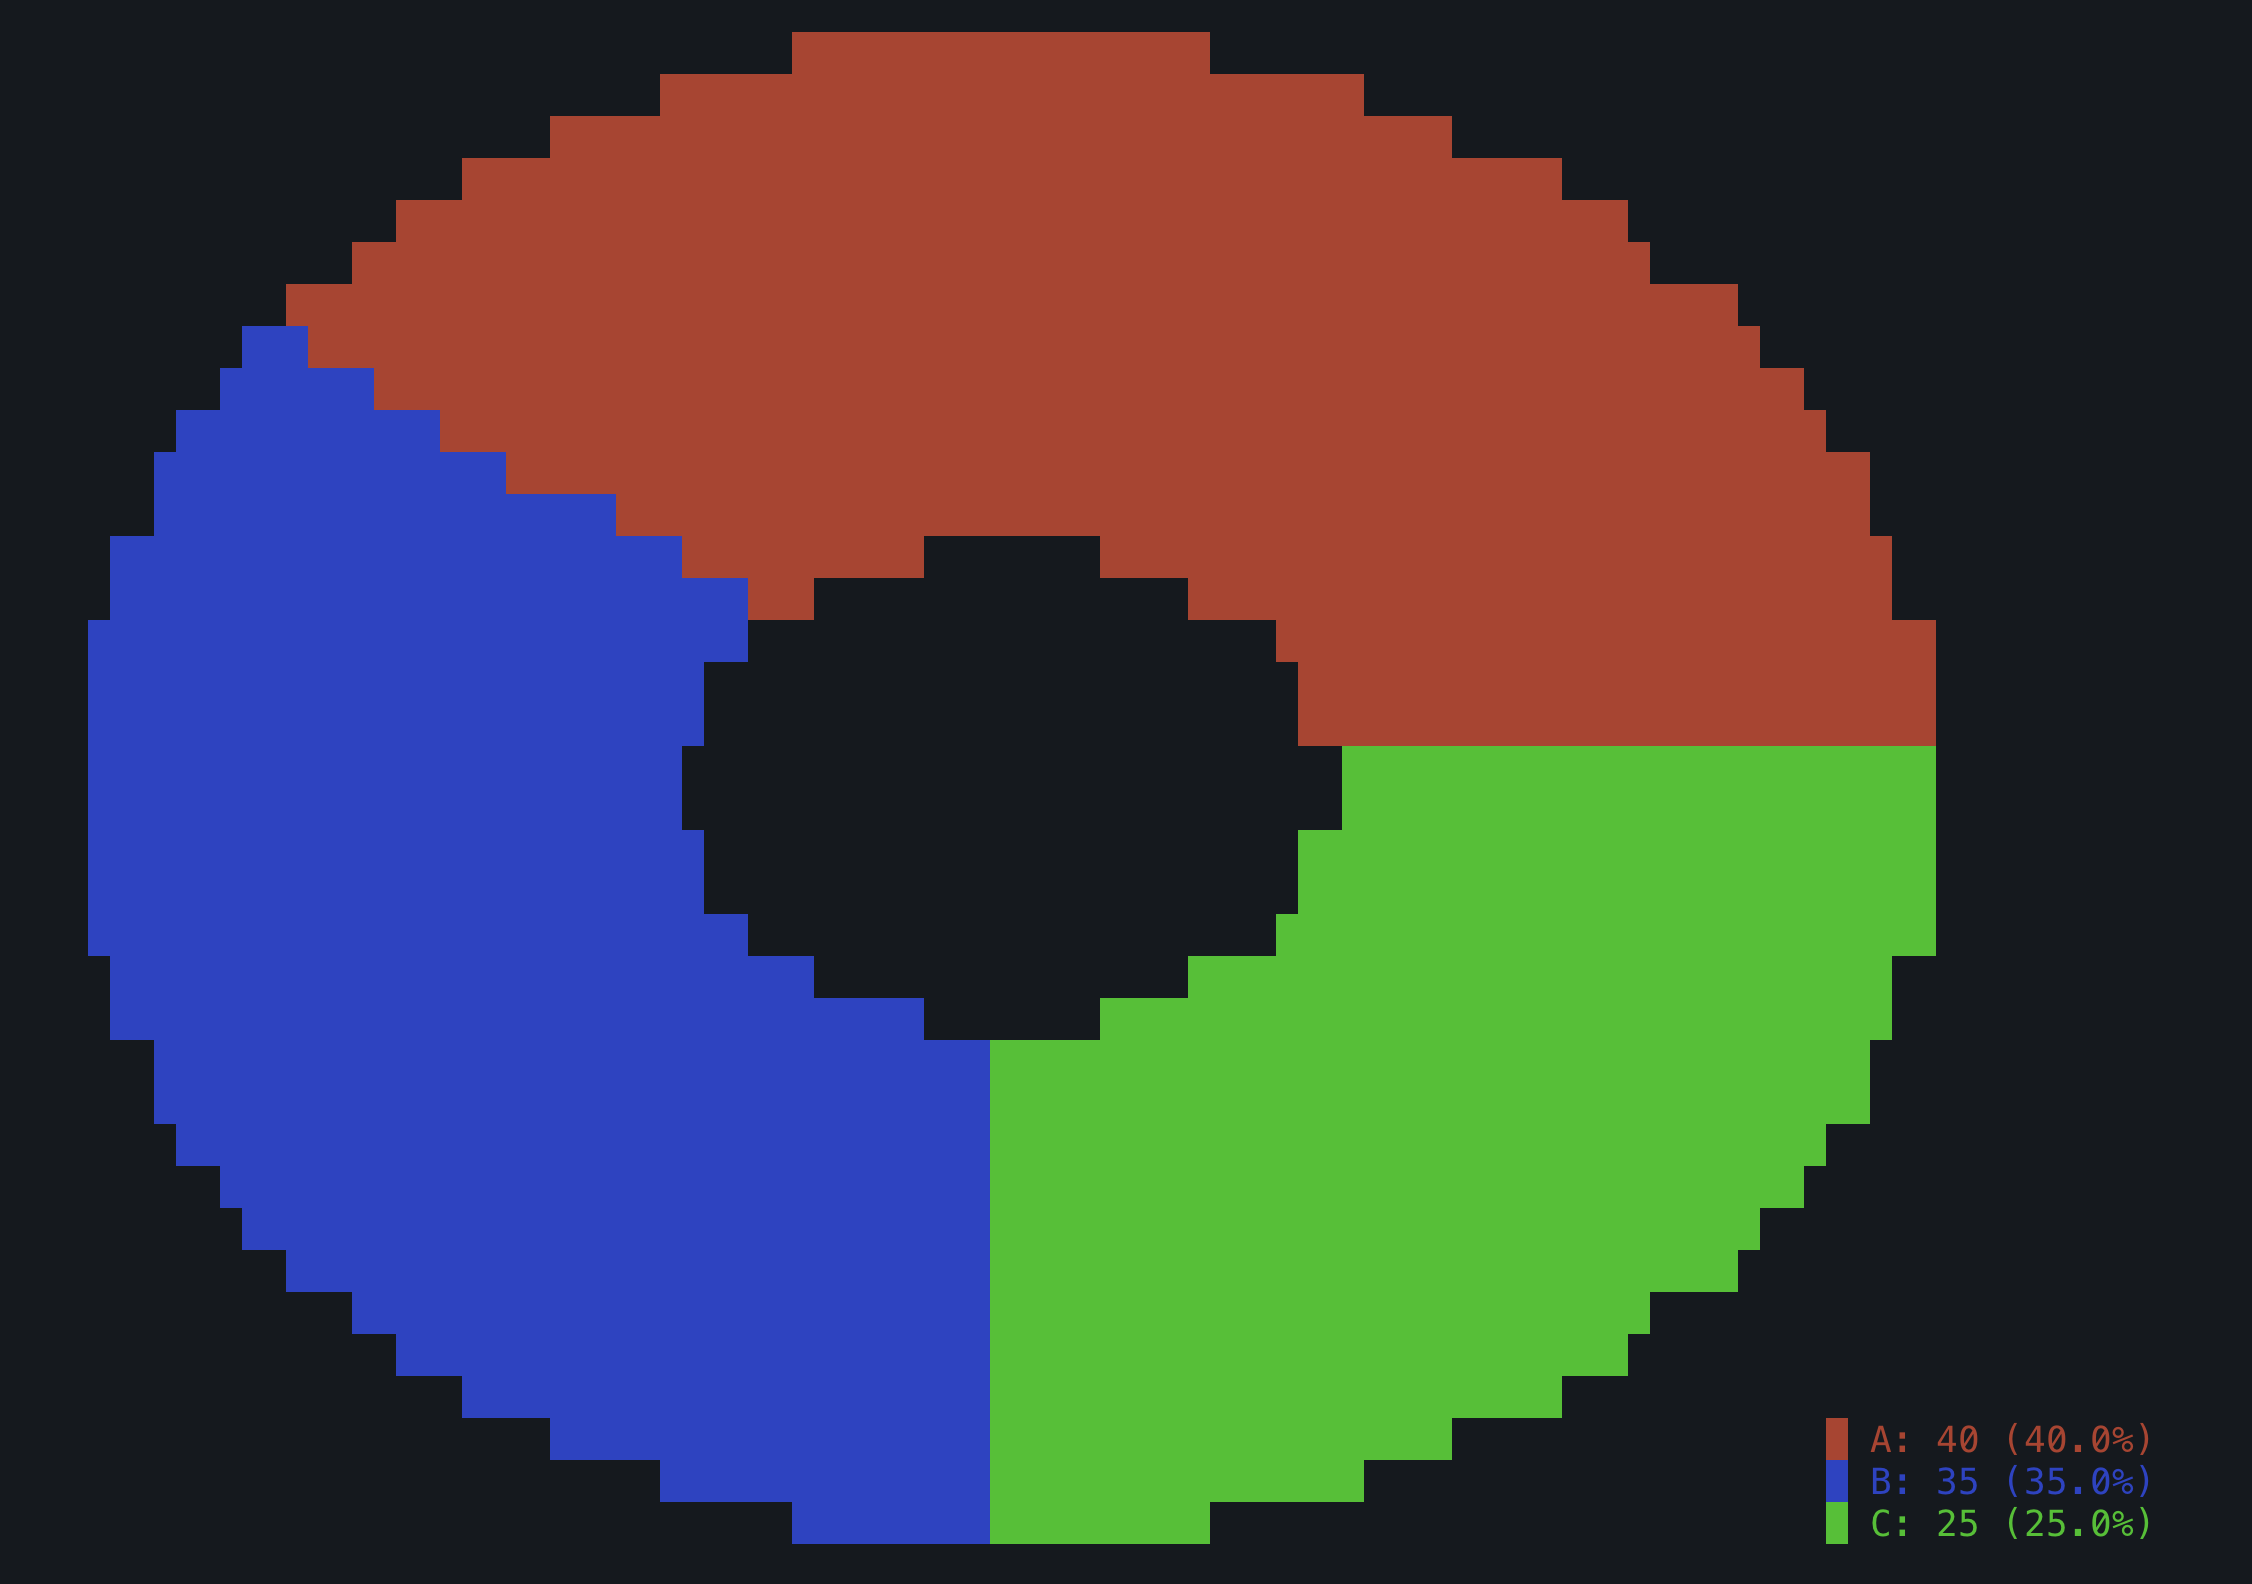
Doughnut charts are pie charts with a hollow center, providing a modern aesthetic and emphasizing the ring structure of the data. The inner radius is automatically set to 1/3 of the outer radius.
|
|
294
|
+
|
|
295
|
+
|
|
296
|
+
|
|
297
|
+
|
|
298
|
+
|
|
299
|
+
```python
|
|
300
|
+
import plotext_plus as plt
|
|
301
|
+
|
|
302
|
+
# Basic doughnut chart
|
|
303
|
+
labels = ["Sales", "Marketing", "Support", "Development"]
|
|
304
|
+
values = [40, 25, 15, 20]
|
|
305
|
+
colors = ["blue", "orange", "green", "red"]
|
|
306
|
+
|
|
307
|
+
plt.clear_figure()
|
|
308
|
+
plt.plotsize(60, 15)
|
|
309
|
+
plt.pie(labels, values, colors=colors, donut=True,
|
|
310
|
+
show_values=False, show_percentages=True,
|
|
311
|
+
title="Department Budget - Doughnut Chart")
|
|
312
|
+
plt.show()
|
|
313
|
+
|
|
314
|
+
# Single-value doughnut for progress indicator
|
|
315
|
+
plt.clear_figure()
|
|
316
|
+
plt.pie(["Completed", "Remaining"], [85, 15], colors=["cyan", "default"],
|
|
317
|
+
donut=True, show_values=False, show_percentages=True,
|
|
318
|
+
title="Project Progress - 85% Complete")
|
|
319
|
+
plt.show()
|
|
320
|
+
|
|
321
|
+
# Quick doughnut using convenience function
|
|
322
|
+
plt.quick_donut(["Task A", "Task B", "Task C"], [30, 45, 25],
|
|
323
|
+
colors=["purple", "yellow", "green"],
|
|
324
|
+
title="Task Distribution")
|
|
325
|
+
```
|
|
326
|
+
|
|
327
|
+
**Key Features**:
|
|
328
|
+
|
|
329
|
+
- **Hollow center**: Inner circle remains completely empty (no block characters)
|
|
330
|
+
- **Modern appearance**: Ring structure emphasizes proportional relationships
|
|
331
|
+
- **All pie chart features**: Supports single-value, remaining_color, legends, etc.
|
|
332
|
+
- **Convenience function**: `plt.quick_donut()` for rapid creation
|
|
333
|
+
- **Perfect for**: Progress indicators, resource allocation, modern dashboards
|
|
334
|
+
|
|
335
|
+
**Additional Parameters for Pie and Doughnut Charts**:
|
|
336
|
+
|
|
337
|
+
- `donut`: Set to `True` for doughnut chart (hollow center)
|
|
338
|
+
- `remaining_color`: Color for remaining slice in single-value charts (optional)
|
|
339
|
+
|
|
340
|
+
More documentation can be accessed with `doc.pie()`.
|
|
341
|
+
|
|
342
|
+
[Main Guide](https://github.com/ccmitchellusa/plotext_plus#guide), [Basic Plots](https://github.com/ccmitchellusa/plotext_plus/blob/master/docs/basic.md#basic-plots)
|
|
343
|
+
|
|
200
344
|
## Multiple Data Sets
|
|
201
345
|
|
|
202
346
|
Multiple data sets can be plotted using consecutive plotting functions. The `label` parameter, available in most plotting function, is used to add an entry in the **plot legend**, shown in the upper left corner of the plot canvas.
|
|
@@ -9,6 +9,7 @@
|
|
|
9
9
|
- [HeatmapChart](#heatmapchart)
|
|
10
10
|
- [MatrixChart](#matrixchart)
|
|
11
11
|
- [StemChart](#stemchart)
|
|
12
|
+
- [PieChart](#piechart)
|
|
12
13
|
- [Chart Class Methods](#chart-class-methods)
|
|
13
14
|
|
|
14
15
|
[Main Guide](https://github.com/ccmitchellusa/plotext_plus#guide)
|
|
@@ -362,6 +363,77 @@ chart.show()
|
|
|
362
363
|
|
|
363
364
|
[Main Guide](https://github.com/ccmitchellusa/plotext_plus#guide), [Chart Classes](https://github.com/ccmitchellusa/plotext_plus/blob/master/docs/chart_classes.md#chart-classes)
|
|
364
365
|
|
|
366
|
+
## PieChart
|
|
367
|
+
|
|
368
|
+
Specialized class for creating pie charts with segment visualization and legend support.
|
|
369
|
+
|
|
370
|
+
### Constructor
|
|
371
|
+
|
|
372
|
+
```python
|
|
373
|
+
PieChart(labels, values, colors=None, radius=None, show_values_on_slices=False, use_banners=False, banner_title=None)
|
|
374
|
+
```
|
|
375
|
+
|
|
376
|
+
### Enhanced Methods
|
|
377
|
+
|
|
378
|
+
- `show_values_on_slices(enabled=True)` - Display values directly on pie slices
|
|
379
|
+
- `set_radius(radius)` - Adjust the pie chart radius
|
|
380
|
+
|
|
381
|
+
### Usage Guidelines
|
|
382
|
+
|
|
383
|
+
⚠️ **Important**: Pie charts should only be used for a **small number of data values** (typically 3-7 categories) due to the limited resolution of terminal displays. Very small segments may not render clearly.
|
|
384
|
+
|
|
385
|
+
🖥️ **Best Practice**: Pie charts should be rendered using the **full terminal dimensions** whenever possible to maximize clarity and readability. Use functions like `ut.terminal_size()` to get optimal dimensions.
|
|
386
|
+
|
|
387
|
+
### Example
|
|
388
|
+
|
|
389
|
+
```python
|
|
390
|
+
import plotext_plus as plt
|
|
391
|
+
from plotext_plus import utilities as ut
|
|
392
|
+
|
|
393
|
+
# Get full terminal dimensions for optimal display
|
|
394
|
+
terminal_width, terminal_height = ut.terminal_size()
|
|
395
|
+
|
|
396
|
+
# Market share data (small number of categories)
|
|
397
|
+
companies = ["Apple", "Samsung", "Google", "Others"]
|
|
398
|
+
market_share = [35, 25, 15, 25]
|
|
399
|
+
colors = ["red", "blue", "green", "orange"]
|
|
400
|
+
|
|
401
|
+
# Create pie chart using full terminal size
|
|
402
|
+
chart = plt.PieChart(companies, market_share, colors=colors,
|
|
403
|
+
use_banners=True, banner_title="📊 Market Analysis")
|
|
404
|
+
|
|
405
|
+
# Set chart to use maximum terminal space
|
|
406
|
+
chart.size(terminal_width, terminal_height - 5)
|
|
407
|
+
|
|
408
|
+
chart.title("Smartphone Market Share Q3 2024")
|
|
409
|
+
chart.show()
|
|
410
|
+
|
|
411
|
+
# Example with values on slices
|
|
412
|
+
chart2 = plt.PieChart(companies, market_share, colors=colors,
|
|
413
|
+
show_values_on_slices=True,
|
|
414
|
+
use_banners=True, banner_title="📊 Detailed View")
|
|
415
|
+
chart2.size(terminal_width, terminal_height - 5)
|
|
416
|
+
chart2.title("Market Share with Values on Slices")
|
|
417
|
+
chart2.show()
|
|
418
|
+
```
|
|
419
|
+
|
|
420
|
+
### Features
|
|
421
|
+
|
|
422
|
+
- **Colored legend**: Each legend entry is prefixed with a colored block (█) matching its pie segment
|
|
423
|
+
- **Aspect ratio correction**: Pie charts automatically adjust for terminal character dimensions to appear circular
|
|
424
|
+
- **Gap-free rendering**: Uses advanced sampling algorithms to minimize visual gaps between segments
|
|
425
|
+
- **Full terminal support**: Optimized to use the entire terminal space for maximum clarity
|
|
426
|
+
|
|
427
|
+
### Tips for Effective Pie Charts
|
|
428
|
+
|
|
429
|
+
1. **Limit categories**: Use no more than 5-7 categories for best readability
|
|
430
|
+
2. **Combine small values**: Group small segments into an "Others" category
|
|
431
|
+
3. **Use full screen**: Always render at maximum terminal dimensions
|
|
432
|
+
4. **Choose distinct colors**: Use colors that are easily distinguishable in terminal displays
|
|
433
|
+
5. **Consider alternatives**: For many categories or precise comparisons, consider bar charts instead
|
|
434
|
+
|
|
435
|
+
[Main Guide](https://github.com/ccmitchellusa/plotext_plus#guide), [Chart Classes](https://github.com/ccmitchellusa/plotext_plus/blob/master/docs/chart_classes.md#chart-classes)
|
|
436
|
+
|
|
365
437
|
## Chart Class Methods
|
|
366
438
|
|
|
367
439
|
All chart classes inherit these methods from the base `Chart` class:
|
|
@@ -36,7 +36,7 @@ plx.from_matplotlib(fig)
|
|
|
36
36
|
plx.show()
|
|
37
37
|
```
|
|
38
38
|
|
|
39
|
-

|
|
40
40
|
|
|
41
41
|
These feature is under development: please report any bug or development idea.
|
|
42
42
|
|
|
@@ -131,7 +131,7 @@ Integration with the package `tkinter`, where a test image is downloaded in the
|
|
|
131
131
|
```python
|
|
132
132
|
import tkinter as tk
|
|
133
133
|
import plotext_plus as plt
|
|
134
|
-
from
|
|
134
|
+
from plotext_plus._utility import to_rgb, uncolorize
|
|
135
135
|
import tkinter.font as tkfont
|
|
136
136
|
|
|
137
137
|
image_path = 'cat.jpg'
|
|
@@ -23,7 +23,7 @@ To plot an image use the `image_plot(path)` function.
|
|
|
23
23
|
|
|
24
24
|
- To save the result **in colors**, as an `html` page, use the function `plt.savefig()`, described [here](https://github.com/ccmitchellusa/plotext_plus/blob/master/docs/utilities.md#useful-functions).
|
|
25
25
|
|
|
26
|
-
In this example, a [test image](https://raw.githubusercontent.com/ccmitchellusa/
|
|
26
|
+
In this example, a [test image](https://raw.githubusercontent.com/ccmitchellusa/plotext_plus/refs/heads/main/data/hist.png) is downloaded in the home folder, visualized and finally removed:
|
|
27
27
|
|
|
28
28
|
```python
|
|
29
29
|
import plotext_plus as plt
|
|
@@ -41,7 +41,7 @@ or directly on terminal:
|
|
|
41
41
|
python3 -c "import plotext_plus as plt; path = 'cat.jpg'; plt.download(plt.test_image_url, path); plt.image_plot(path); plt.title('A very Cute Cat'); plt.show(); plt.delete_file(path)"
|
|
42
42
|
```
|
|
43
43
|
|
|
44
|
-

|
|
45
45
|
|
|
46
46
|
More documentation can be accessed with `doc.image_plot()`.
|
|
47
47
|
|
|
@@ -85,7 +85,9 @@ Available tools:
|
|
|
85
85
|
- line_plot: Create line plots
|
|
86
86
|
- bar_chart: Create bar charts
|
|
87
87
|
- matrix_plot: Create matrix/heatmap plots
|
|
88
|
-
-
|
|
88
|
+
- image_plot: Display images as ASCII art
|
|
89
|
+
- play_gif: Play animated GIFs
|
|
90
|
+
- quick_scatter/line/bar/pie: Quick chart creation
|
|
89
91
|
- theme management tools
|
|
90
92
|
- utility functions
|
|
91
93
|
|
|
@@ -147,6 +149,29 @@ async def matrix_plot(
|
|
|
147
149
|
|
|
148
150
|
Creates a matrix/heatmap plot from 2D data.
|
|
149
151
|
|
|
152
|
+
#### image_plot
|
|
153
|
+
|
|
154
|
+
```python
|
|
155
|
+
async def image_plot(
|
|
156
|
+
image_path: str,
|
|
157
|
+
title: Optional[str] = None,
|
|
158
|
+
marker: Optional[str] = None,
|
|
159
|
+
style: Optional[str] = None,
|
|
160
|
+
fast: bool = False,
|
|
161
|
+
grayscale: bool = False
|
|
162
|
+
) -> str
|
|
163
|
+
```
|
|
164
|
+
|
|
165
|
+
Display an image in the terminal using ASCII art. Supports various image formats and styling options.
|
|
166
|
+
|
|
167
|
+
#### play_gif
|
|
168
|
+
|
|
169
|
+
```python
|
|
170
|
+
async def play_gif(gif_path: str) -> str
|
|
171
|
+
```
|
|
172
|
+
|
|
173
|
+
Play a GIF animation in the terminal. The animation runs automatically without requiring additional show() calls.
|
|
174
|
+
|
|
150
175
|
### Chart Class Tools
|
|
151
176
|
|
|
152
177
|
#### quick_scatter
|
|
@@ -188,6 +213,22 @@ async def quick_bar(
|
|
|
188
213
|
|
|
189
214
|
Creates a quick bar chart using the chart classes API.
|
|
190
215
|
|
|
216
|
+
#### quick_pie
|
|
217
|
+
|
|
218
|
+
```python
|
|
219
|
+
async def quick_pie(
|
|
220
|
+
labels: List[str],
|
|
221
|
+
values: List[Union[int, float]],
|
|
222
|
+
colors: Optional[List[str]] = None,
|
|
223
|
+
title: Optional[str] = None,
|
|
224
|
+
show_values: bool = True,
|
|
225
|
+
show_percentages: bool = True,
|
|
226
|
+
show_values_on_slices: bool = False
|
|
227
|
+
) -> str
|
|
228
|
+
```
|
|
229
|
+
|
|
230
|
+
Creates a quick pie chart using the chart classes API. Best for small numbers of categories (3-7).
|
|
231
|
+
|
|
191
232
|
### Theme Tools
|
|
192
233
|
|
|
193
234
|
#### get_available_themes
|
|
@@ -277,12 +318,20 @@ The plotext_plus MCP server provides ready-to-use prompts via the MCP prompt API
|
|
|
277
318
|
- **basic_scatter**: Simple scatter plot example
|
|
278
319
|
- **basic_bar_chart**: Bar chart with sample data
|
|
279
320
|
- **line_plot_with_theme**: Line plot with theme application
|
|
321
|
+
- **basic_pie_chart**: Simple pie chart example with market share data
|
|
280
322
|
|
|
281
323
|
#### Advanced Plotting Prompts
|
|
282
324
|
|
|
283
325
|
- **matrix_heatmap**: Correlation matrix visualization
|
|
284
326
|
- **multi_step_workflow**: Complex multi-step analysis workflow
|
|
285
327
|
- **professional_bar_chart**: Styled bar chart with banner mode
|
|
328
|
+
- **pie_chart_styling**: Advanced pie chart with values on slices
|
|
329
|
+
- **pie_chart_comparison**: Multiple pie charts for quarterly comparison
|
|
330
|
+
- **pie_chart_best_practices**: Educational example for data grouping
|
|
331
|
+
- **image_display**: Basic image plotting workflow
|
|
332
|
+
- **gif_animation**: GIF playback example
|
|
333
|
+
- **image_styling**: Advanced image rendering with custom markers
|
|
334
|
+
- **multimedia_showcase**: Complete multimedia demonstration
|
|
286
335
|
|
|
287
336
|
#### Theme and Styling Prompts
|
|
288
337
|
|
|
@@ -320,6 +369,39 @@ The server provides a configuration resource at `config://plotext` containing:
|
|
|
320
369
|
}
|
|
321
370
|
```
|
|
322
371
|
|
|
372
|
+
### info://plotext
|
|
373
|
+
|
|
374
|
+
The server also provides comprehensive tool information at `info://plotext` containing:
|
|
375
|
+
|
|
376
|
+
```python
|
|
377
|
+
{
|
|
378
|
+
"server_info": {
|
|
379
|
+
"name": "Plotext Plus MCP Server",
|
|
380
|
+
"description": "Model Context Protocol server for plotext_plus terminal plotting library",
|
|
381
|
+
"version": "1.0.0",
|
|
382
|
+
"capabilities": ["plotting", "theming", "multimedia", "charts"]
|
|
383
|
+
},
|
|
384
|
+
"plotting_tools": {
|
|
385
|
+
"scatter_plot": "Create scatter plots with x/y data points",
|
|
386
|
+
"line_plot": "Create line plots for time series and continuous data",
|
|
387
|
+
"bar_chart": "Create bar charts for categorical data",
|
|
388
|
+
"matrix_plot": "Create heatmaps from 2D matrix data",
|
|
389
|
+
"image_plot": "Display images in terminal using ASCII art",
|
|
390
|
+
"play_gif": "Play animated GIFs in the terminal"
|
|
391
|
+
},
|
|
392
|
+
"quick_chart_tools": {
|
|
393
|
+
"quick_scatter": "Quickly create scatter charts with theming",
|
|
394
|
+
"quick_line": "Quickly create line charts with theming",
|
|
395
|
+
"quick_bar": "Quickly create bar charts with theming",
|
|
396
|
+
"quick_pie": "Quickly create pie charts with custom colors and options"
|
|
397
|
+
},
|
|
398
|
+
"usage_tips": {
|
|
399
|
+
"pie_charts": "Best for 3-7 categories, use full terminal dimensions",
|
|
400
|
+
"images": "Use fast=True for better performance with large images"
|
|
401
|
+
}
|
|
402
|
+
}
|
|
403
|
+
```
|
|
404
|
+
|
|
323
405
|
## Implementation Details
|
|
324
406
|
|
|
325
407
|
### Architecture
|
|
@@ -836,6 +918,12 @@ Make a bar chart showing sales data: categories=["Q1","Q2","Q3","Q4"] and values
|
|
|
836
918
|
Plot a line chart of temperature data over time: x=[1,2,3,4,5,6,7] and y=[20,22,25,28,26,24,21] using the "dark" theme with title "Weekly Temperature".
|
|
837
919
|
```
|
|
838
920
|
|
|
921
|
+
**Create a Simple Pie Chart**
|
|
922
|
+
|
|
923
|
+
```text
|
|
924
|
+
Create a pie chart showing mobile OS market share: categories=['iOS', 'Android', 'Windows', 'Other'], values=[35, 45, 15, 5], colors=['blue', 'green', 'orange', 'gray'] with title 'Mobile OS Market Share'.
|
|
925
|
+
```
|
|
926
|
+
|
|
839
927
|
### Advanced Plotting Examples
|
|
840
928
|
|
|
841
929
|
**Matrix Heatmap Visualization**
|
|
@@ -864,6 +952,32 @@ Create a professional-looking bar chart with:
|
|
|
864
952
|
- Set appropriate plot dimensions
|
|
865
953
|
```
|
|
866
954
|
|
|
955
|
+
**Pie Chart with Advanced Features**
|
|
956
|
+
|
|
957
|
+
```text
|
|
958
|
+
Create a budget pie chart with show_values_on_slices=True: categories=['Housing', 'Food', 'Transport', 'Entertainment'], values=[1200, 400, 300, 200], custom colors, and title 'Monthly Budget Breakdown'.
|
|
959
|
+
```
|
|
960
|
+
|
|
961
|
+
**Display Image as ASCII Art**
|
|
962
|
+
|
|
963
|
+
```text
|
|
964
|
+
Display an image in the terminal:
|
|
965
|
+
1. Download a test image using utilities.download()
|
|
966
|
+
2. Display it using image_plot with title 'ASCII Art Demo'
|
|
967
|
+
3. Try both normal and grayscale versions
|
|
968
|
+
4. Clean up the file afterward
|
|
969
|
+
```
|
|
970
|
+
|
|
971
|
+
**Play Animated GIF**
|
|
972
|
+
|
|
973
|
+
```text
|
|
974
|
+
Play a GIF animation in terminal:
|
|
975
|
+
1. Download a test GIF file
|
|
976
|
+
2. Play the animation using play_gif
|
|
977
|
+
3. Clean up the file afterward
|
|
978
|
+
Note: The GIF will play automatically
|
|
979
|
+
```
|
|
980
|
+
|
|
867
981
|
### Theme and Styling Examples
|
|
868
982
|
|
|
869
983
|
**Theme Exploration**
|