pandas-plots 0.9.6__tar.gz
This diff represents the content of publicly available package versions that have been released to one of the supported registries. The information contained in this diff is provided for informational purposes only and reflects changes between package versions as they appear in their respective public registries.
- pandas-plots-0.9.6/LICENSE +7 -0
- pandas-plots-0.9.6/PKG-INFO +154 -0
- pandas-plots-0.9.6/README.md +125 -0
- pandas-plots-0.9.6/pyproject.toml +42 -0
- pandas-plots-0.9.6/setup.cfg +39 -0
- pandas-plots-0.9.6/src/pandas_plots/hlp.py +204 -0
- pandas-plots-0.9.6/src/pandas_plots/pls.py +870 -0
- pandas-plots-0.9.6/src/pandas_plots/tbl.py +595 -0
- pandas-plots-0.9.6/src/pandas_plots/ven.py +347 -0
- pandas-plots-0.9.6/src/pandas_plots.egg-info/PKG-INFO +154 -0
- pandas-plots-0.9.6/src/pandas_plots.egg-info/SOURCES.txt +13 -0
- pandas-plots-0.9.6/src/pandas_plots.egg-info/dependency_links.txt +1 -0
- pandas-plots-0.9.6/src/pandas_plots.egg-info/requires.txt +7 -0
- pandas-plots-0.9.6/src/pandas_plots.egg-info/top_level.txt +1 -0
|
@@ -0,0 +1,7 @@
|
|
|
1
|
+
Copyright 2024 smeisegeier
|
|
2
|
+
|
|
3
|
+
Permission is hereby granted, free of charge, to any person obtaining a copy of this software and associated documentation files (the "Software"), to deal in the Software without restriction, including without limitation the rights to use, copy, modify, merge, publish, distribute, sublicense, and/or sell copies of the Software, and to permit persons to whom the Software is furnished to do so, subject to the following conditions:
|
|
4
|
+
|
|
5
|
+
The above copyright notice and this permission notice shall be included in all copies or substantial portions of the Software.
|
|
6
|
+
|
|
7
|
+
THE SOFTWARE IS PROVIDED "AS IS", WITHOUT WARRANTY OF ANY KIND, EXPRESS OR IMPLIED, INCLUDING BUT NOT LIMITED TO THE WARRANTIES OF MERCHANTABILITY, FITNESS FOR A PARTICULAR PURPOSE AND NONINFRINGEMENT. IN NO EVENT SHALL THE AUTHORS OR COPYRIGHT HOLDERS BE LIABLE FOR ANY CLAIM, DAMAGES OR OTHER LIABILITY, WHETHER IN AN ACTION OF CONTRACT, TORT OR OTHERWISE, ARISING FROM, OUT OF OR IN CONNECTION WITH THE SOFTWARE OR THE USE OR OTHER DEALINGS IN THE SOFTWARE.
|
|
@@ -0,0 +1,154 @@
|
|
|
1
|
+
Metadata-Version: 2.1
|
|
2
|
+
Name: pandas-plots
|
|
3
|
+
Version: 0.9.6
|
|
4
|
+
Summary: A collection of helper for table handling and vizualization
|
|
5
|
+
Home-page: https://github.com/smeisegeier/pandas-plots
|
|
6
|
+
Author: smeisegeier
|
|
7
|
+
Author-email: dexterDSDo@googlemail.com
|
|
8
|
+
License: MIT License
|
|
9
|
+
Project-URL: Documentation, https://github.com/smeisegeier/pandas-plots
|
|
10
|
+
Project-URL: Source Code, https://github.com/smeisegeier/pandas-plots
|
|
11
|
+
Project-URL: Bug Tracker, https://github.com/smeisegeier/pandas-plots/issues
|
|
12
|
+
Classifier: License :: OSI Approved :: MIT License
|
|
13
|
+
Classifier: Programming Language :: Python :: 3
|
|
14
|
+
Classifier: Programming Language :: Python :: 3.10
|
|
15
|
+
Classifier: Development Status :: 4 - Beta
|
|
16
|
+
Classifier: Intended Audience :: Science/Research
|
|
17
|
+
Classifier: Operating System :: OS Independent
|
|
18
|
+
Classifier: Topic :: Scientific/Engineering
|
|
19
|
+
Requires-Python: >=3.10
|
|
20
|
+
Description-Content-Type: text/markdown
|
|
21
|
+
License-File: LICENSE
|
|
22
|
+
Requires-Dist: pandas>=2.0.0
|
|
23
|
+
Requires-Dist: plotly>=5.18.0
|
|
24
|
+
Requires-Dist: matplotlib>=3.8.2
|
|
25
|
+
Requires-Dist: matplotlib-venn>=0.11.10
|
|
26
|
+
Requires-Dist: seaborn>=0.13.2
|
|
27
|
+
Requires-Dist: Jinja2>=3.1.3
|
|
28
|
+
Requires-Dist: requests>=2.31.0
|
|
29
|
+
|
|
30
|
+
# pandas-plots
|
|
31
|
+
|
|
32
|
+
   
|
|
33
|
+
|
|
34
|
+
## usage
|
|
35
|
+
|
|
36
|
+
install / update package
|
|
37
|
+
|
|
38
|
+
```bash
|
|
39
|
+
pip install pandas-plots -U
|
|
40
|
+
```
|
|
41
|
+
|
|
42
|
+
include in python
|
|
43
|
+
|
|
44
|
+
```python
|
|
45
|
+
from pandas_plots import tbl, pls, ven, hlp
|
|
46
|
+
```
|
|
47
|
+
|
|
48
|
+
## example
|
|
49
|
+
|
|
50
|
+
```python
|
|
51
|
+
# load sample dataset from seaborn
|
|
52
|
+
import seaborn as sb
|
|
53
|
+
df = sb.load_dataset('taxis')
|
|
54
|
+
```
|
|
55
|
+
|
|
56
|
+
```python
|
|
57
|
+
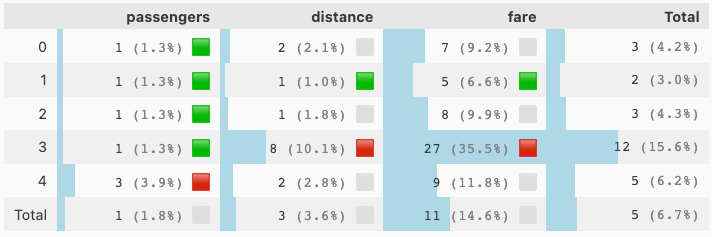
_df = df[["passengers", "distance", "fare"]][:5]
|
|
58
|
+
tbl.show_num_df(
|
|
59
|
+
_df,
|
|
60
|
+
total_axis="xy",
|
|
61
|
+
total_mode="mean",
|
|
62
|
+
data_bar_axis="xy",
|
|
63
|
+
pct_axis="xy",
|
|
64
|
+
precision=0,
|
|
65
|
+
kpi_mode="max_min_x",
|
|
66
|
+
kpi_rag_list=(1,7),
|
|
67
|
+
)
|
|
68
|
+
```
|
|
69
|
+
|
|
70
|
+
|
|
71
|
+
|
|
72
|
+
## why use pandas-plots
|
|
73
|
+
|
|
74
|
+
`pandas-plots` is a package to help you examine and visualize data that are organized in a pandas DataFrame. It provides a high level api to pandas / plotly with some selected functions.
|
|
75
|
+
|
|
76
|
+
It is subdivided into:
|
|
77
|
+
|
|
78
|
+
- `tbl` utilities for table descriptions
|
|
79
|
+
- 🌟`show_num_df()` displays a table as styled version with additional information
|
|
80
|
+
- `describe_df()` an alternative version of pandas `describe()` function
|
|
81
|
+
- `pivot_df()` gets a pivot table of a 3 column dataframe
|
|
82
|
+
- _⚠️ `pivot_df()` is depricated and wont get further updates. Its features are well covered in standard `pd.pivot_table()`_
|
|
83
|
+
|
|
84
|
+
- `pls` for plotly visualizations
|
|
85
|
+
- `plot_box()` auto annotated boxplot w/ violin option
|
|
86
|
+
- `plot_boxes()` multiple boxplots _(annotation is experimental)_
|
|
87
|
+
- `plots_bars()` a standardized bar plot
|
|
88
|
+
- 🆕 now features convidence intervals via `use_ci` option
|
|
89
|
+
- `plot_stacked_bars()` shortcut to stacked bars 😄
|
|
90
|
+
- `plot_quadrants()` quickly shows a 2x2 heatmap
|
|
91
|
+
|
|
92
|
+
- `ven` offers functions for _venn diagrams_
|
|
93
|
+
- `show_venn2()` displays a venn diagram for 2 sets
|
|
94
|
+
- `show_venn3()` displays a venn diagram for 3 sets
|
|
95
|
+
|
|
96
|
+
- `hlp` contains some (variety) helper functions
|
|
97
|
+
- `df_to_series()` converts a dataframe to a series
|
|
98
|
+
- `mean_confidence_interval()` calculates mean and confidence interval for a series
|
|
99
|
+
- `wrap_text()` formats strings or lists to a given width to fit nicely on the screen
|
|
100
|
+
- `replace_delimiter_outside_quotes()` when manual import of csv files is needed: replaces delimiters only outside of quotes
|
|
101
|
+
|
|
102
|
+
> note: theme setting can be controlled through all functions by setting the environment variable `THEME` to either light or dark
|
|
103
|
+
|
|
104
|
+
## more examples
|
|
105
|
+
|
|
106
|
+
```python
|
|
107
|
+
pls.plot_box(df['fare'], height=400, violin=True)
|
|
108
|
+
```
|
|
109
|
+
|
|
110
|
+

|
|
111
|
+
|
|
112
|
+
```python
|
|
113
|
+
# quick and exhaustive description of any table
|
|
114
|
+
tbl.describe_df(df, 'taxis', top_n_uniques=5)
|
|
115
|
+
```
|
|
116
|
+
|
|
117
|
+

|
|
118
|
+
|
|
119
|
+
```python
|
|
120
|
+
# show bars with confidence intervals
|
|
121
|
+
_df = df[["payment", "fare"]]
|
|
122
|
+
pls.plot_bars(
|
|
123
|
+
_df,
|
|
124
|
+
dropna=False,
|
|
125
|
+
use_ci=True,
|
|
126
|
+
height=600,
|
|
127
|
+
width=800,
|
|
128
|
+
precision=1,
|
|
129
|
+
)
|
|
130
|
+
```
|
|
131
|
+
|
|
132
|
+

|
|
133
|
+
|
|
134
|
+
```python
|
|
135
|
+
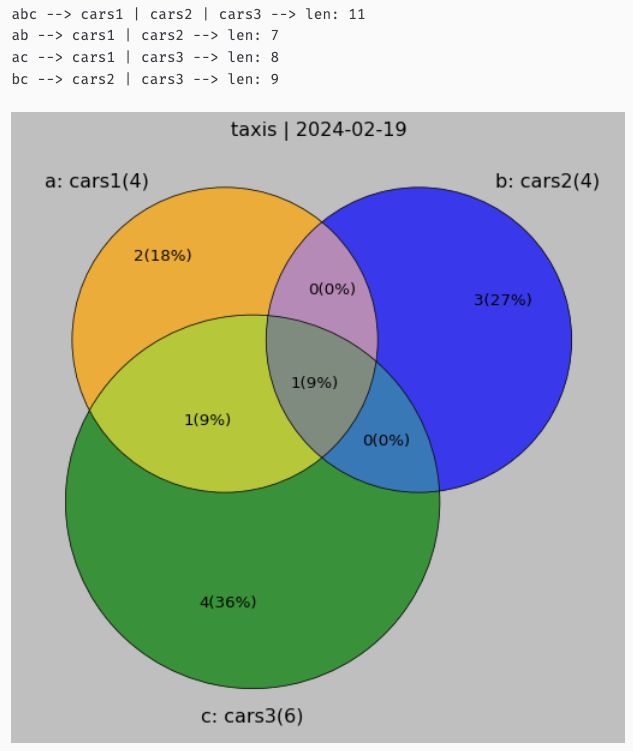
# show venn diagram for 3 sets
|
|
136
|
+
from pandas_plots import ven
|
|
137
|
+
|
|
138
|
+
set_a = {'ford','ferrari','mercedes', 'bmw'}
|
|
139
|
+
set_b = {'opel','bmw','bentley','audi'}
|
|
140
|
+
set_c = {'ferrari','bmw','chrysler','renault','peugeot','fiat'}
|
|
141
|
+
_df, _details = ven.show_venn3(
|
|
142
|
+
title="taxis",
|
|
143
|
+
a_set=set_a,
|
|
144
|
+
a_label="cars1",
|
|
145
|
+
b_set=set_b,
|
|
146
|
+
b_label="cars2",
|
|
147
|
+
c_set=set_c,
|
|
148
|
+
c_label="cars3",
|
|
149
|
+
verbose=0,
|
|
150
|
+
size=8,
|
|
151
|
+
)
|
|
152
|
+
```
|
|
153
|
+
|
|
154
|
+
|
|
@@ -0,0 +1,125 @@
|
|
|
1
|
+
# pandas-plots
|
|
2
|
+
|
|
3
|
+
   
|
|
4
|
+
|
|
5
|
+
## usage
|
|
6
|
+
|
|
7
|
+
install / update package
|
|
8
|
+
|
|
9
|
+
```bash
|
|
10
|
+
pip install pandas-plots -U
|
|
11
|
+
```
|
|
12
|
+
|
|
13
|
+
include in python
|
|
14
|
+
|
|
15
|
+
```python
|
|
16
|
+
from pandas_plots import tbl, pls, ven, hlp
|
|
17
|
+
```
|
|
18
|
+
|
|
19
|
+
## example
|
|
20
|
+
|
|
21
|
+
```python
|
|
22
|
+
# load sample dataset from seaborn
|
|
23
|
+
import seaborn as sb
|
|
24
|
+
df = sb.load_dataset('taxis')
|
|
25
|
+
```
|
|
26
|
+
|
|
27
|
+
```python
|
|
28
|
+
_df = df[["passengers", "distance", "fare"]][:5]
|
|
29
|
+
tbl.show_num_df(
|
|
30
|
+
_df,
|
|
31
|
+
total_axis="xy",
|
|
32
|
+
total_mode="mean",
|
|
33
|
+
data_bar_axis="xy",
|
|
34
|
+
pct_axis="xy",
|
|
35
|
+
precision=0,
|
|
36
|
+
kpi_mode="max_min_x",
|
|
37
|
+
kpi_rag_list=(1,7),
|
|
38
|
+
)
|
|
39
|
+
```
|
|
40
|
+
|
|
41
|
+

|
|
42
|
+
|
|
43
|
+
## why use pandas-plots
|
|
44
|
+
|
|
45
|
+
`pandas-plots` is a package to help you examine and visualize data that are organized in a pandas DataFrame. It provides a high level api to pandas / plotly with some selected functions.
|
|
46
|
+
|
|
47
|
+
It is subdivided into:
|
|
48
|
+
|
|
49
|
+
- `tbl` utilities for table descriptions
|
|
50
|
+
- 🌟`show_num_df()` displays a table as styled version with additional information
|
|
51
|
+
- `describe_df()` an alternative version of pandas `describe()` function
|
|
52
|
+
- `pivot_df()` gets a pivot table of a 3 column dataframe
|
|
53
|
+
- _⚠️ `pivot_df()` is depricated and wont get further updates. Its features are well covered in standard `pd.pivot_table()`_
|
|
54
|
+
|
|
55
|
+
- `pls` for plotly visualizations
|
|
56
|
+
- `plot_box()` auto annotated boxplot w/ violin option
|
|
57
|
+
- `plot_boxes()` multiple boxplots _(annotation is experimental)_
|
|
58
|
+
- `plots_bars()` a standardized bar plot
|
|
59
|
+
- 🆕 now features convidence intervals via `use_ci` option
|
|
60
|
+
- `plot_stacked_bars()` shortcut to stacked bars 😄
|
|
61
|
+
- `plot_quadrants()` quickly shows a 2x2 heatmap
|
|
62
|
+
|
|
63
|
+
- `ven` offers functions for _venn diagrams_
|
|
64
|
+
- `show_venn2()` displays a venn diagram for 2 sets
|
|
65
|
+
- `show_venn3()` displays a venn diagram for 3 sets
|
|
66
|
+
|
|
67
|
+
- `hlp` contains some (variety) helper functions
|
|
68
|
+
- `df_to_series()` converts a dataframe to a series
|
|
69
|
+
- `mean_confidence_interval()` calculates mean and confidence interval for a series
|
|
70
|
+
- `wrap_text()` formats strings or lists to a given width to fit nicely on the screen
|
|
71
|
+
- `replace_delimiter_outside_quotes()` when manual import of csv files is needed: replaces delimiters only outside of quotes
|
|
72
|
+
|
|
73
|
+
> note: theme setting can be controlled through all functions by setting the environment variable `THEME` to either light or dark
|
|
74
|
+
|
|
75
|
+
## more examples
|
|
76
|
+
|
|
77
|
+
```python
|
|
78
|
+
pls.plot_box(df['fare'], height=400, violin=True)
|
|
79
|
+
```
|
|
80
|
+
|
|
81
|
+

|
|
82
|
+
|
|
83
|
+
```python
|
|
84
|
+
# quick and exhaustive description of any table
|
|
85
|
+
tbl.describe_df(df, 'taxis', top_n_uniques=5)
|
|
86
|
+
```
|
|
87
|
+
|
|
88
|
+

|
|
89
|
+
|
|
90
|
+
```python
|
|
91
|
+
# show bars with confidence intervals
|
|
92
|
+
_df = df[["payment", "fare"]]
|
|
93
|
+
pls.plot_bars(
|
|
94
|
+
_df,
|
|
95
|
+
dropna=False,
|
|
96
|
+
use_ci=True,
|
|
97
|
+
height=600,
|
|
98
|
+
width=800,
|
|
99
|
+
precision=1,
|
|
100
|
+
)
|
|
101
|
+
```
|
|
102
|
+
|
|
103
|
+

|
|
104
|
+
|
|
105
|
+
```python
|
|
106
|
+
# show venn diagram for 3 sets
|
|
107
|
+
from pandas_plots import ven
|
|
108
|
+
|
|
109
|
+
set_a = {'ford','ferrari','mercedes', 'bmw'}
|
|
110
|
+
set_b = {'opel','bmw','bentley','audi'}
|
|
111
|
+
set_c = {'ferrari','bmw','chrysler','renault','peugeot','fiat'}
|
|
112
|
+
_df, _details = ven.show_venn3(
|
|
113
|
+
title="taxis",
|
|
114
|
+
a_set=set_a,
|
|
115
|
+
a_label="cars1",
|
|
116
|
+
b_set=set_b,
|
|
117
|
+
b_label="cars2",
|
|
118
|
+
c_set=set_c,
|
|
119
|
+
c_label="cars3",
|
|
120
|
+
verbose=0,
|
|
121
|
+
size=8,
|
|
122
|
+
)
|
|
123
|
+
```
|
|
124
|
+
|
|
125
|
+

|
|
@@ -0,0 +1,42 @@
|
|
|
1
|
+
[build-system]
|
|
2
|
+
requires = ["setuptools"]
|
|
3
|
+
build-backend = "setuptools.build_meta"
|
|
4
|
+
|
|
5
|
+
# [project]
|
|
6
|
+
# name = "pandas-plots"
|
|
7
|
+
# version = "0.8.2"
|
|
8
|
+
# requires-python = ">=3.10"
|
|
9
|
+
# description = "A collection of helper for table handling and vizualization"
|
|
10
|
+
# readme = "README.md"
|
|
11
|
+
# authors = [{ name = "smeisegeier", email = "dexterDSDo@googlemail.com" }]
|
|
12
|
+
# license = { text = "MIT licence" }
|
|
13
|
+
# # license = { file = "LICENSE" }
|
|
14
|
+
# classifiers = [
|
|
15
|
+
# "License :: OSI Approved :: MIT License",
|
|
16
|
+
# "Programming Language :: Python :: 3",
|
|
17
|
+
# "Programming Language :: Python :: 3.10",
|
|
18
|
+
# 'Development Status :: 4 - Beta',
|
|
19
|
+
# 'Intended Audience :: Science/Research',
|
|
20
|
+
# 'Operating System :: OS Independent',
|
|
21
|
+
# 'Topic :: Scientific/Engineering'
|
|
22
|
+
# ]
|
|
23
|
+
# keywords = ["tables", "pivot", "plotly", "venn", "plot", "vizualization"]
|
|
24
|
+
# dependencies = [
|
|
25
|
+
# "pandas >= 2.0.0",
|
|
26
|
+
# "plotly >= 5.18.0",
|
|
27
|
+
# "matplotlib >= 3.8.2",
|
|
28
|
+
# "matplotlib-venn >= 0.11.10",
|
|
29
|
+
# "seaborn >= 0.13.2",
|
|
30
|
+
# "sqlalchemy < 2.0.0",
|
|
31
|
+
# "Jinja2 >= 3.1.3",
|
|
32
|
+
# ]
|
|
33
|
+
|
|
34
|
+
# # [project.optional-dependencies]
|
|
35
|
+
# # dev = ["black", "bumpver", "isort", "pip-tools", "pytest"]
|
|
36
|
+
|
|
37
|
+
# [project.urls]
|
|
38
|
+
# homepage = "https://github.com/smeisegeier/pandas-plots"
|
|
39
|
+
# repository = "https://github.com/smeisegeier/pandas-plots"
|
|
40
|
+
|
|
41
|
+
# # [project.scripts]
|
|
42
|
+
# # realpython = "reader.__main__:main"
|
|
@@ -0,0 +1,39 @@
|
|
|
1
|
+
[metadata]
|
|
2
|
+
name = pandas-plots
|
|
3
|
+
version = 0.9.6
|
|
4
|
+
author = smeisegeier
|
|
5
|
+
author_email = dexterDSDo@googlemail.com
|
|
6
|
+
description = A collection of helper for table handling and vizualization
|
|
7
|
+
long_description = file: README.md
|
|
8
|
+
long_description_content_type = text/markdown
|
|
9
|
+
license = MIT License
|
|
10
|
+
license_files = LICENSE
|
|
11
|
+
url = https://github.com/smeisegeier/pandas-plots
|
|
12
|
+
project_urls =
|
|
13
|
+
Documentation = https://github.com/smeisegeier/pandas-plots
|
|
14
|
+
Source Code = https://github.com/smeisegeier/pandas-plots
|
|
15
|
+
Bug Tracker = https://github.com/smeisegeier/pandas-plots/issues
|
|
16
|
+
classifiers =
|
|
17
|
+
License :: OSI Approved :: MIT License
|
|
18
|
+
Programming Language :: Python :: 3
|
|
19
|
+
Programming Language :: Python :: 3.10
|
|
20
|
+
Development Status :: 4 - Beta
|
|
21
|
+
Intended Audience :: Science/Research
|
|
22
|
+
Operating System :: OS Independent
|
|
23
|
+
Topic :: Scientific/Engineering
|
|
24
|
+
|
|
25
|
+
[options]
|
|
26
|
+
python_requires = >=3.10
|
|
27
|
+
install_requires =
|
|
28
|
+
pandas >= 2.0.0
|
|
29
|
+
plotly >= 5.18.0
|
|
30
|
+
matplotlib >= 3.8.2
|
|
31
|
+
matplotlib-venn >= 0.11.10
|
|
32
|
+
seaborn >= 0.13.2
|
|
33
|
+
Jinja2 >= 3.1.3
|
|
34
|
+
requests >= 2.31.0
|
|
35
|
+
|
|
36
|
+
[egg_info]
|
|
37
|
+
tag_build =
|
|
38
|
+
tag_date = 0
|
|
39
|
+
|
|
@@ -0,0 +1,204 @@
|
|
|
1
|
+
import pandas as pd
|
|
2
|
+
import numpy as np
|
|
3
|
+
import scipy.stats
|
|
4
|
+
|
|
5
|
+
from io import BytesIO
|
|
6
|
+
from matplotlib import pyplot as plt
|
|
7
|
+
from PIL import Image
|
|
8
|
+
import requests
|
|
9
|
+
import re
|
|
10
|
+
|
|
11
|
+
from tenacity import retry
|
|
12
|
+
|
|
13
|
+
URL_REGEX = r"^(?:http|ftp)s?://" # https://stackoverflow.com/a/1617386
|
|
14
|
+
|
|
15
|
+
|
|
16
|
+
def mean_confidence_interval(df, confidence=0.95):
|
|
17
|
+
"""
|
|
18
|
+
Calculate the mean and confidence interval of the input dataframe.
|
|
19
|
+
source: https://stackoverflow.com/questions/15033511/compute-a-confidence-interval-from-sample-data
|
|
20
|
+
|
|
21
|
+
Parameters:
|
|
22
|
+
df (array-like): The input dataframe.
|
|
23
|
+
confidence (float, optional): The confidence level for the interval. Defaults to 0.95.
|
|
24
|
+
|
|
25
|
+
Returns:
|
|
26
|
+
tuple: A tuple containing the mean, interval, lower bound, and upper bound.
|
|
27
|
+
"""
|
|
28
|
+
df = df_to_series(df)
|
|
29
|
+
if df is None:
|
|
30
|
+
return None
|
|
31
|
+
a = 1.0 * np.array(df)
|
|
32
|
+
n = len(a)
|
|
33
|
+
mean, se = np.mean(a), scipy.stats.sem(a)
|
|
34
|
+
# * calculate the margin of error for the confidence interval using the t-distribution with the specified confidence level.
|
|
35
|
+
margin = se * scipy.stats.t.ppf((1 + confidence) / 2.0, n - 1)
|
|
36
|
+
lower = mean - margin
|
|
37
|
+
upper = mean + margin
|
|
38
|
+
return mean, margin, lower, upper
|
|
39
|
+
|
|
40
|
+
# # * Alternative
|
|
41
|
+
# # from statistics import NormalDist
|
|
42
|
+
# def confidence_interval(data, confidence=0.95):
|
|
43
|
+
# dist = NormalDist.from_samples(data)
|
|
44
|
+
# z = NormalDist().inv_cdf((1 + confidence) / 2.)
|
|
45
|
+
# h = dist.stdev * z / ((len(data) - 1) ** .5)
|
|
46
|
+
# return dist.mean - h, dist.mean + h
|
|
47
|
+
|
|
48
|
+
|
|
49
|
+
def df_to_series(df) -> pd.Series | None:
|
|
50
|
+
"""
|
|
51
|
+
Converts a pandas DataFrame to a pandas Series.
|
|
52
|
+
|
|
53
|
+
Parameters:
|
|
54
|
+
df (pd.DataFrame): The DataFrame to be converted.
|
|
55
|
+
|
|
56
|
+
Returns:
|
|
57
|
+
pd.Series | None: The converted Series if successful, None otherwise.
|
|
58
|
+
|
|
59
|
+
Raises:
|
|
60
|
+
None
|
|
61
|
+
|
|
62
|
+
Notes:
|
|
63
|
+
- If the input `df` is already a Series, it is returned as is.
|
|
64
|
+
- If the input `df` has more than 2 columns, an error message is printed and None is returned.
|
|
65
|
+
- If the input `df` has 1 column, a new Series is created with the input column as the data and the input index as the index.
|
|
66
|
+
- If the input `df` has 2 columns, the function checks which column is the index. If the first column is numeric, the second column is set as the data and the first column is set as the index. If the second column is numeric, the first column is set as the data and the second column is set as the index. If neither column is numeric, an error message is printed and None is returned.
|
|
67
|
+
- The index and name of the resulting Series are set to the appropriate labels.
|
|
68
|
+
"""
|
|
69
|
+
# * check if df is a series
|
|
70
|
+
if isinstance(df, pd.Series):
|
|
71
|
+
return df
|
|
72
|
+
# * too many columns
|
|
73
|
+
if len(df.columns) > 2:
|
|
74
|
+
print("❌ df must have exactly 2 columns")
|
|
75
|
+
return None
|
|
76
|
+
# * df can have 1 column, proper index is assumed then
|
|
77
|
+
elif len(df.columns) == 1:
|
|
78
|
+
return pd.Series(index=df.index, data=df.iloc[:, 0].values, name=df.columns[0])
|
|
79
|
+
else:
|
|
80
|
+
# * check which column is the index
|
|
81
|
+
if pd.api.types.is_numeric_dtype(df.iloc[:, 0]):
|
|
82
|
+
_idx_col = df.iloc[:, 1]
|
|
83
|
+
_data_col = df.iloc[:, 0]
|
|
84
|
+
elif pd.api.types.is_numeric_dtype(df.iloc[:, 1]):
|
|
85
|
+
_idx_col = df.iloc[:, 0]
|
|
86
|
+
_data_col = df.iloc[:, 1]
|
|
87
|
+
else:
|
|
88
|
+
print("❌ df must have exactly 1 numeric column")
|
|
89
|
+
return None
|
|
90
|
+
s = pd.Series(
|
|
91
|
+
index=_idx_col.values,
|
|
92
|
+
data=_data_col.values,
|
|
93
|
+
)
|
|
94
|
+
# * set index and name to proper labels
|
|
95
|
+
s.index.name = _idx_col.name
|
|
96
|
+
s.name = _data_col.name
|
|
97
|
+
return s
|
|
98
|
+
|
|
99
|
+
|
|
100
|
+
def replace_delimiter_outside_quotes(
|
|
101
|
+
input: str, delimiter_old: str = ",", delimiter_new: str = ";", quotechar: str = '"'
|
|
102
|
+
):
|
|
103
|
+
"""
|
|
104
|
+
Replace the old delimiter with the new delimiter outside of quotes in the input string.
|
|
105
|
+
|
|
106
|
+
Args:
|
|
107
|
+
input (str): The input string
|
|
108
|
+
delimiter_old (str): The old delimiter to be replaced
|
|
109
|
+
delimiter_new (str): The new delimiter to replace the old delimiter
|
|
110
|
+
quotechar (str): The character used to denote quotes
|
|
111
|
+
|
|
112
|
+
Returns:
|
|
113
|
+
str: The modified string with the delimiters replaced
|
|
114
|
+
"""
|
|
115
|
+
outside_quotes = True
|
|
116
|
+
output = ""
|
|
117
|
+
# * loop through input and toggle inside/outside status
|
|
118
|
+
for char in input:
|
|
119
|
+
if char == quotechar:
|
|
120
|
+
outside_quotes = not outside_quotes
|
|
121
|
+
elif outside_quotes and char == delimiter_old:
|
|
122
|
+
char = delimiter_new
|
|
123
|
+
output += char
|
|
124
|
+
return output
|
|
125
|
+
|
|
126
|
+
|
|
127
|
+
def wrap_text(
|
|
128
|
+
text: str | list, max_items_in_line: int = 70, sep: bool = True, apo: bool = False
|
|
129
|
+
):
|
|
130
|
+
"""
|
|
131
|
+
A function that wraps text into lines with a maximum number of items per line.
|
|
132
|
+
|
|
133
|
+
Args:
|
|
134
|
+
text (str | list): The input text or list of words to be wrapped.
|
|
135
|
+
max_items_in_line (int): The maximum number of items allowed in each line.
|
|
136
|
+
sep (bool, optional): Whether to include a comma separator between items. Defaults to True.
|
|
137
|
+
apo (bool, optional): Whether to enclose each word in single quotes. Defaults to False.
|
|
138
|
+
"""
|
|
139
|
+
|
|
140
|
+
# * check if text is string, then strip and build word list
|
|
141
|
+
is_text = isinstance(text, str)
|
|
142
|
+
if is_text:
|
|
143
|
+
text = (
|
|
144
|
+
text.replace(",", "")
|
|
145
|
+
.replace("'", "")
|
|
146
|
+
.replace("[", "")
|
|
147
|
+
.replace("]", "")
|
|
148
|
+
.split(" ")
|
|
149
|
+
)
|
|
150
|
+
|
|
151
|
+
# * start
|
|
152
|
+
i = 0
|
|
153
|
+
line = ""
|
|
154
|
+
|
|
155
|
+
# * loop through words
|
|
156
|
+
out = ""
|
|
157
|
+
for word in text:
|
|
158
|
+
apo_s = "'" if apo else ""
|
|
159
|
+
sep_s = "," if sep and not is_text else ""
|
|
160
|
+
word_s = f"{apo_s}{str(word)}{apo_s}{sep_s}"
|
|
161
|
+
# * inc counter
|
|
162
|
+
i = i + len(word_s)
|
|
163
|
+
# * construct print line
|
|
164
|
+
line = line + word_s + " "
|
|
165
|
+
# * reset if counter exceeds limit
|
|
166
|
+
if i >= max_items_in_line:
|
|
167
|
+
out = out + line + "\n"
|
|
168
|
+
line = ""
|
|
169
|
+
i = 0
|
|
170
|
+
# else:
|
|
171
|
+
# * on short lists no reset happens, trigger manually
|
|
172
|
+
out = line if not out else out
|
|
173
|
+
# * cut last newline
|
|
174
|
+
return f"[{out[:-1]}]"
|
|
175
|
+
|
|
176
|
+
|
|
177
|
+
def create_barcode_from_url(
|
|
178
|
+
url: str,
|
|
179
|
+
output_path: str | None = None,
|
|
180
|
+
show_image: bool = False,
|
|
181
|
+
):
|
|
182
|
+
WIDTH = 400
|
|
183
|
+
HEIGHT = 400
|
|
184
|
+
|
|
185
|
+
if not re.match(URL_REGEX, url):
|
|
186
|
+
print("❌ Not a valid URL")
|
|
187
|
+
return
|
|
188
|
+
|
|
189
|
+
image = requests.get(
|
|
190
|
+
f"https://chart.googleapis.com/chart?chs={WIDTH}x{HEIGHT}&cht=qr&chl={url}"
|
|
191
|
+
)
|
|
192
|
+
image.raise_for_status()
|
|
193
|
+
|
|
194
|
+
# * write binary content to file
|
|
195
|
+
if output_path:
|
|
196
|
+
with open(output_path, "wb") as qr:
|
|
197
|
+
qr.write(image.content)
|
|
198
|
+
|
|
199
|
+
# * Load the image from the response content
|
|
200
|
+
if show_image:
|
|
201
|
+
img = Image.open(BytesIO(image.content))
|
|
202
|
+
plt.imshow(img)
|
|
203
|
+
# plt.axis('off') # Turn off axis numbers
|
|
204
|
+
plt.show()
|