mipy-impute 2.1.0__tar.gz
This diff represents the content of publicly available package versions that have been released to one of the supported registries. The information contained in this diff is provided for informational purposes only and reflects changes between package versions as they appear in their respective public registries.
- mipy_impute-2.1.0/CHANGELOG.md +38 -0
- mipy_impute-2.1.0/CITATION.cff +24 -0
- mipy_impute-2.1.0/LICENSE +21 -0
- mipy_impute-2.1.0/MANIFEST.in +9 -0
- mipy_impute-2.1.0/PKG-INFO +266 -0
- mipy_impute-2.1.0/README.md +215 -0
- mipy_impute-2.1.0/docs/benchmarking.md +18 -0
- mipy_impute-2.1.0/docs/command_line.md +37 -0
- mipy_impute-2.1.0/docs/getting_started.md +43 -0
- mipy_impute-2.1.0/docs/images/accuracy.png +0 -0
- mipy_impute-2.1.0/docs/images/report.png +0 -0
- mipy_impute-2.1.0/docs/index.md +215 -0
- mipy_impute-2.1.0/docs/large_cohorts.md +17 -0
- mipy_impute-2.1.0/docs/methods.md +42 -0
- mipy_impute-2.1.0/docs/paper.md +7 -0
- mipy_impute-2.1.0/docs/r_agreement.md +39 -0
- mipy_impute-2.1.0/docs/your_data.md +107 -0
- mipy_impute-2.1.0/pyproject.toml +67 -0
- mipy_impute-2.1.0/setup.cfg +4 -0
- mipy_impute-2.1.0/src/mipy/__init__.py +174 -0
- mipy_impute-2.1.0/src/mipy/__main__.py +6 -0
- mipy_impute-2.1.0/src/mipy/analysis.py +836 -0
- mipy_impute-2.1.0/src/mipy/bigdata.py +226 -0
- mipy_impute-2.1.0/src/mipy/chunked.py +133 -0
- mipy_impute-2.1.0/src/mipy/cli.py +175 -0
- mipy_impute-2.1.0/src/mipy/context.py +40 -0
- mipy_impute-2.1.0/src/mipy/data/README.txt +3 -0
- mipy_impute-2.1.0/src/mipy/data.py +621 -0
- mipy_impute-2.1.0/src/mipy/datasets.py +148 -0
- mipy_impute-2.1.0/src/mipy/evaluate.py +97 -0
- mipy_impute-2.1.0/src/mipy/imputers.py +592 -0
- mipy_impute-2.1.0/src/mipy/io.py +141 -0
- mipy_impute-2.1.0/src/mipy/literature.py +87 -0
- mipy_impute-2.1.0/src/mipy/masking.py +109 -0
- mipy_impute-2.1.0/src/mipy/mi.py +80 -0
- mipy_impute-2.1.0/src/mipy/plots.py +339 -0
- mipy_impute-2.1.0/src/mipy/r/mipy_r_agreement.R +122 -0
- mipy_impute-2.1.0/src/mipy/rbridge.py +221 -0
- mipy_impute-2.1.0/src/mipy/report.py +307 -0
- mipy_impute-2.1.0/src/mipy/runner.py +193 -0
- mipy_impute-2.1.0/src/mipy/schema.py +41 -0
- mipy_impute-2.1.0/src/mipy/survival.py +110 -0
- mipy_impute-2.1.0/src/mipy_impute.egg-info/PKG-INFO +266 -0
- mipy_impute-2.1.0/src/mipy_impute.egg-info/SOURCES.txt +53 -0
- mipy_impute-2.1.0/src/mipy_impute.egg-info/dependency_links.txt +1 -0
- mipy_impute-2.1.0/src/mipy_impute.egg-info/entry_points.txt +2 -0
- mipy_impute-2.1.0/src/mipy_impute.egg-info/requires.txt +29 -0
- mipy_impute-2.1.0/src/mipy_impute.egg-info/top_level.txt +1 -0
- mipy_impute-2.1.0/tests/conftest.py +18 -0
- mipy_impute-2.1.0/tests/test_analysis.py +238 -0
- mipy_impute-2.1.0/tests/test_imputers.py +77 -0
- mipy_impute-2.1.0/tests/test_io_chunked_bigdata.py +58 -0
- mipy_impute-2.1.0/tests/test_masking_eval.py +48 -0
- mipy_impute-2.1.0/tests/test_rbridge.py +44 -0
- mipy_impute-2.1.0/tests/test_survival_api_literature.py +64 -0
|
@@ -0,0 +1,38 @@
|
|
|
1
|
+
# Changelog
|
|
2
|
+
|
|
3
|
+
## 2.1.0 (2026-10-16)
|
|
4
|
+
|
|
5
|
+
For users with their own data.
|
|
6
|
+
|
|
7
|
+
* `mipy.analyze()`: one call from a table to a benchmark of the methods, the
|
|
8
|
+
completed data, figures (PNG and PDF), tables (CSV and Excel) and a
|
|
9
|
+
self-contained HTML report. Every stage after the data check is protected,
|
|
10
|
+
so a failing method or figure is reported and the rest still runs.
|
|
11
|
+
* `mipy.prepare_data()` and `mipy.read_table()`: read CSV (comma, semicolon or
|
|
12
|
+
tab), Excel, TSV and Parquet; find the ID, visit, feature, clinical and
|
|
13
|
+
survival columns by name and content; read `NA`, `<LOD`, `n/a`, decimal
|
|
14
|
+
commas; turn visit labels such as `V2` or `week 4` into numbers; accept long
|
|
15
|
+
tables; explain every decision; clear `DataError` messages.
|
|
16
|
+
* Patients are ordered by their ID, so the row order of the file does not
|
|
17
|
+
change the results.
|
|
18
|
+
* `mipy.example_cohort()`: a synthetic cohort laid out like the GSE65622
|
|
19
|
+
analysis files, for trying MIPY and as a template.
|
|
20
|
+
* Command line: `mipy analyze | check | impute | example | methods`.
|
|
21
|
+
* Figures module `mipy.plots` (no pyplot; works in scripts, terminals and
|
|
22
|
+
Jupyter) and report module `mipy.report`.
|
|
23
|
+
* `Result.show()` displays tables and figures inline in Jupyter.
|
|
24
|
+
* Exploratory survival screen when the table has a survival time and event.
|
|
25
|
+
* matplotlib and openpyxl are now core dependencies.
|
|
26
|
+
* GAIN now trains for 1,000 iterations by default (hyperimpute's default; was
|
|
27
|
+
100). The paper pipeline sets its own value, so its results do not change.
|
|
28
|
+
* `mipy.impute()` also accepts a file path.
|
|
29
|
+
|
|
30
|
+
## 2.0.0 (2026-10-15)
|
|
31
|
+
|
|
32
|
+
* MICE-Long and MICE-LongMNAR; multiple-imputation versions of softImpute,
|
|
33
|
+
missForest and miceforest; Rubin's rules and interval coverage.
|
|
34
|
+
* LOD masking; repeated maskings with Monte Carlo standard errors.
|
|
35
|
+
* Agreement with the R packages (softImpute, missForest, mice, imputeLCMD),
|
|
36
|
+
with mice's ridge fallback when `norm.boot` stops on rank-deficient samples.
|
|
37
|
+
* Data handling with pandas, polars and DuckDB; chunked imputation.
|
|
38
|
+
* Survival endpoint checks and pooled univariate Cox models.
|
|
@@ -0,0 +1,24 @@
|
|
|
1
|
+
cff-version: 1.2.0
|
|
2
|
+
message: "If you use MIPY, please cite it as below."
|
|
3
|
+
title: "MIPY: Missing-data Imputation in Python for high-dimensional longitudinal data"
|
|
4
|
+
version: 2.1.0
|
|
5
|
+
date-released: 2026-10-16
|
|
6
|
+
license: MIT
|
|
7
|
+
authors:
|
|
8
|
+
- family-names: Kumar
|
|
9
|
+
given-names: Neelesh
|
|
10
|
+
orcid: "https://orcid.org/0009-0007-5435-003X"
|
|
11
|
+
affiliation: "Indian Institute of Technology (ISM) Dhanbad"
|
|
12
|
+
- family-names: Bhattacharjee
|
|
13
|
+
given-names: Atanu
|
|
14
|
+
orcid: "https://orcid.org/0000-0002-5757-5513"
|
|
15
|
+
affiliation: "University of Dundee"
|
|
16
|
+
- family-names: Vishwakarma
|
|
17
|
+
given-names: Gajendra K.
|
|
18
|
+
orcid: "https://orcid.org/0000-0002-2804-4334"
|
|
19
|
+
affiliation: "Indian Institute of Technology (ISM) Dhanbad"
|
|
20
|
+
- family-names: Majumdar
|
|
21
|
+
given-names: Tanmoy
|
|
22
|
+
orcid: "https://orcid.org/0009-0003-2297-7808"
|
|
23
|
+
affiliation: "Indian Institute of Technology (ISM) Dhanbad"
|
|
24
|
+
keywords: [missing data, imputation, multiple imputation, longitudinal data, proteomics]
|
|
@@ -0,0 +1,21 @@
|
|
|
1
|
+
MIT License
|
|
2
|
+
|
|
3
|
+
Copyright (c) 2026 Neelesh Kumar, Atanu Bhattacharjee, Gajendra K. Vishwakarma, Tanmoy Majumdar
|
|
4
|
+
|
|
5
|
+
Permission is hereby granted, free of charge, to any person obtaining a copy
|
|
6
|
+
of this software and associated documentation files (the "Software"), to deal
|
|
7
|
+
in the Software without restriction, including without limitation the rights
|
|
8
|
+
to use, copy, modify, merge, publish, distribute, sublicense, and/or sell
|
|
9
|
+
copies of the Software, and to permit persons to whom the Software is
|
|
10
|
+
furnished to do so, subject to the following conditions:
|
|
11
|
+
|
|
12
|
+
The above copyright notice and this permission notice shall be included in all
|
|
13
|
+
copies or substantial portions of the Software.
|
|
14
|
+
|
|
15
|
+
THE SOFTWARE IS PROVIDED "AS IS", WITHOUT WARRANTY OF ANY KIND, EXPRESS OR
|
|
16
|
+
IMPLIED, INCLUDING BUT NOT LIMITED TO THE WARRANTIES OF MERCHANTABILITY,
|
|
17
|
+
FITNESS FOR A PARTICULAR PURPOSE AND NONINFRINGEMENT. IN NO EVENT SHALL THE
|
|
18
|
+
AUTHORS OR COPYRIGHT HOLDERS BE LIABLE FOR ANY CLAIM, DAMAGES OR OTHER
|
|
19
|
+
LIABILITY, WHETHER IN AN ACTION OF CONTRACT, TORT OR OTHERWISE, ARISING FROM,
|
|
20
|
+
OUT OF OR IN CONNECTION WITH THE SOFTWARE OR THE USE OR OTHER DEALINGS IN THE
|
|
21
|
+
SOFTWARE.
|
|
@@ -0,0 +1,9 @@
|
|
|
1
|
+
include README.md LICENSE CHANGELOG.md CITATION.cff
|
|
2
|
+
recursive-include tests *.py
|
|
3
|
+
recursive-include docs *.md *.png
|
|
4
|
+
recursive-include src/mipy/r *.R
|
|
5
|
+
include src/mipy/data/README.txt
|
|
6
|
+
global-exclude *.pyc __pycache__ .mipy_cache
|
|
7
|
+
prune notebooks
|
|
8
|
+
prune build
|
|
9
|
+
prune dist
|
|
@@ -0,0 +1,266 @@
|
|
|
1
|
+
Metadata-Version: 2.4
|
|
2
|
+
Name: mipy-impute
|
|
3
|
+
Version: 2.1.0
|
|
4
|
+
Summary: MIPY: missing-data imputation and benchmarking in Python for high-dimensional longitudinal data
|
|
5
|
+
Author: Atanu Bhattacharjee, Gajendra K. Vishwakarma, Tanmoy Majumdar
|
|
6
|
+
Author-email: Neelesh Kumar <23dr0092@iitism.ac.in>
|
|
7
|
+
License-Expression: MIT
|
|
8
|
+
Project-URL: Homepage, https://github.com/neelesh2302-creator/mipy
|
|
9
|
+
Project-URL: Documentation, https://github.com/neelesh2302-creator/mipy/tree/main/docs
|
|
10
|
+
Project-URL: Issues, https://github.com/neelesh2302-creator/mipy/issues
|
|
11
|
+
Keywords: missing data,imputation,multiple imputation,longitudinal,proteomics,benchmark
|
|
12
|
+
Classifier: Development Status :: 4 - Beta
|
|
13
|
+
Classifier: Programming Language :: Python :: 3
|
|
14
|
+
Classifier: Programming Language :: Python :: 3 :: Only
|
|
15
|
+
Classifier: Programming Language :: Python :: 3.9
|
|
16
|
+
Classifier: Programming Language :: Python :: 3.10
|
|
17
|
+
Classifier: Programming Language :: Python :: 3.11
|
|
18
|
+
Classifier: Programming Language :: Python :: 3.12
|
|
19
|
+
Classifier: Programming Language :: Python :: 3.13
|
|
20
|
+
Classifier: Operating System :: OS Independent
|
|
21
|
+
Classifier: Intended Audience :: Science/Research
|
|
22
|
+
Classifier: Topic :: Scientific/Engineering :: Bio-Informatics
|
|
23
|
+
Classifier: Topic :: Scientific/Engineering :: Medical Science Apps.
|
|
24
|
+
Requires-Python: >=3.9
|
|
25
|
+
Description-Content-Type: text/markdown
|
|
26
|
+
License-File: LICENSE
|
|
27
|
+
Requires-Dist: numpy>=1.23
|
|
28
|
+
Requires-Dist: pandas>=1.5
|
|
29
|
+
Requires-Dist: scipy>=1.9
|
|
30
|
+
Requires-Dist: scikit-learn>=1.2
|
|
31
|
+
Requires-Dist: psutil>=5.9
|
|
32
|
+
Requires-Dist: matplotlib>=3.6
|
|
33
|
+
Requires-Dist: openpyxl>=3.0
|
|
34
|
+
Provides-Extra: ml
|
|
35
|
+
Requires-Dist: miceforest>=6; extra == "ml"
|
|
36
|
+
Requires-Dist: lightgbm>=4; extra == "ml"
|
|
37
|
+
Provides-Extra: automl
|
|
38
|
+
Requires-Dist: hyperimpute; extra == "automl"
|
|
39
|
+
Provides-Extra: bigdata
|
|
40
|
+
Requires-Dist: polars>=1.0; extra == "bigdata"
|
|
41
|
+
Requires-Dist: duckdb>=1.0; extra == "bigdata"
|
|
42
|
+
Provides-Extra: plot
|
|
43
|
+
Provides-Extra: all
|
|
44
|
+
Requires-Dist: miceforest>=6; extra == "all"
|
|
45
|
+
Requires-Dist: lightgbm>=4; extra == "all"
|
|
46
|
+
Requires-Dist: polars>=1.0; extra == "all"
|
|
47
|
+
Requires-Dist: duckdb>=1.0; extra == "all"
|
|
48
|
+
Provides-Extra: test
|
|
49
|
+
Requires-Dist: pytest>=7; extra == "test"
|
|
50
|
+
Dynamic: license-file
|
|
51
|
+
|
|
52
|
+
# MIPY: Missing-data Imputation in Python
|
|
53
|
+
|
|
54
|
+
[](https://pypi.org/project/mipy-impute/)
|
|
55
|
+
[](https://pypi.org/project/mipy-impute/)
|
|
56
|
+
[](https://github.com/neelesh2302-creator/mipy/blob/main/LICENSE)
|
|
57
|
+
|
|
58
|
+
MIPY finds out which imputation method works best on **your** data, fills in
|
|
59
|
+
the missing values with it, and gives you the tables, figures and a report to
|
|
60
|
+
show for it. It is built for **high-dimensional longitudinal data**: many
|
|
61
|
+
variables (for example hundreds of proteins) measured repeatedly on the same
|
|
62
|
+
patients, as in the serum proteomics series GSE65622.
|
|
63
|
+
|
|
64
|
+
```python
|
|
65
|
+
import mipy
|
|
66
|
+
res = mipy.analyze("my_data.csv") # one line: benchmark, impute, figures, report
|
|
67
|
+
```
|
|
68
|
+
|
|
69
|
+
That call:
|
|
70
|
+
|
|
71
|
+
1. reads the table and works out which column is the patient ID, which is the
|
|
72
|
+
visit, which are features, clinical covariates and survival times (and
|
|
73
|
+
tells you, so you can correct it);
|
|
74
|
+
2. hides 20% of the values you **do** have, under three assumptions about why
|
|
75
|
+
values go missing (completely at random, depending on visit and clinical
|
|
76
|
+
data, or because they are low), repeats this three times, and asks every
|
|
77
|
+
method to fill them in;
|
|
78
|
+
3. scores each method against the hidden true values (nRMSE within each
|
|
79
|
+
feature; 1.00 = filling in the feature's mean), with Monte Carlo standard
|
|
80
|
+
errors, the share of features where the method beats the mean, whether
|
|
81
|
+
each patient's visit-to-visit variation is kept, and, for multiple
|
|
82
|
+
imputation, whether the 95% intervals are honest;
|
|
83
|
+
4. fills in your real missing values with the best method (and gives *m*
|
|
84
|
+
completed tables from the best multiple-imputation method);
|
|
85
|
+
5. runs an exploratory survival screen when the table has a survival time and
|
|
86
|
+
an event column;
|
|
87
|
+
6. writes everything into one folder, with an HTML report that explains each
|
|
88
|
+
result in plain language.
|
|
89
|
+
|
|
90
|
+
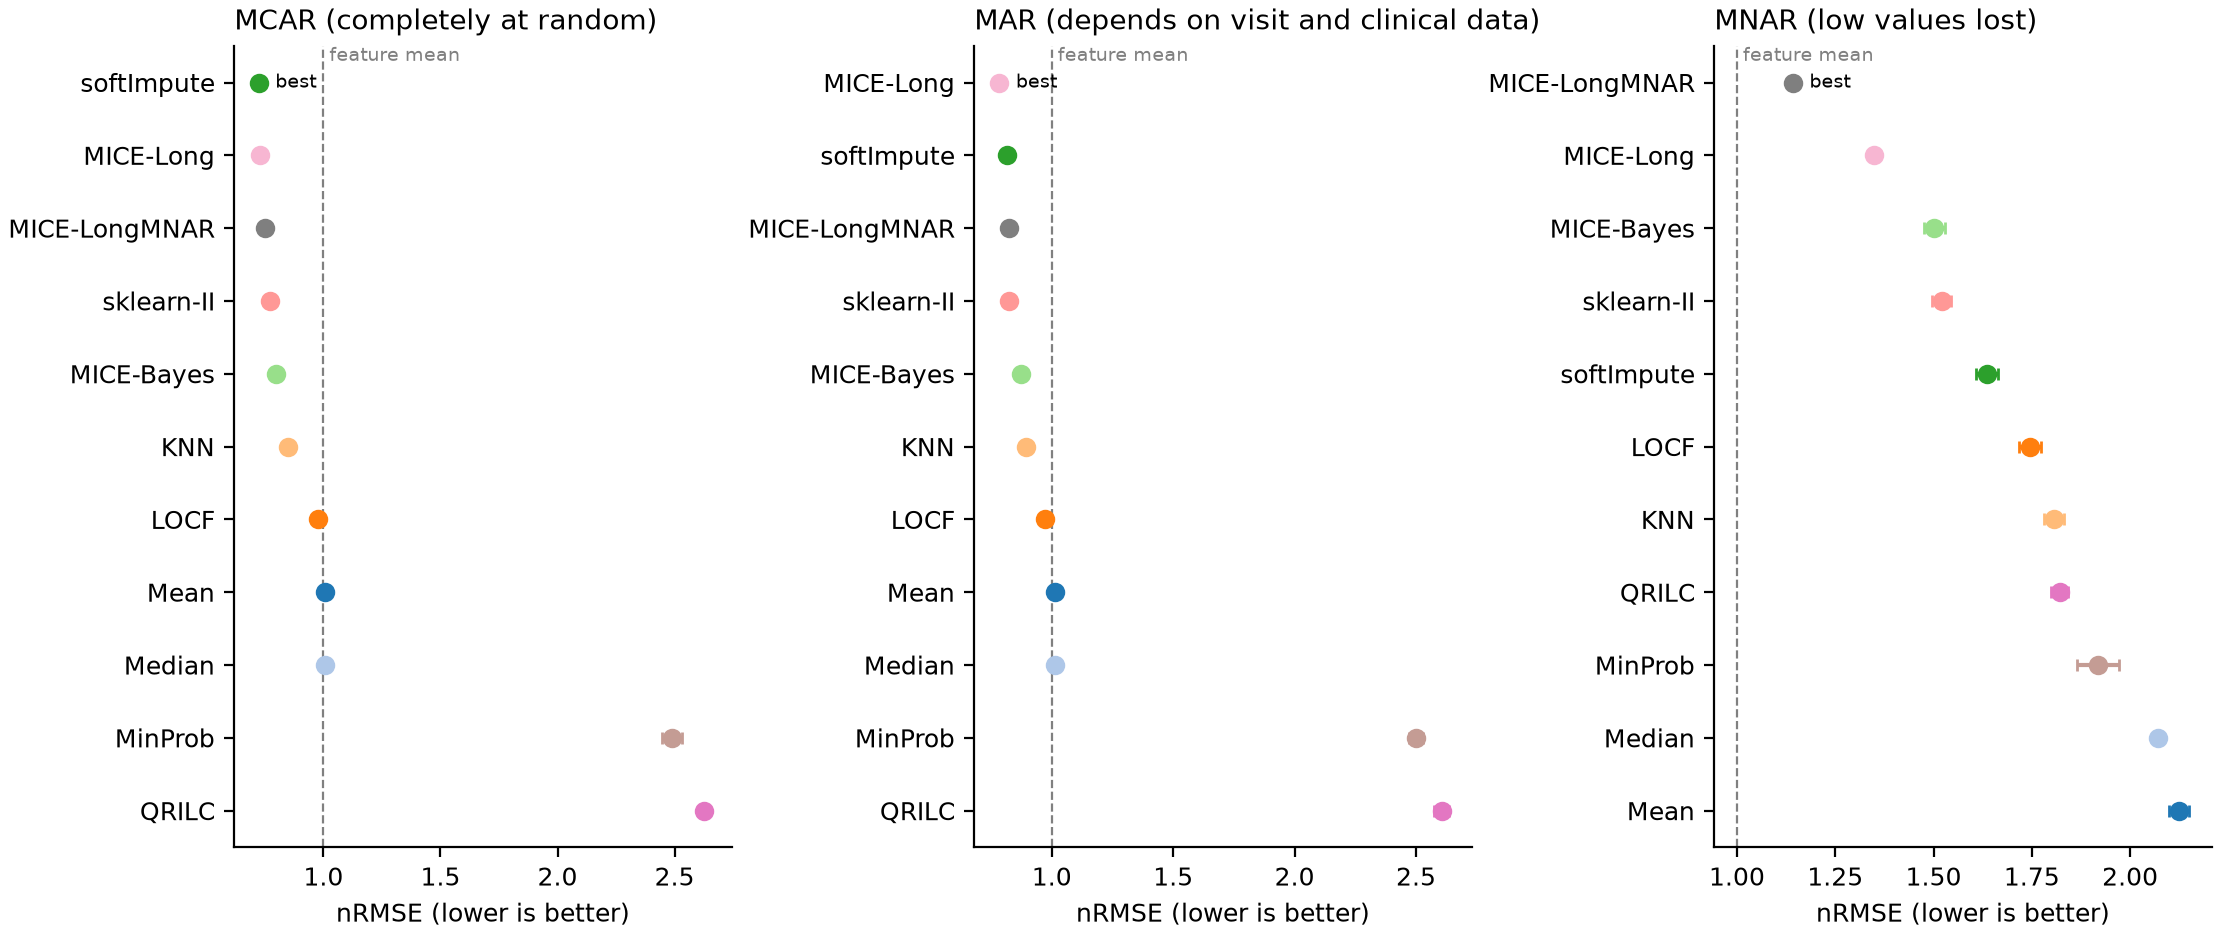
|
|
91
|
+
|
|
92
|
+
## Install
|
|
93
|
+
|
|
94
|
+
```bash
|
|
95
|
+
pip install mipy-impute
|
|
96
|
+
```
|
|
97
|
+
|
|
98
|
+
Python 3.9 or newer, on Windows, macOS or Linux. Optional extras add methods:
|
|
99
|
+
|
|
100
|
+
```bash
|
|
101
|
+
pip install "mipy-impute[ml]" # miceforest (LightGBM)
|
|
102
|
+
pip install "mipy-impute[automl]" # HyperImpute and GAIN (needs PyTorch)
|
|
103
|
+
pip install "mipy-impute[bigdata]" # polars and DuckDB for very large tables
|
|
104
|
+
```
|
|
105
|
+
|
|
106
|
+
Methods whose package is missing are skipped with a message that says what to
|
|
107
|
+
install; nothing fails.
|
|
108
|
+
|
|
109
|
+
## Try it in one minute
|
|
110
|
+
|
|
111
|
+
```python
|
|
112
|
+
import mipy
|
|
113
|
+
|
|
114
|
+
df = mipy.example_cohort() # synthetic cohort laid out like GSE65622
|
|
115
|
+
res = mipy.analyze(df, out="example_results", methods="quick", repeats=1)
|
|
116
|
+
res.show() # tables and figures; inline in Jupyter
|
|
117
|
+
```
|
|
118
|
+
|
|
119
|
+
Or from a terminal (Command Prompt, PowerShell, or a shell):
|
|
120
|
+
|
|
121
|
+
```bash
|
|
122
|
+
mipy example example.csv
|
|
123
|
+
mipy analyze example.csv --methods quick --repeats 1 --open
|
|
124
|
+
```
|
|
125
|
+
|
|
126
|
+
## Your own data
|
|
127
|
+
|
|
128
|
+
One row per patient visit, like this (any column names work):
|
|
129
|
+
|
|
130
|
+
| Patient_ID | sampling_point | EN-RAGE | GDF-15 | ... | RFS | event | trg_score |
|
|
131
|
+
|---|---|---|---|---|---|---|---|
|
|
132
|
+
| 1 | 1 | 59.08 | 1203.4 | ... | 2727 | 0 | 4 |
|
|
133
|
+
| 1 | 2 | 52.19 | | ... | 2697 | 0 | 4 |
|
|
134
|
+
| 2 | 1 | | 980.1 | ... | 1579 | 1 | 2 |
|
|
135
|
+
|
|
136
|
+
* an **ID** column and a **visit** column (optional, but needed by the
|
|
137
|
+
longitudinal methods),
|
|
138
|
+
* many **numeric feature** columns with empty cells where values are missing
|
|
139
|
+
(`NA`, `n/a`, `<LOD`, `ND` and similar entries are read as missing),
|
|
140
|
+
* optional **clinical** columns (few distinct values: stage, grade, batch),
|
|
141
|
+
* optional **survival** columns (a time and a 0/1 event).
|
|
142
|
+
|
|
143
|
+
CSV, Excel, TSV and Parquet files work, and so do pandas DataFrames. Check how
|
|
144
|
+
MIPY reads a file before running anything:
|
|
145
|
+
|
|
146
|
+
```bash
|
|
147
|
+
mipy check my_data.csv
|
|
148
|
+
```
|
|
149
|
+
|
|
150
|
+
If a column is detected wrongly, say which is which:
|
|
151
|
+
|
|
152
|
+
```python
|
|
153
|
+
res = mipy.analyze("my_data.xlsx", id_col="Patient_ID", time_col="sampling_point",
|
|
154
|
+
features="EN-RAGE:Prot_496", # a range of columns, or a list
|
|
155
|
+
clinical=["trg_score", "ypn_stage"], survival=("RFS", "event"),
|
|
156
|
+
out="my_results")
|
|
157
|
+
```
|
|
158
|
+
|
|
159
|
+
More in [docs/your_data.md](https://github.com/neelesh2302-creator/mipy/blob/main/docs/your_data.md).
|
|
160
|
+
|
|
161
|
+
## What you get
|
|
162
|
+
|
|
163
|
+
```
|
|
164
|
+
my_results/
|
|
165
|
+
report.html all results, figures embedded, with explanations
|
|
166
|
+
figures/ fig01_missingness ... fig09_survival (PNG and PDF)
|
|
167
|
+
tables/ accuracy_summary.csv, decision.csv, ... and mipy_results.xlsx
|
|
168
|
+
completed_data/ completed_<best method>.csv and completed_<MI method>_draw1..5.csv
|
|
169
|
+
run_log.txt every step, warnings and error details
|
|
170
|
+
```
|
|
171
|
+
|
|
172
|
+
| Figure | Shows |
|
|
173
|
+
|---|---|
|
|
174
|
+
| missingness | where values are missing, and whether low-level features miss more often |
|
|
175
|
+
| masking | which values each masking design hid |
|
|
176
|
+
| accuracy | nRMSE of every method under every mechanism, with Monte Carlo intervals |
|
|
177
|
+
| nrmse_per_feature | the spread of the error across features |
|
|
178
|
+
| sd_ratio | whether each patient's visit-to-visit variation is kept |
|
|
179
|
+
| coverage | calibration of multiple imputation (95% intervals) |
|
|
180
|
+
| runtime | seconds per run |
|
|
181
|
+
| imputed_vs_observed | your real missing values as filled in, against the observed values |
|
|
182
|
+
| survival | exploratory Cox screen (when survival columns exist) |
|
|
183
|
+
|
|
184
|
+
In Python, `res` holds the same results: `res.summary`, `res.decision`,
|
|
185
|
+
`res.completed`, `res.completed_draws`, `res.survival`, `res.tables`,
|
|
186
|
+
`res.figures`, `res.warnings`.
|
|
187
|
+
|
|
188
|
+
## Choosing methods
|
|
189
|
+
|
|
190
|
+
| `methods=` | Methods | Time on 288 visits x 507 proteins, 9 maskings* |
|
|
191
|
+
|---|---|---|
|
|
192
|
+
| `"quick"` | Mean, LOCF, KNN, softImpute, MinProb, QRILC, MICE-Long | about 5 min |
|
|
193
|
+
| `"standard"` (default) | quick + Median, MICE-Bayes, sklearn-II, MICE-LongMNAR | 10 to 20 min |
|
|
194
|
+
| `"complete"` | standard + missForest, miceforest, HyperImpute, GAIN | 2 h or more |
|
|
195
|
+
| `"all"` | complete + the multiple-imputation versions and the exact imputeLCMD variants | longer |
|
|
196
|
+
|
|
197
|
+
\*one process on a 2-core machine; the example cohort takes about 3 minutes
|
|
198
|
+
with "standard". `n_workers="auto"` runs several methods at once, and runs
|
|
199
|
+
already finished are reused if you stop and start again.
|
|
200
|
+
|
|
201
|
+
| Method | Family | Multiple imputation | Uses patients | Peer-reviewed description |
|
|
202
|
+
|---|---|---|---|---|
|
|
203
|
+
| Mean, Median | naive | no | no | no |
|
|
204
|
+
| LOCF | longitudinal rule | no | yes | no |
|
|
205
|
+
| KNN | neighbour | no | no | yes (Troyanskaya et al. 2001) |
|
|
206
|
+
| softImpute | low-rank | no | no | yes (Mazumder et al. 2010) |
|
|
207
|
+
| MICE-Bayes | chained equations | yes | no | yes (van Buuren & Groothuis-Oudshoorn 2011) |
|
|
208
|
+
| missForest | chained equations | no | no | yes (Stekhoven & Buhlmann 2012) |
|
|
209
|
+
| sklearn-II | chained equations | no | no | no (scikit-learn IterativeImputer) |
|
|
210
|
+
| miceforest | chained equations | no | no | no |
|
|
211
|
+
| HyperImpute | AutoML | no | no | yes (Jarrett et al. 2022) |
|
|
212
|
+
| GAIN | generative | no | no | yes (Yoon et al. 2018) |
|
|
213
|
+
| MinProb, QRILC | left-censored | no | no | yes (Lazar et al. 2016) |
|
|
214
|
+
| **MICE-Long** | longitudinal chained | yes | yes | new in MIPY |
|
|
215
|
+
| **MICE-LongMNAR** | selection-model MNAR | yes | yes | new in MIPY |
|
|
216
|
+
| softImpute-MI, missForest-MI, miceforest-MI | MI versions | yes | no | new in MIPY |
|
|
217
|
+
|
|
218
|
+
* **MICE-Long**: chained equations that use each patient's previous visit,
|
|
219
|
+
next visit and own mean, with a patient-level bootstrap (proper multiple
|
|
220
|
+
imputation).
|
|
221
|
+
* **MICE-LongMNAR**: the same with selection-model draws for values lost
|
|
222
|
+
below a detection limit; `settings={"gamma": ...}` sets the sensitivity
|
|
223
|
+
parameter.
|
|
224
|
+
* softImpute, missForest, mice's `norm.boot` and imputeLCMD's MinProb and
|
|
225
|
+
QRILC are implemented in Python and checked against the R packages
|
|
226
|
+
(identical parameters; cell-level agreement r > 0.99 for softImpute).
|
|
227
|
+
|
|
228
|
+
## Lower-level functions
|
|
229
|
+
|
|
230
|
+
```python
|
|
231
|
+
done = mipy.impute(df, method="softImpute", id_col="Patient_ID", time_col="sampling_point", log2=True)
|
|
232
|
+
draws = mipy.impute(df, method="MICE-Long", id_col="Patient_ID", time_col="sampling_point", m=5, log2=True)
|
|
233
|
+
bench = mipy.benchmark(df, methods=["Mean", "softImpute", "MICE-Long"], id_col="Patient_ID",
|
|
234
|
+
time_col="sampling_point", log2=True, mechanisms=("MCAR", "MNAR"), repeats=3)
|
|
235
|
+
|
|
236
|
+
from mipy.mi import pool_estimates # Rubin's rules over the m completions
|
|
237
|
+
pooled = pool_estimates(estimates, by="term") # columns: draw, term, beta, se
|
|
238
|
+
```
|
|
239
|
+
|
|
240
|
+
`mipy.list_methods()` lists every method with the function it calls and its
|
|
241
|
+
evidence; `mipy.literature()` lists 14 Python imputation packages and the
|
|
242
|
+
publication behind each.
|
|
243
|
+
|
|
244
|
+
## Reproducing the MIPY paper
|
|
245
|
+
|
|
246
|
+
`notebooks/MIPY_v2_pipeline.ipynb` runs the full GSE65622 analysis of the
|
|
247
|
+
paper (all methods, multiple imputation, MNAR sensitivity, agreement with R,
|
|
248
|
+
data handling up to millions of patients, a synthetic second cohort, the
|
|
249
|
+
survival screen) and writes every number, table and figure.
|
|
250
|
+
|
|
251
|
+
## Tests
|
|
252
|
+
|
|
253
|
+
```bash
|
|
254
|
+
pip install "mipy-impute[all,test]"
|
|
255
|
+
pytest
|
|
256
|
+
```
|
|
257
|
+
|
|
258
|
+
## Citation
|
|
259
|
+
|
|
260
|
+
See [CITATION.cff](https://github.com/neelesh2302-creator/mipy/blob/main/CITATION.cff).
|
|
261
|
+
If you use MIPY, please cite the MIPY paper and the publication of each method
|
|
262
|
+
you report (`mipy.list_methods()` gives the reference key).
|
|
263
|
+
|
|
264
|
+
## Licence
|
|
265
|
+
|
|
266
|
+
MIT
|
|
@@ -0,0 +1,215 @@
|
|
|
1
|
+
# MIPY: Missing-data Imputation in Python
|
|
2
|
+
|
|
3
|
+
[](https://pypi.org/project/mipy-impute/)
|
|
4
|
+
[](https://pypi.org/project/mipy-impute/)
|
|
5
|
+
[](https://github.com/neelesh2302-creator/mipy/blob/main/LICENSE)
|
|
6
|
+
|
|
7
|
+
MIPY finds out which imputation method works best on **your** data, fills in
|
|
8
|
+
the missing values with it, and gives you the tables, figures and a report to
|
|
9
|
+
show for it. It is built for **high-dimensional longitudinal data**: many
|
|
10
|
+
variables (for example hundreds of proteins) measured repeatedly on the same
|
|
11
|
+
patients, as in the serum proteomics series GSE65622.
|
|
12
|
+
|
|
13
|
+
```python
|
|
14
|
+
import mipy
|
|
15
|
+
res = mipy.analyze("my_data.csv") # one line: benchmark, impute, figures, report
|
|
16
|
+
```
|
|
17
|
+
|
|
18
|
+
That call:
|
|
19
|
+
|
|
20
|
+
1. reads the table and works out which column is the patient ID, which is the
|
|
21
|
+
visit, which are features, clinical covariates and survival times (and
|
|
22
|
+
tells you, so you can correct it);
|
|
23
|
+
2. hides 20% of the values you **do** have, under three assumptions about why
|
|
24
|
+
values go missing (completely at random, depending on visit and clinical
|
|
25
|
+
data, or because they are low), repeats this three times, and asks every
|
|
26
|
+
method to fill them in;
|
|
27
|
+
3. scores each method against the hidden true values (nRMSE within each
|
|
28
|
+
feature; 1.00 = filling in the feature's mean), with Monte Carlo standard
|
|
29
|
+
errors, the share of features where the method beats the mean, whether
|
|
30
|
+
each patient's visit-to-visit variation is kept, and, for multiple
|
|
31
|
+
imputation, whether the 95% intervals are honest;
|
|
32
|
+
4. fills in your real missing values with the best method (and gives *m*
|
|
33
|
+
completed tables from the best multiple-imputation method);
|
|
34
|
+
5. runs an exploratory survival screen when the table has a survival time and
|
|
35
|
+
an event column;
|
|
36
|
+
6. writes everything into one folder, with an HTML report that explains each
|
|
37
|
+
result in plain language.
|
|
38
|
+
|
|
39
|
+

|
|
40
|
+
|
|
41
|
+
## Install
|
|
42
|
+
|
|
43
|
+
```bash
|
|
44
|
+
pip install mipy-impute
|
|
45
|
+
```
|
|
46
|
+
|
|
47
|
+
Python 3.9 or newer, on Windows, macOS or Linux. Optional extras add methods:
|
|
48
|
+
|
|
49
|
+
```bash
|
|
50
|
+
pip install "mipy-impute[ml]" # miceforest (LightGBM)
|
|
51
|
+
pip install "mipy-impute[automl]" # HyperImpute and GAIN (needs PyTorch)
|
|
52
|
+
pip install "mipy-impute[bigdata]" # polars and DuckDB for very large tables
|
|
53
|
+
```
|
|
54
|
+
|
|
55
|
+
Methods whose package is missing are skipped with a message that says what to
|
|
56
|
+
install; nothing fails.
|
|
57
|
+
|
|
58
|
+
## Try it in one minute
|
|
59
|
+
|
|
60
|
+
```python
|
|
61
|
+
import mipy
|
|
62
|
+
|
|
63
|
+
df = mipy.example_cohort() # synthetic cohort laid out like GSE65622
|
|
64
|
+
res = mipy.analyze(df, out="example_results", methods="quick", repeats=1)
|
|
65
|
+
res.show() # tables and figures; inline in Jupyter
|
|
66
|
+
```
|
|
67
|
+
|
|
68
|
+
Or from a terminal (Command Prompt, PowerShell, or a shell):
|
|
69
|
+
|
|
70
|
+
```bash
|
|
71
|
+
mipy example example.csv
|
|
72
|
+
mipy analyze example.csv --methods quick --repeats 1 --open
|
|
73
|
+
```
|
|
74
|
+
|
|
75
|
+
## Your own data
|
|
76
|
+
|
|
77
|
+
One row per patient visit, like this (any column names work):
|
|
78
|
+
|
|
79
|
+
| Patient_ID | sampling_point | EN-RAGE | GDF-15 | ... | RFS | event | trg_score |
|
|
80
|
+
|---|---|---|---|---|---|---|---|
|
|
81
|
+
| 1 | 1 | 59.08 | 1203.4 | ... | 2727 | 0 | 4 |
|
|
82
|
+
| 1 | 2 | 52.19 | | ... | 2697 | 0 | 4 |
|
|
83
|
+
| 2 | 1 | | 980.1 | ... | 1579 | 1 | 2 |
|
|
84
|
+
|
|
85
|
+
* an **ID** column and a **visit** column (optional, but needed by the
|
|
86
|
+
longitudinal methods),
|
|
87
|
+
* many **numeric feature** columns with empty cells where values are missing
|
|
88
|
+
(`NA`, `n/a`, `<LOD`, `ND` and similar entries are read as missing),
|
|
89
|
+
* optional **clinical** columns (few distinct values: stage, grade, batch),
|
|
90
|
+
* optional **survival** columns (a time and a 0/1 event).
|
|
91
|
+
|
|
92
|
+
CSV, Excel, TSV and Parquet files work, and so do pandas DataFrames. Check how
|
|
93
|
+
MIPY reads a file before running anything:
|
|
94
|
+
|
|
95
|
+
```bash
|
|
96
|
+
mipy check my_data.csv
|
|
97
|
+
```
|
|
98
|
+
|
|
99
|
+
If a column is detected wrongly, say which is which:
|
|
100
|
+
|
|
101
|
+
```python
|
|
102
|
+
res = mipy.analyze("my_data.xlsx", id_col="Patient_ID", time_col="sampling_point",
|
|
103
|
+
features="EN-RAGE:Prot_496", # a range of columns, or a list
|
|
104
|
+
clinical=["trg_score", "ypn_stage"], survival=("RFS", "event"),
|
|
105
|
+
out="my_results")
|
|
106
|
+
```
|
|
107
|
+
|
|
108
|
+
More in [docs/your_data.md](https://github.com/neelesh2302-creator/mipy/blob/main/docs/your_data.md).
|
|
109
|
+
|
|
110
|
+
## What you get
|
|
111
|
+
|
|
112
|
+
```
|
|
113
|
+
my_results/
|
|
114
|
+
report.html all results, figures embedded, with explanations
|
|
115
|
+
figures/ fig01_missingness ... fig09_survival (PNG and PDF)
|
|
116
|
+
tables/ accuracy_summary.csv, decision.csv, ... and mipy_results.xlsx
|
|
117
|
+
completed_data/ completed_<best method>.csv and completed_<MI method>_draw1..5.csv
|
|
118
|
+
run_log.txt every step, warnings and error details
|
|
119
|
+
```
|
|
120
|
+
|
|
121
|
+
| Figure | Shows |
|
|
122
|
+
|---|---|
|
|
123
|
+
| missingness | where values are missing, and whether low-level features miss more often |
|
|
124
|
+
| masking | which values each masking design hid |
|
|
125
|
+
| accuracy | nRMSE of every method under every mechanism, with Monte Carlo intervals |
|
|
126
|
+
| nrmse_per_feature | the spread of the error across features |
|
|
127
|
+
| sd_ratio | whether each patient's visit-to-visit variation is kept |
|
|
128
|
+
| coverage | calibration of multiple imputation (95% intervals) |
|
|
129
|
+
| runtime | seconds per run |
|
|
130
|
+
| imputed_vs_observed | your real missing values as filled in, against the observed values |
|
|
131
|
+
| survival | exploratory Cox screen (when survival columns exist) |
|
|
132
|
+
|
|
133
|
+
In Python, `res` holds the same results: `res.summary`, `res.decision`,
|
|
134
|
+
`res.completed`, `res.completed_draws`, `res.survival`, `res.tables`,
|
|
135
|
+
`res.figures`, `res.warnings`.
|
|
136
|
+
|
|
137
|
+
## Choosing methods
|
|
138
|
+
|
|
139
|
+
| `methods=` | Methods | Time on 288 visits x 507 proteins, 9 maskings* |
|
|
140
|
+
|---|---|---|
|
|
141
|
+
| `"quick"` | Mean, LOCF, KNN, softImpute, MinProb, QRILC, MICE-Long | about 5 min |
|
|
142
|
+
| `"standard"` (default) | quick + Median, MICE-Bayes, sklearn-II, MICE-LongMNAR | 10 to 20 min |
|
|
143
|
+
| `"complete"` | standard + missForest, miceforest, HyperImpute, GAIN | 2 h or more |
|
|
144
|
+
| `"all"` | complete + the multiple-imputation versions and the exact imputeLCMD variants | longer |
|
|
145
|
+
|
|
146
|
+
\*one process on a 2-core machine; the example cohort takes about 3 minutes
|
|
147
|
+
with "standard". `n_workers="auto"` runs several methods at once, and runs
|
|
148
|
+
already finished are reused if you stop and start again.
|
|
149
|
+
|
|
150
|
+
| Method | Family | Multiple imputation | Uses patients | Peer-reviewed description |
|
|
151
|
+
|---|---|---|---|---|
|
|
152
|
+
| Mean, Median | naive | no | no | no |
|
|
153
|
+
| LOCF | longitudinal rule | no | yes | no |
|
|
154
|
+
| KNN | neighbour | no | no | yes (Troyanskaya et al. 2001) |
|
|
155
|
+
| softImpute | low-rank | no | no | yes (Mazumder et al. 2010) |
|
|
156
|
+
| MICE-Bayes | chained equations | yes | no | yes (van Buuren & Groothuis-Oudshoorn 2011) |
|
|
157
|
+
| missForest | chained equations | no | no | yes (Stekhoven & Buhlmann 2012) |
|
|
158
|
+
| sklearn-II | chained equations | no | no | no (scikit-learn IterativeImputer) |
|
|
159
|
+
| miceforest | chained equations | no | no | no |
|
|
160
|
+
| HyperImpute | AutoML | no | no | yes (Jarrett et al. 2022) |
|
|
161
|
+
| GAIN | generative | no | no | yes (Yoon et al. 2018) |
|
|
162
|
+
| MinProb, QRILC | left-censored | no | no | yes (Lazar et al. 2016) |
|
|
163
|
+
| **MICE-Long** | longitudinal chained | yes | yes | new in MIPY |
|
|
164
|
+
| **MICE-LongMNAR** | selection-model MNAR | yes | yes | new in MIPY |
|
|
165
|
+
| softImpute-MI, missForest-MI, miceforest-MI | MI versions | yes | no | new in MIPY |
|
|
166
|
+
|
|
167
|
+
* **MICE-Long**: chained equations that use each patient's previous visit,
|
|
168
|
+
next visit and own mean, with a patient-level bootstrap (proper multiple
|
|
169
|
+
imputation).
|
|
170
|
+
* **MICE-LongMNAR**: the same with selection-model draws for values lost
|
|
171
|
+
below a detection limit; `settings={"gamma": ...}` sets the sensitivity
|
|
172
|
+
parameter.
|
|
173
|
+
* softImpute, missForest, mice's `norm.boot` and imputeLCMD's MinProb and
|
|
174
|
+
QRILC are implemented in Python and checked against the R packages
|
|
175
|
+
(identical parameters; cell-level agreement r > 0.99 for softImpute).
|
|
176
|
+
|
|
177
|
+
## Lower-level functions
|
|
178
|
+
|
|
179
|
+
```python
|
|
180
|
+
done = mipy.impute(df, method="softImpute", id_col="Patient_ID", time_col="sampling_point", log2=True)
|
|
181
|
+
draws = mipy.impute(df, method="MICE-Long", id_col="Patient_ID", time_col="sampling_point", m=5, log2=True)
|
|
182
|
+
bench = mipy.benchmark(df, methods=["Mean", "softImpute", "MICE-Long"], id_col="Patient_ID",
|
|
183
|
+
time_col="sampling_point", log2=True, mechanisms=("MCAR", "MNAR"), repeats=3)
|
|
184
|
+
|
|
185
|
+
from mipy.mi import pool_estimates # Rubin's rules over the m completions
|
|
186
|
+
pooled = pool_estimates(estimates, by="term") # columns: draw, term, beta, se
|
|
187
|
+
```
|
|
188
|
+
|
|
189
|
+
`mipy.list_methods()` lists every method with the function it calls and its
|
|
190
|
+
evidence; `mipy.literature()` lists 14 Python imputation packages and the
|
|
191
|
+
publication behind each.
|
|
192
|
+
|
|
193
|
+
## Reproducing the MIPY paper
|
|
194
|
+
|
|
195
|
+
`notebooks/MIPY_v2_pipeline.ipynb` runs the full GSE65622 analysis of the
|
|
196
|
+
paper (all methods, multiple imputation, MNAR sensitivity, agreement with R,
|
|
197
|
+
data handling up to millions of patients, a synthetic second cohort, the
|
|
198
|
+
survival screen) and writes every number, table and figure.
|
|
199
|
+
|
|
200
|
+
## Tests
|
|
201
|
+
|
|
202
|
+
```bash
|
|
203
|
+
pip install "mipy-impute[all,test]"
|
|
204
|
+
pytest
|
|
205
|
+
```
|
|
206
|
+
|
|
207
|
+
## Citation
|
|
208
|
+
|
|
209
|
+
See [CITATION.cff](https://github.com/neelesh2302-creator/mipy/blob/main/CITATION.cff).
|
|
210
|
+
If you use MIPY, please cite the MIPY paper and the publication of each method
|
|
211
|
+
you report (`mipy.list_methods()` gives the reference key).
|
|
212
|
+
|
|
213
|
+
## Licence
|
|
214
|
+
|
|
215
|
+
MIT
|
|
@@ -0,0 +1,18 @@
|
|
|
1
|
+
# Benchmarking
|
|
2
|
+
|
|
3
|
+
`mipy.benchmark()` hides a share of the observed values, imputes them with each
|
|
4
|
+
method and scores the hidden values:
|
|
5
|
+
|
|
6
|
+
* **nRMSE** within each column (RMSE / SD of the true values; 1 = the column's
|
|
7
|
+
own mean), summarised by the median across columns. Pooling cells across
|
|
8
|
+
columns inflates correlations (a constant imputer reaches r > 0.9), so all
|
|
9
|
+
scores are within-column.
|
|
10
|
+
* **Within-patient SD ratio**: pooled within-patient SD of the completed values
|
|
11
|
+
over that of the true values (1 = preserved, < 1 flattened, > 1 inflated).
|
|
12
|
+
* **Coverage** (multiple imputation): share of hidden values inside the 95%
|
|
13
|
+
interval formed from the completions.
|
|
14
|
+
|
|
15
|
+
Masking designs (`mipy.masking.Amputer`): MCAR; MAR (driven by visit, clinical
|
|
16
|
+
covariates and the sample's mean level); MNAR (logistic in the cell's own
|
|
17
|
+
value, slope `strength`); LOD (hard detection limit). Every column keeps at
|
|
18
|
+
least `min_obs` observed values.
|
|
@@ -0,0 +1,37 @@
|
|
|
1
|
+
# Command line
|
|
2
|
+
|
|
3
|
+
Installing MIPY adds the command `mipy` (also available as `python -m mipy`).
|
|
4
|
+
|
|
5
|
+
```bash
|
|
6
|
+
mipy example example.csv # write the example cohort
|
|
7
|
+
mipy check my_data.csv # how MIPY reads the table; nothing imputed
|
|
8
|
+
mipy analyze my_data.csv --out results # benchmark, impute, figures, report
|
|
9
|
+
mipy impute my_data.csv --method MICE-Long --m 5 # one method, no benchmark
|
|
10
|
+
mipy methods # the methods and their evidence
|
|
11
|
+
mipy --version
|
|
12
|
+
```
|
|
13
|
+
|
|
14
|
+
## mipy analyze
|
|
15
|
+
|
|
16
|
+
```
|
|
17
|
+
mipy analyze DATA [--id COL] [--time COL] [--features A,B | first:last]
|
|
18
|
+
[--clinical A,B | none] [--survival TIME EVENT | --no-survival]
|
|
19
|
+
[--out DIR] [--methods quick|standard|complete|all|A,B]
|
|
20
|
+
[--mechanisms MCAR,MAR,MNAR,LOD] [--repeats 3] [--rate 0.2]
|
|
21
|
+
[--strength 2] [--m 5] [--export auto|METHOD|none]
|
|
22
|
+
[--workers 1|auto] [--seed 2026] [--log2 auto|yes|no]
|
|
23
|
+
[--max-missing 0.9] [--sheet NAME] [--layout wide|long
|
|
24
|
+
--feature-col COL --value-col COL] [--fresh] [--open] [--quiet]
|
|
25
|
+
```
|
|
26
|
+
|
|
27
|
+
Example with the columns of the GSE65622 analysis files:
|
|
28
|
+
|
|
29
|
+
```bash
|
|
30
|
+
mipy analyze RFS_data.csv --id Patient_ID --time sampling_point --survival RFS event --out RFS_results --open
|
|
31
|
+
```
|
|
32
|
+
|
|
33
|
+
On Windows, a path with spaces needs quotes: `mipy analyze "C:\My data\cohort.xlsx"`.
|
|
34
|
+
|
|
35
|
+
The command prints each step, and at the end the best method per mechanism and
|
|
36
|
+
the path of the report. Errors in the input (a missing file or column) are
|
|
37
|
+
printed as one line starting with `mipy:`, with exit code 2.
|
|
@@ -0,0 +1,43 @@
|
|
|
1
|
+
# Getting started
|
|
2
|
+
|
|
3
|
+
## The one-call route
|
|
4
|
+
|
|
5
|
+
```python
|
|
6
|
+
import mipy
|
|
7
|
+
|
|
8
|
+
df = mipy.example_cohort() # or pd.read_csv("my_data.csv"), or a file path
|
|
9
|
+
res = mipy.analyze(df, out="example_results", methods="quick", repeats=1)
|
|
10
|
+
res.show() # inline in Jupyter; text and file paths elsewhere
|
|
11
|
+
res.decision # best method under each mechanism
|
|
12
|
+
res.completed # the completed table
|
|
13
|
+
```
|
|
14
|
+
|
|
15
|
+
`notebooks/quickstart.ipynb` shows the output, figures included. See
|
|
16
|
+
[your_data.md](your_data.md) for the table layout and every option.
|
|
17
|
+
|
|
18
|
+
## Step by step, with simulated data
|
|
19
|
+
|
|
20
|
+
```python
|
|
21
|
+
import mipy
|
|
22
|
+
from mipy.datasets import simulate_longitudinal
|
|
23
|
+
from mipy.masking import Amputer
|
|
24
|
+
|
|
25
|
+
sim = simulate_longitudinal(n_patients=100, n_proteins=80, seed=1)
|
|
26
|
+
X, patient, time = sim["X"], sim["patient"], sim["time"]
|
|
27
|
+
|
|
28
|
+
amp = Amputer(X, time=time, rate=0.2).ampute("MNAR", seed=7)
|
|
29
|
+
ctx = mipy.ImputeContext(patient=patient, time=time,
|
|
30
|
+
schema=mipy.build_variable_schema(amp["X"]))
|
|
31
|
+
for name in ["Mean", "softImpute", "MICE-Long", "MICE-LongMNAR"]:
|
|
32
|
+
out, draws = mipy.run(name, amp["X"], ctx)
|
|
33
|
+
print(name, mipy.evaluate(X, out, amp["mask"], patient=patient))
|
|
34
|
+
```
|
|
35
|
+
|
|
36
|
+
With a data frame (rows = patient-visits):
|
|
37
|
+
|
|
38
|
+
```python
|
|
39
|
+
done = mipy.impute(df, method="MICE-Long", id_col="Patient_ID",
|
|
40
|
+
time_col="sampling_point", log2=True)
|
|
41
|
+
```
|
|
42
|
+
|
|
43
|
+
The notebook `notebooks/getting_started.ipynb` runs these steps with output.
|