memory-graph 0.3.7__tar.gz → 0.3.8__tar.gz
This diff represents the content of publicly available package versions that have been released to one of the supported registries. The information contained in this diff is provided for informational purposes only and reflects changes between package versions as they appear in their respective public registries.
- {memory_graph-0.3.7/memory_graph.egg-info → memory_graph-0.3.8}/PKG-INFO +150 -5
- {memory_graph-0.3.7 → memory_graph-0.3.8}/README.md +149 -4
- memory_graph-0.3.8/TODO.txt +9 -0
- memory_graph-0.3.8/child_to_parent/main.py +334 -0
- memory_graph-0.3.8/images/add_one.png +0 -0
- memory_graph-0.3.8/images/add_one.py +14 -0
- memory_graph-0.3.8/images/avltree.py +39 -0
- memory_graph-0.3.8/images/avltree_base.png +0 -0
- memory_graph-0.3.8/images/avltree_dir.png +0 -0
- memory_graph-0.3.8/images/avltree_fail.png +0 -0
- memory_graph-0.3.8/images/avltree_key_value.png +0 -0
- memory_graph-0.3.8/images/avltree_linear.png +0 -0
- memory_graph-0.3.8/images/avltree_table.png +0 -0
- memory_graph-0.3.8/images/bin_tree.png +0 -0
- memory_graph-0.3.8/images/bin_tree.py +43 -0
- memory_graph-0.3.8/images/copies.png +0 -0
- memory_graph-0.3.8/images/copies.py +11 -0
- memory_graph-0.3.8/images/copy_method.png +0 -0
- memory_graph-0.3.8/images/copy_method.py +18 -0
- memory_graph-0.3.8/images/create_gif.sh +19 -0
- memory_graph-0.3.8/images/create_images.sh +34 -0
- memory_graph-0.3.8/images/debugging.gif +0 -0
- memory_graph-0.3.8/images/debugging.py +15 -0
- memory_graph-0.3.8/images/extension_numpy.png +0 -0
- memory_graph-0.3.8/images/extension_numpy.py +10 -0
- memory_graph-0.3.8/images/extension_pandas.png +0 -0
- memory_graph-0.3.8/images/extension_pandas.py +13 -0
- memory_graph-0.3.8/images/factorial.gif +0 -0
- memory_graph-0.3.8/images/factorial.py +20 -0
- memory_graph-0.3.8/images/hash_set.png +0 -0
- memory_graph-0.3.8/images/hash_set.py +35 -0
- memory_graph-0.3.8/images/highlight.png +0 -0
- memory_graph-0.3.8/images/highlight.py +11 -0
- memory_graph-0.3.8/images/immutable.py +7 -0
- memory_graph-0.3.8/images/immutable1.png +0 -0
- memory_graph-0.3.8/images/immutable2.png +0 -0
- memory_graph-0.3.8/images/jupyter_example.ipynb +85 -0
- memory_graph-0.3.8/images/jupyter_example.png +0 -0
- memory_graph-0.3.8/images/linked_list.png +0 -0
- memory_graph-0.3.8/images/linked_list.py +35 -0
- memory_graph-0.3.8/images/many_types.png +0 -0
- memory_graph-0.3.8/images/many_types.py +9 -0
- memory_graph-0.3.8/images/mutable.py +7 -0
- memory_graph-0.3.8/images/mutable1.png +0 -0
- memory_graph-0.3.8/images/mutable2.png +0 -0
- memory_graph-0.3.8/images/power_set.gif +0 -0
- memory_graph-0.3.8/images/power_set.py +24 -0
- memory_graph-0.3.8/images/uva.png +0 -0
- memory_graph-0.3.8/install.txt +31 -0
- {memory_graph-0.3.7 → memory_graph-0.3.8}/memory_graph/__init__.py +1 -1
- {memory_graph-0.3.7 → memory_graph-0.3.8}/memory_graph/memory_to_nodes.py +1 -1
- {memory_graph-0.3.7 → memory_graph-0.3.8}/memory_graph/sequence.py +1 -1
- {memory_graph-0.3.7 → memory_graph-0.3.8}/memory_graph/utils.py +5 -3
- {memory_graph-0.3.7 → memory_graph-0.3.8/memory_graph.egg-info}/PKG-INFO +150 -5
- memory_graph-0.3.8/memory_graph.egg-info/SOURCES.txt +84 -0
- {memory_graph-0.3.7 → memory_graph-0.3.8}/setup.py +1 -1
- memory_graph-0.3.8/uml/memory_graph.uxf +322 -0
- memory_graph-0.3.7/memory_graph.egg-info/SOURCES.txt +0 -36
- {memory_graph-0.3.7 → memory_graph-0.3.8}/LICENSE.txt +0 -0
- {memory_graph-0.3.7 → memory_graph-0.3.8}/MANIFEST.in +0 -0
- {memory_graph-0.3.7 → memory_graph-0.3.8}/memory_graph/config.py +0 -0
- {memory_graph-0.3.7 → memory_graph-0.3.8}/memory_graph/config_default.py +0 -0
- {memory_graph-0.3.7 → memory_graph-0.3.8}/memory_graph/config_helpers.py +0 -0
- {memory_graph-0.3.7 → memory_graph-0.3.8}/memory_graph/extension_numpy.py +0 -0
- {memory_graph-0.3.7 → memory_graph-0.3.8}/memory_graph/extension_pandas.py +0 -0
- {memory_graph-0.3.7 → memory_graph-0.3.8}/memory_graph/html_table.py +0 -0
- {memory_graph-0.3.7 → memory_graph-0.3.8}/memory_graph/list_view.py +0 -0
- {memory_graph-0.3.7 → memory_graph-0.3.8}/memory_graph/node_base.py +0 -0
- {memory_graph-0.3.7 → memory_graph-0.3.8}/memory_graph/node_key_value.py +0 -0
- {memory_graph-0.3.7 → memory_graph-0.3.8}/memory_graph/node_linear.py +0 -0
- {memory_graph-0.3.7 → memory_graph-0.3.8}/memory_graph/node_table.py +0 -0
- {memory_graph-0.3.7 → memory_graph-0.3.8}/memory_graph/slicer.py +0 -0
- {memory_graph-0.3.7 → memory_graph-0.3.8}/memory_graph/slices.py +0 -0
- {memory_graph-0.3.7 → memory_graph-0.3.8}/memory_graph/slices_iterator.py +0 -0
- {memory_graph-0.3.7 → memory_graph-0.3.8}/memory_graph/slices_table_iterator.py +0 -0
- {memory_graph-0.3.7 → memory_graph-0.3.8}/memory_graph/t.py +0 -0
- {memory_graph-0.3.7 → memory_graph-0.3.8}/memory_graph/test.py +0 -0
- {memory_graph-0.3.7 → memory_graph-0.3.8}/memory_graph/test_memory_graph.py +0 -0
- {memory_graph-0.3.7 → memory_graph-0.3.8}/memory_graph/test_memory_to_nodes.py +0 -0
- {memory_graph-0.3.7 → memory_graph-0.3.8}/memory_graph/test_sequence.py +0 -0
- {memory_graph-0.3.7 → memory_graph-0.3.8}/memory_graph/test_slicer.py +0 -0
- {memory_graph-0.3.7 → memory_graph-0.3.8}/memory_graph/test_slices.py +0 -0
- {memory_graph-0.3.7 → memory_graph-0.3.8}/memory_graph/test_slices_iterator.py +0 -0
- {memory_graph-0.3.7 → memory_graph-0.3.8}/memory_graph.egg-info/dependency_links.txt +0 -0
- {memory_graph-0.3.7 → memory_graph-0.3.8}/memory_graph.egg-info/requires.txt +0 -0
- {memory_graph-0.3.7 → memory_graph-0.3.8}/memory_graph.egg-info/top_level.txt +0 -0
- {memory_graph-0.3.7 → memory_graph-0.3.8}/setup.cfg +0 -0
|
@@ -1,6 +1,6 @@
|
|
|
1
1
|
Metadata-Version: 2.1
|
|
2
2
|
Name: memory_graph
|
|
3
|
-
Version: 0.3.
|
|
3
|
+
Version: 0.3.8
|
|
4
4
|
Summary: Draws a graph of your data to analyze its structure.
|
|
5
5
|
Home-page: https://github.com/bterwijn/memory_graph
|
|
6
6
|
Author: Bas Terwijn
|
|
@@ -68,7 +68,7 @@ identical?: True
|
|
|
68
68
|
A better way to understand what data is shared is to draw a graph of the data using the [memory_graph](https://pypi.org/project/memory-graph/) package.
|
|
69
69
|
|
|
70
70
|
# Memory Graph #
|
|
71
|
-
The [memory_graph](https://pypi.org/project/memory-graph/) package can graph many different data types
|
|
71
|
+
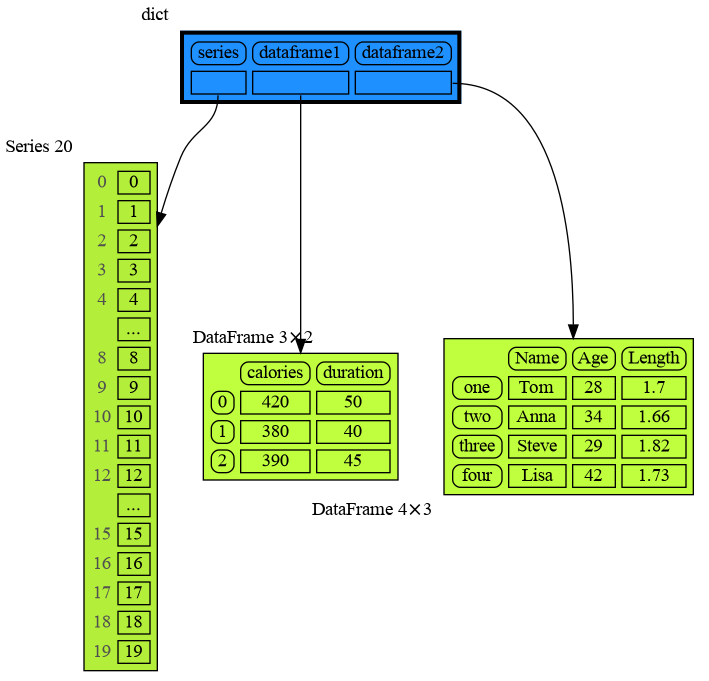
The [memory_graph](https://pypi.org/project/memory-graph/) package can graph many different data types, not limited to:
|
|
72
72
|
|
|
73
73
|
```python
|
|
74
74
|
import memory_graph as mg
|
|
@@ -88,6 +88,7 @@ Instead of showing the graph you can also render it to an output file of your ch
|
|
|
88
88
|
|
|
89
89
|
```python
|
|
90
90
|
mg.render(data, "my_graph.pdf")
|
|
91
|
+
mg.render(data, "my_graph.svg")
|
|
91
92
|
mg.render(data, "my_graph.png")
|
|
92
93
|
mg.render(data, "my_graph.gv") # Graphviz DOT file
|
|
93
94
|
```
|
|
@@ -106,6 +107,8 @@ mg.render(data, "my_graph.gv") # Graphviz DOT file
|
|
|
106
107
|
|
|
107
108
|
[Extensions](#extensions)
|
|
108
109
|
|
|
110
|
+
[Introspection](#introspection)
|
|
111
|
+
|
|
109
112
|
[Jupyter Notebook](#jupyter-notebook)
|
|
110
113
|
|
|
111
114
|
[Troubleshooting](#troubleshooting)
|
|
@@ -337,8 +340,8 @@ To simplify debugging without a debugger tool, we offer these blocking alias fun
|
|
|
337
340
|
|
|
338
341
|
| alias | purpose | function call |
|
|
339
342
|
|:---|:---|:---|
|
|
340
|
-
| `mg.l()` | graph **l**ocal variables | `mg.block(mg.show, locals())` |
|
|
341
|
-
| `mg.s()` | graph the call **s**tack | `mg.block(mg.show, mg.get_call_stack())` |
|
|
343
|
+
| `mg.l()` | graph **l**ocal variables and block | `mg.block(mg.show, locals())` |
|
|
344
|
+
| `mg.s()` | graph the call **s**tack and block | `mg.block(mg.show, mg.get_call_stack())` |
|
|
342
345
|
|
|
343
346
|
For example, executing this program:
|
|
344
347
|
|
|
@@ -564,9 +567,151 @@ mg.show(locals())
|
|
|
564
567
|
```
|
|
565
568
|
|
|
566
569
|
|
|
570
|
+
## Introspection ##
|
|
571
|
+
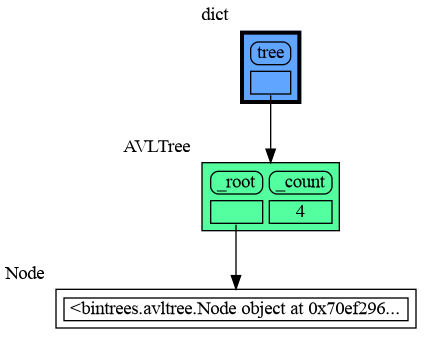
This section is likely to change. Sometimes the introspection fails or is not as desired. For example the `bintrees.avltree.Node` object doesn't show any attributes in the graph below:
|
|
572
|
+
|
|
573
|
+
```python
|
|
574
|
+
import memory_graph as mg
|
|
575
|
+
import bintrees
|
|
576
|
+
|
|
577
|
+
# Create an AVL tree
|
|
578
|
+
tree = bintrees.AVLTree()
|
|
579
|
+
tree.insert(10, "ten")
|
|
580
|
+
tree.insert(5, "five")
|
|
581
|
+
tree.insert(20, "twenty")
|
|
582
|
+
tree.insert(15, "fifteen")
|
|
583
|
+
|
|
584
|
+
mg.show(locals())
|
|
585
|
+
```
|
|
586
|
+
|
|
587
|
+
|
|
588
|
+
|
|
589
|
+
### dir() ###
|
|
590
|
+
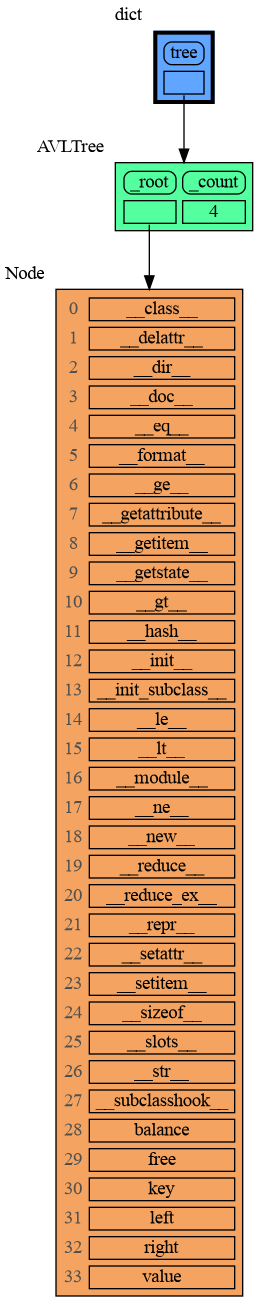
A usefull start is to give it some color, show the list of all its attributes using `dir()`, and setting an empty Slicer to see the attribute list in full.
|
|
591
|
+
|
|
592
|
+
```python
|
|
593
|
+
import memory_graph as mg
|
|
594
|
+
import bintrees
|
|
595
|
+
|
|
596
|
+
# Create an AVL tree
|
|
597
|
+
tree = bintrees.AVLTree()
|
|
598
|
+
tree.insert(10, "ten")
|
|
599
|
+
tree.insert(5, "five")
|
|
600
|
+
tree.insert(20, "twenty")
|
|
601
|
+
tree.insert(15, "fifteen")
|
|
602
|
+
|
|
603
|
+
mg.config.type_to_color[bintrees.avltree.Node] = "sandybrown"
|
|
604
|
+
mg.config.type_to_node[bintrees.avltree.Node] = lambda data: mg.node_linear.Node_Linear(data,
|
|
605
|
+
dir(data))
|
|
606
|
+
mg.config.type_to_slicer[bintrees.avltree.Node] = mg.slicer.Slicer()
|
|
607
|
+
|
|
608
|
+
mg.show(locals())
|
|
609
|
+
```
|
|
610
|
+
|
|
611
|
+
|
|
612
|
+
Next figure out what are the attributes you want to graph and choose a Node type, there are four options.
|
|
613
|
+
|
|
614
|
+
### 1 Node_Base ###
|
|
615
|
+
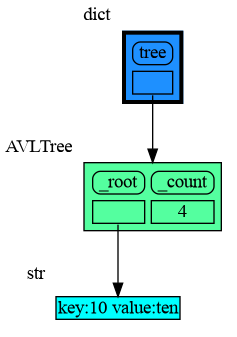
Node_base is a leaf node (with no children) and shows just a single value.
|
|
616
|
+
```python
|
|
617
|
+
import memory_graph as mg
|
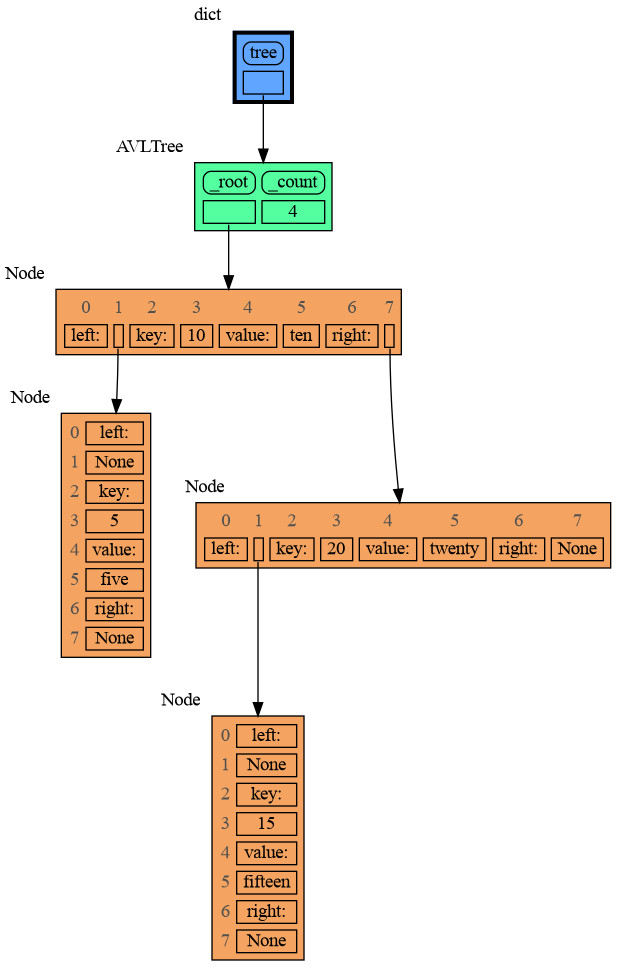
|
618
|
+
import bintrees
|
|
619
|
+
|
|
620
|
+
# Create an AVL tree
|
|
621
|
+
tree = bintrees.AVLTree()
|
|
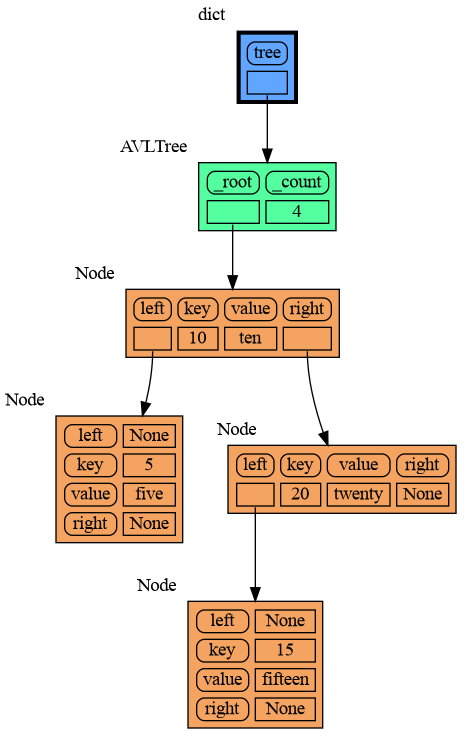
622
|
+
tree.insert(10, "ten")
|
|
623
|
+
tree.insert(5, "five")
|
|
624
|
+
tree.insert(20, "twenty")
|
|
625
|
+
tree.insert(15, "fifteen")
|
|
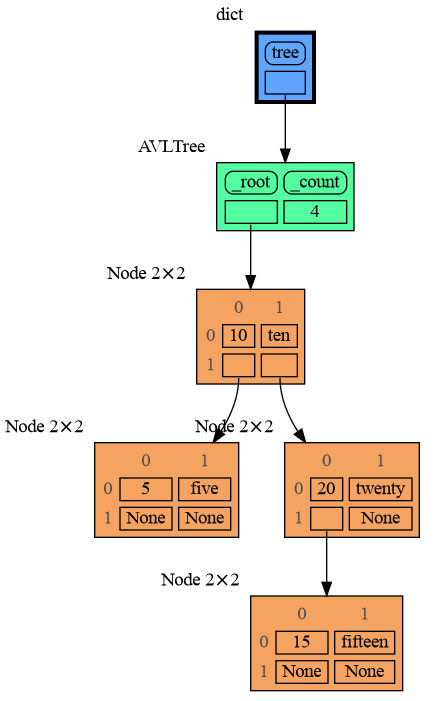
626
|
+
|
|
627
|
+
mg.config.type_to_color[bintrees.avltree.Node] = "sandybrown"
|
|
628
|
+
mg.config.type_to_node[bintrees.avltree.Node] = lambda data: mg.node_base.Node_Base(f"key:{data.key} value:{data.value}")
|
|
629
|
+
|
|
630
|
+
mg.show(locals())
|
|
631
|
+
```
|
|
632
|
+
|
|
633
|
+
|
|
634
|
+
### 2 Node_Linear ###
|
|
635
|
+
Node_Linear shows all the values in a line like a list.
|
|
636
|
+
```python
|
|
637
|
+
import memory_graph as mg
|
|
638
|
+
import bintrees
|
|
639
|
+
|
|
640
|
+
# Create an AVL tree
|
|
641
|
+
tree = bintrees.AVLTree()
|
|
642
|
+
tree.insert(10, "ten")
|
|
643
|
+
tree.insert(5, "five")
|
|
644
|
+
tree.insert(20, "twenty")
|
|
645
|
+
tree.insert(15, "fifteen")
|
|
646
|
+
|
|
647
|
+
mg.config.type_to_color[bintrees.avltree.Node] = "sandybrown"
|
|
648
|
+
mg.config.type_to_node[bintrees.avltree.Node] = lambda data: mg.node_linear.Node_Linear(data,
|
|
649
|
+
['left:', data.left,
|
|
650
|
+
'key:', data.key,
|
|
651
|
+
'value:', data.value,
|
|
652
|
+
'right:', data.right] )
|
|
653
|
+
|
|
654
|
+
mg.show(locals())
|
|
655
|
+
```
|
|
656
|
+
|
|
657
|
+
|
|
658
|
+
### 3 Node_Key_Value ###
|
|
659
|
+
Node_Key_Value shows key-value pairs like a dictionary. Note the required `items()` call at the end.
|
|
660
|
+
```python
|
|
661
|
+
import memory_graph as mg
|
|
662
|
+
import bintrees
|
|
663
|
+
|
|
664
|
+
# Create an AVL tree
|
|
665
|
+
tree = bintrees.AVLTree()
|
|
666
|
+
tree.insert(10, "ten")
|
|
667
|
+
tree.insert(5, "five")
|
|
668
|
+
tree.insert(20, "twenty")
|
|
669
|
+
tree.insert(15, "fifteen")
|
|
670
|
+
|
|
671
|
+
mg.config.type_to_color[bintrees.avltree.Node] = "sandybrown"
|
|
672
|
+
mg.config.type_to_node[bintrees.avltree.Node] = lambda data: mg.node_key_value.Node_Key_Value(data,
|
|
673
|
+
{'left': data.left,
|
|
674
|
+
'key': data.key,
|
|
675
|
+
'value': data.value,
|
|
676
|
+
'right': data.right}.items() )
|
|
677
|
+
|
|
678
|
+
mg.show(locals())
|
|
679
|
+
```
|
|
680
|
+
|
|
681
|
+
|
|
682
|
+
### 4 Node_Table ###
|
|
683
|
+
Node_Table shows all the values as a table.
|
|
684
|
+
```python
|
|
685
|
+
import memory_graph as mg
|
|
686
|
+
import bintrees
|
|
687
|
+
|
|
688
|
+
# Create an AVL tree
|
|
689
|
+
tree = bintrees.AVLTree()
|
|
690
|
+
tree.insert(10, "ten")
|
|
691
|
+
tree.insert(5, "five")
|
|
692
|
+
tree.insert(20, "twenty")
|
|
693
|
+
tree.insert(15, "fifteen")
|
|
694
|
+
|
|
695
|
+
mg.config.type_to_color[bintrees.avltree.Node] = "sandybrown"
|
|
696
|
+
mg.config.type_to_node[bintrees.avltree.Node] = lambda data: mg.node_table.Node_Table(data,
|
|
697
|
+
[[data.key, data.value],
|
|
698
|
+
[data.left, data.right]] )
|
|
699
|
+
|
|
700
|
+
|
|
701
|
+
mg.show(locals())
|
|
702
|
+
```
|
|
703
|
+
|
|
704
|
+
|
|
705
|
+
|
|
567
706
|
## Jupyter Notebook ##
|
|
707
|
+
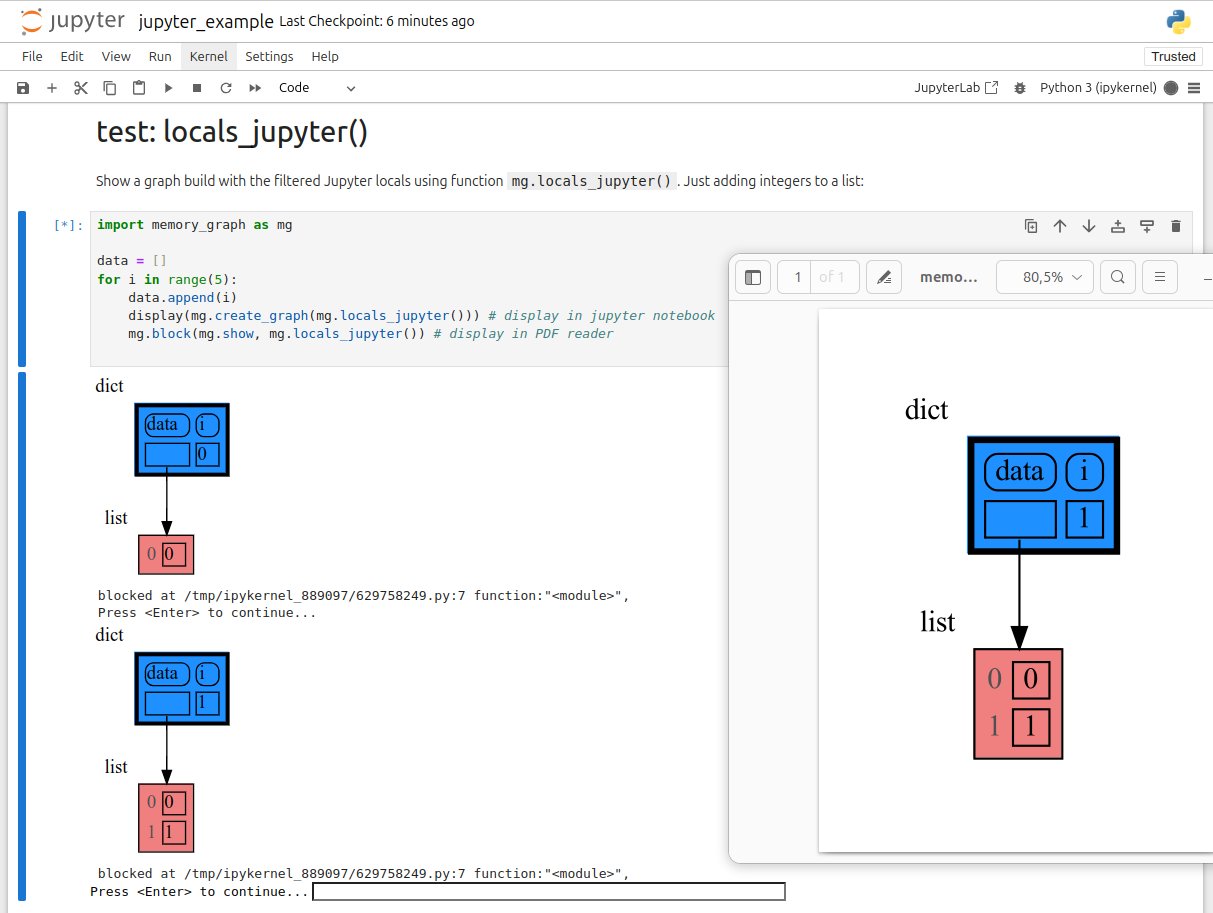
In Jupyter Notebook `locals()` has additional variables that cause problems in the graph, use `mg.locals_jupyter()` to get the local variables with these problematic variables filtered out. Use `mg.get_call_stack_jupyter()` to get the whole call stack with these variables filtered out.
|
|
568
708
|
|
|
569
|
-
|
|
709
|
+
We can use `mg.show()` and `mg.render()` in a Jupyter Notebook, but alternatively we can also use `mg.create_graph()` to create a graph and the `display()` function to render it inline with for example:
|
|
710
|
+
|
|
711
|
+
```python
|
|
712
|
+
display( mg.create_graph(mg.locals_jupyter()) ) # display the local variables inline
|
|
713
|
+
mg.block(display, mg.create_graph(mg.locals_jupyter()) ) # the same but blocked
|
|
714
|
+
```
|
|
570
715
|
|
|
571
716
|
See for example [jupyter_example.ipynb](https://raw.githubusercontent.com/bterwijn/memory_graph/main/images/jupyter_example.ipynb).
|
|
572
717
|
|
|
@@ -49,7 +49,7 @@ identical?: True
|
|
|
49
49
|
A better way to understand what data is shared is to draw a graph of the data using the [memory_graph](https://pypi.org/project/memory-graph/) package.
|
|
50
50
|
|
|
51
51
|
# Memory Graph #
|
|
52
|
-
The [memory_graph](https://pypi.org/project/memory-graph/) package can graph many different data types
|
|
52
|
+
The [memory_graph](https://pypi.org/project/memory-graph/) package can graph many different data types, not limited to:
|
|
53
53
|
|
|
54
54
|
```python
|
|
55
55
|
import memory_graph as mg
|
|
@@ -69,6 +69,7 @@ Instead of showing the graph you can also render it to an output file of your ch
|
|
|
69
69
|
|
|
70
70
|
```python
|
|
71
71
|
mg.render(data, "my_graph.pdf")
|
|
72
|
+
mg.render(data, "my_graph.svg")
|
|
72
73
|
mg.render(data, "my_graph.png")
|
|
73
74
|
mg.render(data, "my_graph.gv") # Graphviz DOT file
|
|
74
75
|
```
|
|
@@ -87,6 +88,8 @@ mg.render(data, "my_graph.gv") # Graphviz DOT file
|
|
|
87
88
|
|
|
88
89
|
[Extensions](#extensions)
|
|
89
90
|
|
|
91
|
+
[Introspection](#introspection)
|
|
92
|
+
|
|
90
93
|
[Jupyter Notebook](#jupyter-notebook)
|
|
91
94
|
|
|
92
95
|
[Troubleshooting](#troubleshooting)
|
|
@@ -318,8 +321,8 @@ To simplify debugging without a debugger tool, we offer these blocking alias fun
|
|
|
318
321
|
|
|
319
322
|
| alias | purpose | function call |
|
|
320
323
|
|:---|:---|:---|
|
|
321
|
-
| `mg.l()` | graph **l**ocal variables | `mg.block(mg.show, locals())` |
|
|
322
|
-
| `mg.s()` | graph the call **s**tack | `mg.block(mg.show, mg.get_call_stack())` |
|
|
324
|
+
| `mg.l()` | graph **l**ocal variables and block | `mg.block(mg.show, locals())` |
|
|
325
|
+
| `mg.s()` | graph the call **s**tack and block | `mg.block(mg.show, mg.get_call_stack())` |
|
|
323
326
|
|
|
324
327
|
For example, executing this program:
|
|
325
328
|
|
|
@@ -545,9 +548,151 @@ mg.show(locals())
|
|
|
545
548
|
```
|
|
546
549
|

|
|
547
550
|
|
|
551
|
+
## Introspection ##
|
|
552
|
+
This section is likely to change. Sometimes the introspection fails or is not as desired. For example the `bintrees.avltree.Node` object doesn't show any attributes in the graph below:
|
|
553
|
+
|
|
554
|
+
```python
|
|
555
|
+
import memory_graph as mg
|
|
556
|
+
import bintrees
|
|
557
|
+
|
|
558
|
+
# Create an AVL tree
|
|
559
|
+
tree = bintrees.AVLTree()
|
|
560
|
+
tree.insert(10, "ten")
|
|
561
|
+
tree.insert(5, "five")
|
|
562
|
+
tree.insert(20, "twenty")
|
|
563
|
+
tree.insert(15, "fifteen")
|
|
564
|
+
|
|
565
|
+
mg.show(locals())
|
|
566
|
+
```
|
|
567
|
+

|
|
568
|
+
|
|
569
|
+
|
|
570
|
+
### dir() ###
|
|
571
|
+
A usefull start is to give it some color, show the list of all its attributes using `dir()`, and setting an empty Slicer to see the attribute list in full.
|
|
572
|
+
|
|
573
|
+
```python
|
|
574
|
+
import memory_graph as mg
|
|
575
|
+
import bintrees
|
|
576
|
+
|
|
577
|
+
# Create an AVL tree
|
|
578
|
+
tree = bintrees.AVLTree()
|
|
579
|
+
tree.insert(10, "ten")
|
|
580
|
+
tree.insert(5, "five")
|
|
581
|
+
tree.insert(20, "twenty")
|
|
582
|
+
tree.insert(15, "fifteen")
|
|
583
|
+
|
|
584
|
+
mg.config.type_to_color[bintrees.avltree.Node] = "sandybrown"
|
|
585
|
+
mg.config.type_to_node[bintrees.avltree.Node] = lambda data: mg.node_linear.Node_Linear(data,
|
|
586
|
+
dir(data))
|
|
587
|
+
mg.config.type_to_slicer[bintrees.avltree.Node] = mg.slicer.Slicer()
|
|
588
|
+
|
|
589
|
+
mg.show(locals())
|
|
590
|
+
```
|
|
591
|
+

|
|
592
|
+
|
|
593
|
+
Next figure out what are the attributes you want to graph and choose a Node type, there are four options.
|
|
594
|
+
|
|
595
|
+
### 1 Node_Base ###
|
|
596
|
+
Node_base is a leaf node (with no children) and shows just a single value.
|
|
597
|
+
```python
|
|
598
|
+
import memory_graph as mg
|
|
599
|
+
import bintrees
|
|
600
|
+
|
|
601
|
+
# Create an AVL tree
|
|
602
|
+
tree = bintrees.AVLTree()
|
|
603
|
+
tree.insert(10, "ten")
|
|
604
|
+
tree.insert(5, "five")
|
|
605
|
+
tree.insert(20, "twenty")
|
|
606
|
+
tree.insert(15, "fifteen")
|
|
607
|
+
|
|
608
|
+
mg.config.type_to_color[bintrees.avltree.Node] = "sandybrown"
|
|
609
|
+
mg.config.type_to_node[bintrees.avltree.Node] = lambda data: mg.node_base.Node_Base(f"key:{data.key} value:{data.value}")
|
|
610
|
+
|
|
611
|
+
mg.show(locals())
|
|
612
|
+
```
|
|
613
|
+

|
|
614
|
+
|
|
615
|
+
### 2 Node_Linear ###
|
|
616
|
+
Node_Linear shows all the values in a line like a list.
|
|
617
|
+
```python
|
|
618
|
+
import memory_graph as mg
|
|
619
|
+
import bintrees
|
|
620
|
+
|
|
621
|
+
# Create an AVL tree
|
|
622
|
+
tree = bintrees.AVLTree()
|
|
623
|
+
tree.insert(10, "ten")
|
|
624
|
+
tree.insert(5, "five")
|
|
625
|
+
tree.insert(20, "twenty")
|
|
626
|
+
tree.insert(15, "fifteen")
|
|
627
|
+
|
|
628
|
+
mg.config.type_to_color[bintrees.avltree.Node] = "sandybrown"
|
|
629
|
+
mg.config.type_to_node[bintrees.avltree.Node] = lambda data: mg.node_linear.Node_Linear(data,
|
|
630
|
+
['left:', data.left,
|
|
631
|
+
'key:', data.key,
|
|
632
|
+
'value:', data.value,
|
|
633
|
+
'right:', data.right] )
|
|
634
|
+
|
|
635
|
+
mg.show(locals())
|
|
636
|
+
```
|
|
637
|
+

|
|
638
|
+
|
|
639
|
+
### 3 Node_Key_Value ###
|
|
640
|
+
Node_Key_Value shows key-value pairs like a dictionary. Note the required `items()` call at the end.
|
|
641
|
+
```python
|
|
642
|
+
import memory_graph as mg
|
|
643
|
+
import bintrees
|
|
644
|
+
|
|
645
|
+
# Create an AVL tree
|
|
646
|
+
tree = bintrees.AVLTree()
|
|
647
|
+
tree.insert(10, "ten")
|
|
648
|
+
tree.insert(5, "five")
|
|
649
|
+
tree.insert(20, "twenty")
|
|
650
|
+
tree.insert(15, "fifteen")
|
|
651
|
+
|
|
652
|
+
mg.config.type_to_color[bintrees.avltree.Node] = "sandybrown"
|
|
653
|
+
mg.config.type_to_node[bintrees.avltree.Node] = lambda data: mg.node_key_value.Node_Key_Value(data,
|
|
654
|
+
{'left': data.left,
|
|
655
|
+
'key': data.key,
|
|
656
|
+
'value': data.value,
|
|
657
|
+
'right': data.right}.items() )
|
|
658
|
+
|
|
659
|
+
mg.show(locals())
|
|
660
|
+
```
|
|
661
|
+

|
|
662
|
+
|
|
663
|
+
### 4 Node_Table ###
|
|
664
|
+
Node_Table shows all the values as a table.
|
|
665
|
+
```python
|
|
666
|
+
import memory_graph as mg
|
|
667
|
+
import bintrees
|
|
668
|
+
|
|
669
|
+
# Create an AVL tree
|
|
670
|
+
tree = bintrees.AVLTree()
|
|
671
|
+
tree.insert(10, "ten")
|
|
672
|
+
tree.insert(5, "five")
|
|
673
|
+
tree.insert(20, "twenty")
|
|
674
|
+
tree.insert(15, "fifteen")
|
|
675
|
+
|
|
676
|
+
mg.config.type_to_color[bintrees.avltree.Node] = "sandybrown"
|
|
677
|
+
mg.config.type_to_node[bintrees.avltree.Node] = lambda data: mg.node_table.Node_Table(data,
|
|
678
|
+
[[data.key, data.value],
|
|
679
|
+
[data.left, data.right]] )
|
|
680
|
+
|
|
681
|
+
|
|
682
|
+
mg.show(locals())
|
|
683
|
+
```
|
|
684
|
+

|
|
685
|
+
|
|
686
|
+
|
|
548
687
|
## Jupyter Notebook ##
|
|
688
|
+
In Jupyter Notebook `locals()` has additional variables that cause problems in the graph, use `mg.locals_jupyter()` to get the local variables with these problematic variables filtered out. Use `mg.get_call_stack_jupyter()` to get the whole call stack with these variables filtered out.
|
|
549
689
|
|
|
550
|
-
|
|
690
|
+
We can use `mg.show()` and `mg.render()` in a Jupyter Notebook, but alternatively we can also use `mg.create_graph()` to create a graph and the `display()` function to render it inline with for example:
|
|
691
|
+
|
|
692
|
+
```python
|
|
693
|
+
display( mg.create_graph(mg.locals_jupyter()) ) # display the local variables inline
|
|
694
|
+
mg.block(display, mg.create_graph(mg.locals_jupyter()) ) # the same but blocked
|
|
695
|
+
```
|
|
551
696
|
|
|
552
697
|
See for example [jupyter_example.ipynb](https://raw.githubusercontent.com/bterwijn/memory_graph/main/images/jupyter_example.ipynb).
|
|
553
698
|

|
|
@@ -0,0 +1,9 @@
|
|
|
1
|
+
|
|
2
|
+
mg.block(fun, print_loc=True), update docs, stack-overflow posts
|
|
3
|
+
|
|
4
|
+
Jupyter Notebook inline render using display()
|
|
5
|
+
|
|
6
|
+
webassembly inline render
|
|
7
|
+
|
|
8
|
+
optional max introspect depth for each type/id
|
|
9
|
+
https://discuss.python.org/t/request-for-feedback-memory-graph-a-python-visualization-tool-for-education/78347
|