memory-graph 0.3.6__tar.gz → 0.3.8__tar.gz
This diff represents the content of publicly available package versions that have been released to one of the supported registries. The information contained in this diff is provided for informational purposes only and reflects changes between package versions as they appear in their respective public registries.
- {memory_graph-0.3.6/memory_graph.egg-info → memory_graph-0.3.8}/PKG-INFO +185 -57
- {memory_graph-0.3.6 → memory_graph-0.3.8}/README.md +184 -56
- memory_graph-0.3.8/TODO.txt +9 -0
- memory_graph-0.3.8/child_to_parent/main.py +334 -0
- memory_graph-0.3.8/images/add_one.png +0 -0
- memory_graph-0.3.8/images/add_one.py +14 -0
- memory_graph-0.3.8/images/avltree.py +39 -0
- memory_graph-0.3.8/images/avltree_base.png +0 -0
- memory_graph-0.3.8/images/avltree_dir.png +0 -0
- memory_graph-0.3.8/images/avltree_fail.png +0 -0
- memory_graph-0.3.8/images/avltree_key_value.png +0 -0
- memory_graph-0.3.8/images/avltree_linear.png +0 -0
- memory_graph-0.3.8/images/avltree_table.png +0 -0
- memory_graph-0.3.8/images/bin_tree.png +0 -0
- memory_graph-0.3.8/images/bin_tree.py +43 -0
- memory_graph-0.3.8/images/copies.png +0 -0
- memory_graph-0.3.8/images/copies.py +11 -0
- memory_graph-0.3.8/images/copy_method.png +0 -0
- memory_graph-0.3.8/images/copy_method.py +18 -0
- memory_graph-0.3.8/images/create_gif.sh +19 -0
- memory_graph-0.3.8/images/create_images.sh +34 -0
- memory_graph-0.3.8/images/debugging.gif +0 -0
- memory_graph-0.3.8/images/debugging.py +15 -0
- memory_graph-0.3.8/images/extension_numpy.png +0 -0
- memory_graph-0.3.8/images/extension_numpy.py +10 -0
- memory_graph-0.3.8/images/extension_pandas.png +0 -0
- memory_graph-0.3.8/images/extension_pandas.py +13 -0
- memory_graph-0.3.8/images/factorial.gif +0 -0
- memory_graph-0.3.8/images/factorial.py +20 -0
- memory_graph-0.3.8/images/hash_set.png +0 -0
- memory_graph-0.3.8/images/hash_set.py +35 -0
- memory_graph-0.3.8/images/highlight.png +0 -0
- memory_graph-0.3.8/images/highlight.py +11 -0
- memory_graph-0.3.8/images/immutable.py +7 -0
- memory_graph-0.3.8/images/immutable1.png +0 -0
- memory_graph-0.3.8/images/immutable2.png +0 -0
- memory_graph-0.3.8/images/jupyter_example.ipynb +85 -0
- memory_graph-0.3.8/images/jupyter_example.png +0 -0
- memory_graph-0.3.8/images/linked_list.png +0 -0
- memory_graph-0.3.8/images/linked_list.py +35 -0
- memory_graph-0.3.8/images/many_types.png +0 -0
- memory_graph-0.3.8/images/many_types.py +9 -0
- memory_graph-0.3.8/images/mutable.py +7 -0
- memory_graph-0.3.8/images/mutable1.png +0 -0
- memory_graph-0.3.8/images/mutable2.png +0 -0
- memory_graph-0.3.8/images/power_set.gif +0 -0
- memory_graph-0.3.8/images/power_set.py +24 -0
- memory_graph-0.3.8/images/uva.png +0 -0
- memory_graph-0.3.8/install.txt +31 -0
- {memory_graph-0.3.6 → memory_graph-0.3.8}/memory_graph/__init__.py +47 -69
- {memory_graph-0.3.6 → memory_graph-0.3.8}/memory_graph/memory_to_nodes.py +1 -1
- {memory_graph-0.3.6 → memory_graph-0.3.8}/memory_graph/sequence.py +1 -1
- {memory_graph-0.3.6 → memory_graph-0.3.8}/memory_graph/utils.py +5 -3
- {memory_graph-0.3.6 → memory_graph-0.3.8/memory_graph.egg-info}/PKG-INFO +185 -57
- memory_graph-0.3.8/memory_graph.egg-info/SOURCES.txt +84 -0
- {memory_graph-0.3.6 → memory_graph-0.3.8}/setup.py +1 -1
- memory_graph-0.3.8/uml/memory_graph.uxf +322 -0
- memory_graph-0.3.6/memory_graph.egg-info/SOURCES.txt +0 -36
- {memory_graph-0.3.6 → memory_graph-0.3.8}/LICENSE.txt +0 -0
- {memory_graph-0.3.6 → memory_graph-0.3.8}/MANIFEST.in +0 -0
- {memory_graph-0.3.6 → memory_graph-0.3.8}/memory_graph/config.py +0 -0
- {memory_graph-0.3.6 → memory_graph-0.3.8}/memory_graph/config_default.py +0 -0
- {memory_graph-0.3.6 → memory_graph-0.3.8}/memory_graph/config_helpers.py +0 -0
- {memory_graph-0.3.6 → memory_graph-0.3.8}/memory_graph/extension_numpy.py +0 -0
- {memory_graph-0.3.6 → memory_graph-0.3.8}/memory_graph/extension_pandas.py +0 -0
- {memory_graph-0.3.6 → memory_graph-0.3.8}/memory_graph/html_table.py +0 -0
- {memory_graph-0.3.6 → memory_graph-0.3.8}/memory_graph/list_view.py +0 -0
- {memory_graph-0.3.6 → memory_graph-0.3.8}/memory_graph/node_base.py +0 -0
- {memory_graph-0.3.6 → memory_graph-0.3.8}/memory_graph/node_key_value.py +0 -0
- {memory_graph-0.3.6 → memory_graph-0.3.8}/memory_graph/node_linear.py +0 -0
- {memory_graph-0.3.6 → memory_graph-0.3.8}/memory_graph/node_table.py +0 -0
- {memory_graph-0.3.6 → memory_graph-0.3.8}/memory_graph/slicer.py +0 -0
- {memory_graph-0.3.6 → memory_graph-0.3.8}/memory_graph/slices.py +0 -0
- {memory_graph-0.3.6 → memory_graph-0.3.8}/memory_graph/slices_iterator.py +0 -0
- {memory_graph-0.3.6 → memory_graph-0.3.8}/memory_graph/slices_table_iterator.py +0 -0
- {memory_graph-0.3.6 → memory_graph-0.3.8}/memory_graph/t.py +0 -0
- {memory_graph-0.3.6 → memory_graph-0.3.8}/memory_graph/test.py +0 -0
- {memory_graph-0.3.6 → memory_graph-0.3.8}/memory_graph/test_memory_graph.py +0 -0
- {memory_graph-0.3.6 → memory_graph-0.3.8}/memory_graph/test_memory_to_nodes.py +0 -0
- {memory_graph-0.3.6 → memory_graph-0.3.8}/memory_graph/test_sequence.py +0 -0
- {memory_graph-0.3.6 → memory_graph-0.3.8}/memory_graph/test_slicer.py +0 -0
- {memory_graph-0.3.6 → memory_graph-0.3.8}/memory_graph/test_slices.py +0 -0
- {memory_graph-0.3.6 → memory_graph-0.3.8}/memory_graph/test_slices_iterator.py +0 -0
- {memory_graph-0.3.6 → memory_graph-0.3.8}/memory_graph.egg-info/dependency_links.txt +0 -0
- {memory_graph-0.3.6 → memory_graph-0.3.8}/memory_graph.egg-info/requires.txt +0 -0
- {memory_graph-0.3.6 → memory_graph-0.3.8}/memory_graph.egg-info/top_level.txt +0 -0
- {memory_graph-0.3.6 → memory_graph-0.3.8}/setup.cfg +0 -0
|
@@ -1,6 +1,6 @@
|
|
|
1
1
|
Metadata-Version: 2.1
|
|
2
2
|
Name: memory_graph
|
|
3
|
-
Version: 0.3.
|
|
3
|
+
Version: 0.3.8
|
|
4
4
|
Summary: Draws a graph of your data to analyze its structure.
|
|
5
5
|
Home-page: https://github.com/bterwijn/memory_graph
|
|
6
6
|
Author: Bas Terwijn
|
|
@@ -68,7 +68,7 @@ identical?: True
|
|
|
68
68
|
A better way to understand what data is shared is to draw a graph of the data using the [memory_graph](https://pypi.org/project/memory-graph/) package.
|
|
69
69
|
|
|
70
70
|
# Memory Graph #
|
|
71
|
-
The [memory_graph](https://pypi.org/project/memory-graph/) package can graph many different data types
|
|
71
|
+
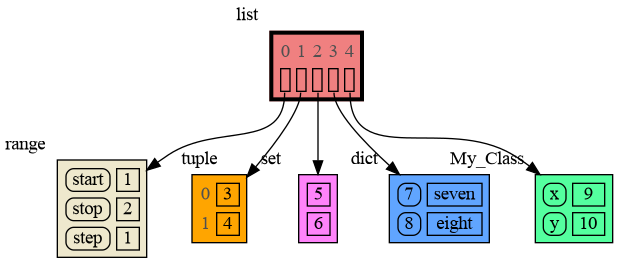
The [memory_graph](https://pypi.org/project/memory-graph/) package can graph many different data types, not limited to:
|
|
72
72
|
|
|
73
73
|
```python
|
|
74
74
|
import memory_graph as mg
|
|
@@ -80,14 +80,15 @@ class MyClass:
|
|
|
80
80
|
self.y = y
|
|
81
81
|
|
|
82
82
|
data = [ range(1, 2), (3, 4), {5, 6}, {7:'seven', 8:'eight'}, MyClass(9, 10) ]
|
|
83
|
-
mg.show(data
|
|
83
|
+
mg.show(data)
|
|
84
84
|
```
|
|
85
85
|
|
|
86
86
|
|
|
87
|
-
|
|
87
|
+
Instead of showing the graph you can also render it to an output file of your choosing (see [Graphviz Output Formats](https://graphviz.org/docs/outputs/)) using for example:
|
|
88
88
|
|
|
89
89
|
```python
|
|
90
90
|
mg.render(data, "my_graph.pdf")
|
|
91
|
+
mg.render(data, "my_graph.svg")
|
|
91
92
|
mg.render(data, "my_graph.png")
|
|
92
93
|
mg.render(data, "my_graph.gv") # Graphviz DOT file
|
|
93
94
|
```
|
|
@@ -106,6 +107,8 @@ mg.render(data, "my_graph.gv") # Graphviz DOT file
|
|
|
106
107
|
|
|
107
108
|
[Extensions](#extensions)
|
|
108
109
|
|
|
110
|
+
[Introspection](#introspection)
|
|
111
|
+
|
|
109
112
|
[Jupyter Notebook](#jupyter-notebook)
|
|
110
113
|
|
|
111
114
|
[Troubleshooting](#troubleshooting)
|
|
@@ -190,7 +193,7 @@ mg.show(locals())
|
|
|
190
193
|
|
|
191
194
|
|
|
192
195
|
### Custom Copy Method ###
|
|
193
|
-
We can write our own custom copy function or method in case the three "copy" options don't do what we want. For example the copy() method of My_Class
|
|
196
|
+
We can write our own custom copy function or method in case the three "copy" options don't do what we want. For example, in the code below the copy() method of My_Class copies the `digits` but shares the `letters` between two objects.
|
|
194
197
|
|
|
195
198
|
```python
|
|
196
199
|
import memory_graph as mg
|
|
@@ -216,7 +219,7 @@ mg.show(locals())
|
|
|
216
219
|
|
|
217
220
|
|
|
218
221
|
## Call Stack ##
|
|
219
|
-
The
|
|
222
|
+
The `mg.get_call_stack()` function retrieves the entire call stack, including the local variables for each function on the stack. This enables us to visualize the local variables across all active functions simultaneously. Then by examining the graph, we can determine whether any local variables from different functions on the call stack share data. For instance, consider the function `add_one()` which adds the value `1` to each of its parameters, `a`, `b`, and `c`.
|
|
220
223
|
|
|
221
224
|
```python
|
|
222
225
|
import memory_graph as mg
|
|
@@ -243,9 +246,17 @@ a:[4, 3, 2, 1] b:(4, 3, 2) c:[4, 3, 2]
|
|
|
243
246
|
|
|
244
247
|
This is because `b` is of immutable type 'tuple' so its value gets copied automatically when it is changed. And because the function is called with a copy of `c`, its original value is not changed by the function. The value of variable `a` is the only value of mutable type that is shared between the root stack frame **'0: \<module>'** and the **'1: add_one'** stack frame of the function so only that variable is affected as a result of the function call. The other changes remain confined to the local variables of the ```add_one()``` function.
|
|
245
248
|
|
|
249
|
+
### Block ###
|
|
250
|
+
It is often helpful to temporarily block program execution to inspect the graph. For this, you can use the `mg.block()` function:
|
|
251
|
+
|
|
252
|
+
```python
|
|
253
|
+
mg.block(fun, arg1, arg2, ..., loc=True)
|
|
254
|
+
```
|
|
255
|
+
|
|
256
|
+
This function first executes `fun(arg1, arg2, ...)`, then prints the current source location in the program, and blocks execution until the <Enter> key is pressed. To skip printing the source location, set `loc=False`.
|
|
246
257
|
|
|
247
258
|
### Recursion ###
|
|
248
|
-
The call stack
|
|
259
|
+
The call stack is also helpful to visualize how recursion works. Here we use `mg.block()` to show each step of how recursively ```factorial(3)``` is computed:
|
|
249
260
|
|
|
250
261
|
```python
|
|
251
262
|
import memory_graph as mg
|
|
@@ -253,28 +264,26 @@ import memory_graph as mg
|
|
|
253
264
|
def factorial(n):
|
|
254
265
|
if n==0:
|
|
255
266
|
return 1
|
|
256
|
-
mg.show
|
|
267
|
+
mg.block(mg.show, mg.get_call_stack())
|
|
257
268
|
result = n * factorial(n-1)
|
|
258
|
-
mg.show
|
|
269
|
+
mg.block(mg.show, mg.get_call_stack())
|
|
259
270
|
return result
|
|
260
271
|
|
|
261
272
|
print(factorial(3))
|
|
262
273
|
```
|
|
263
274
|
|
|
264
|
-
Execution results in:
|
|
265
|
-
|
|
266
275
|
|
|
267
276
|
|
|
268
277
|
and the result is: 1 x 2 x 3 = 6
|
|
269
278
|
|
|
270
279
|
### Power Set ###
|
|
271
|
-
A more
|
|
280
|
+
A more interesting recursive example that shows sharing of data is power_set(). A power set is the set of all subsets of a collection of values.
|
|
272
281
|
|
|
273
282
|
```python
|
|
274
283
|
import memory_graph as mg
|
|
275
284
|
|
|
276
285
|
def get_subsets(subsets, data, i, subset):
|
|
277
|
-
mg.
|
|
286
|
+
mg.block(mg.show, mg.get_call_stack())
|
|
278
287
|
if i == len(data):
|
|
279
288
|
subsets.append(subset.copy())
|
|
280
289
|
return
|
|
@@ -282,7 +291,7 @@ def get_subsets(subsets, data, i, subset):
|
|
|
282
291
|
get_subsets(subsets, data, i+1, subset) # do include data[i]
|
|
283
292
|
subset.pop()
|
|
284
293
|
get_subsets(subsets, data, i+1, subset) # don't include data[i]
|
|
285
|
-
mg.
|
|
294
|
+
mg.block(mg.show, mg.get_call_stack())
|
|
286
295
|
|
|
287
296
|
def power_set(data):
|
|
288
297
|
subsets = []
|
|
@@ -292,8 +301,6 @@ def power_set(data):
|
|
|
292
301
|
print( power_set(['a', 'b', 'c']) )
|
|
293
302
|
```
|
|
294
303
|
|
|
295
|
-
Execution results in:
|
|
296
|
-
|
|
297
304
|
|
|
298
305
|
```
|
|
299
306
|
[['a', 'b', 'c'], ['a', 'b'], ['a', 'c'], ['a'], ['b', 'c'], ['b'], ['c'], []]
|
|
@@ -329,49 +336,28 @@ mg.get_call_stack_after_up_to(after_function, up_to_function="<module>")
|
|
|
329
336
|
|
|
330
337
|
### Debugging without Debugger Tool ###
|
|
331
338
|
|
|
332
|
-
To
|
|
333
|
-
|
|
334
|
-
| alias | function|
|
|
335
|
-
|:---|:---|
|
|
336
|
-
| `d()` | `mg.show(locals(), block=True)` |
|
|
337
|
-
| `ds()` | `mg.show(mg.get_call_stack(), block=True)` |
|
|
338
|
-
|
|
339
|
-
These functions have the following default arguments:
|
|
340
|
-
```python
|
|
341
|
-
def d(data=None, graph=True, log=False, block=True):
|
|
342
|
-
```
|
|
343
|
-
- data: defaults to locals() and mg.get_call_stack() respectively
|
|
344
|
-
- graph: if True the data is visualized as a graph
|
|
345
|
-
- log: if True the data is printed
|
|
346
|
-
- block: if True the function blocks until the <Enter> key is pressed
|
|
339
|
+
To simplify debugging without a debugger tool, we offer these blocking alias functions that you can insert into your code at a specific point to visualize a graph:
|
|
347
340
|
|
|
348
|
-
|
|
349
|
-
|
|
350
|
-
mg.
|
|
351
|
-
|
|
341
|
+
| alias | purpose | function call |
|
|
342
|
+
|:---|:---|:---|
|
|
343
|
+
| `mg.l()` | graph **l**ocal variables and block | `mg.block(mg.show, locals())` |
|
|
344
|
+
| `mg.s()` | graph the call **s**tack and block | `mg.block(mg.show, mg.get_call_stack())` |
|
|
352
345
|
|
|
353
346
|
For example, executing this program:
|
|
354
347
|
|
|
355
348
|
```python
|
|
356
|
-
|
|
357
|
-
from memory_graph import d, ds
|
|
349
|
+
from memory_graph as mg
|
|
358
350
|
|
|
359
351
|
squares = []
|
|
360
352
|
squares_collector = []
|
|
361
353
|
for i in range(1, 6):
|
|
362
354
|
squares.append(i**2)
|
|
363
355
|
squares_collector.append(squares.copy())
|
|
364
|
-
|
|
356
|
+
mg.l() # graph local variables
|
|
365
357
|
```
|
|
366
|
-
and pressing <Enter> a number of times,
|
|
358
|
+
and pressing <Enter> a number of times, results in:
|
|
367
359
|
|
|
368
360
|
|
|
369
|
-
```
|
|
370
|
-
squares: [1, 4, 9, 16, 25]
|
|
371
|
-
squares_collector: [[1], [1, 4], [1, 4, 9], [1, 4, 9, 16], [1, 4, 9, 16, 25]]
|
|
372
|
-
i: 5
|
|
373
|
-
```
|
|
374
|
-
|
|
375
361
|
|
|
376
362
|
## Datastructure Examples ##
|
|
377
363
|
Module memory_graph can be very useful in a course about datastructures, some examples:
|
|
@@ -404,7 +390,7 @@ class LinkedList:
|
|
|
404
390
|
new_node.next = self.head
|
|
405
391
|
self.head.prev = new_node
|
|
406
392
|
self.head = new_node
|
|
407
|
-
mg.show
|
|
393
|
+
mg.block(mg.show, locals()) # <--- draw graph
|
|
408
394
|
|
|
409
395
|
linked_list = LinkedList()
|
|
410
396
|
n = 100
|
|
@@ -443,7 +429,7 @@ class BinTree:
|
|
|
443
429
|
node.larger = Node(new_value)
|
|
444
430
|
else:
|
|
445
431
|
self.add_recursive(new_value, node.larger)
|
|
446
|
-
mg.show
|
|
432
|
+
mg.block(mg.show, locals()) # <--- draw graph
|
|
447
433
|
|
|
448
434
|
def add(self, value):
|
|
449
435
|
if self.root is None:
|
|
@@ -476,7 +462,7 @@ class HashSet:
|
|
|
476
462
|
self.buckets[index] = []
|
|
477
463
|
bucket = self.buckets[index]
|
|
478
464
|
bucket.append(value)
|
|
479
|
-
mg.show
|
|
465
|
+
mg.block(mg.show, locals()) # <--- draw graph
|
|
480
466
|
|
|
481
467
|
def contains(self, value):
|
|
482
468
|
index = hash(value) % len(self.buckets)
|
|
@@ -499,10 +485,10 @@ for i in range(n):
|
|
|
499
485
|
|
|
500
486
|
|
|
501
487
|
## Configuration ##
|
|
502
|
-
Different aspects of memory_graph can be configured. The default configuration is reset by importing '
|
|
488
|
+
Different aspects of memory_graph can be configured. The default configuration is reset by importing 'memory_graph.config_default'.
|
|
503
489
|
|
|
504
|
-
- ***mg.config.
|
|
505
|
-
- The maxium
|
|
490
|
+
- ***mg.config.max_tree_depth*** : int
|
|
491
|
+
- The maxium depth of the graph. A `★` symbol indictes where the graph is cut short.
|
|
506
492
|
|
|
507
493
|
- ***mg.config.max_string_length*** : int
|
|
508
494
|
- The maximum length of strings shown in the graph. Longer strings will be truncated.
|
|
@@ -547,7 +533,7 @@ mg.show( locals(),
|
|
|
547
533
|
Different extensions are available for types from other Python packages.
|
|
548
534
|
|
|
549
535
|
### Numpy ###
|
|
550
|
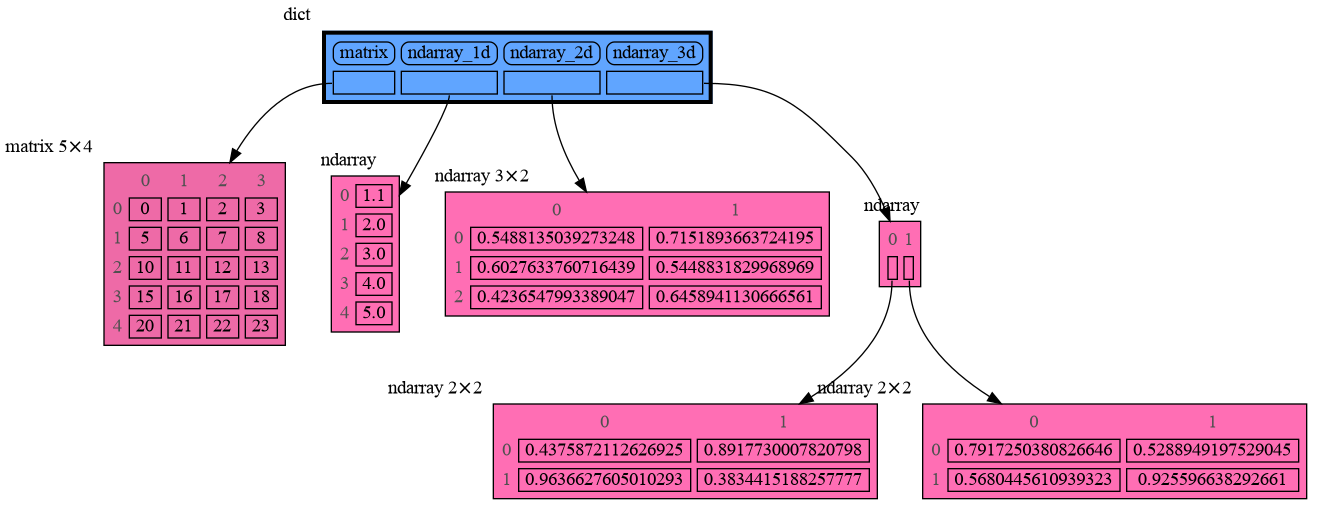
-
Numpy types `arrray` and `matrix` and `ndarray` can be graphed with
|
|
536
|
+
Numpy types `arrray` and `matrix` and `ndarray` can be graphed with "memory_graph.extension_numpy":
|
|
551
537
|
|
|
552
538
|
```python
|
|
553
539
|
import memory_graph as mg
|
|
@@ -558,12 +544,12 @@ np.random.seed(0) # use same random numbers each run
|
|
|
558
544
|
array = np.array([1.1, 2, 3, 4, 5])
|
|
559
545
|
matrix = np.matrix([[i*20+j for j in range(20)] for i in range(20)])
|
|
560
546
|
ndarray = np.random.rand(20,20)
|
|
561
|
-
mg.show(locals()
|
|
547
|
+
mg.show(locals())
|
|
562
548
|
```
|
|
563
549
|
|
|
564
550
|
|
|
565
551
|
### Pandas ###
|
|
566
|
-
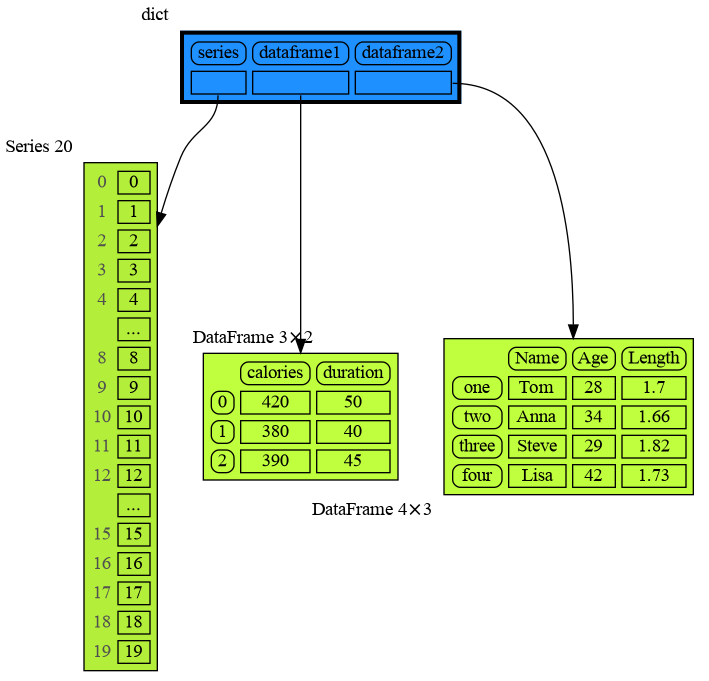
Pandas types `Series` and `DataFrame` can be graphed with
|
|
552
|
+
Pandas types `Series` and `DataFrame` can be graphed with "memory_graph.extension_pandas":
|
|
567
553
|
|
|
568
554
|
```python
|
|
569
555
|
import memory_graph as mg
|
|
@@ -577,13 +563,155 @@ dataframe2 = pd.DataFrame({ 'Name' : [ 'Tom', 'Anna', 'Steve', 'Lisa'],
|
|
|
577
563
|
'Age' : [ 28, 34, 29, 42],
|
|
578
564
|
'Length' : [ 1.70, 1.66, 1.82, 1.73] },
|
|
579
565
|
index=['one', 'two', 'three', 'four']) # with row names
|
|
580
|
-
mg.show(locals()
|
|
566
|
+
mg.show(locals())
|
|
581
567
|
```
|
|
582
568
|
|
|
583
569
|
|
|
570
|
+
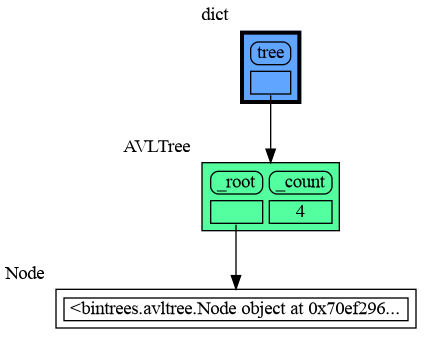
## Introspection ##
|
|
571
|
+
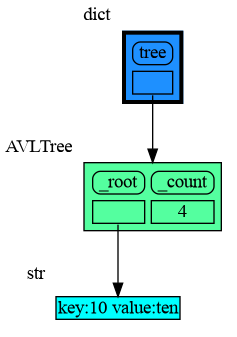
This section is likely to change. Sometimes the introspection fails or is not as desired. For example the `bintrees.avltree.Node` object doesn't show any attributes in the graph below:
|
|
572
|
+
|
|
573
|
+
```python
|
|
574
|
+
import memory_graph as mg
|
|
575
|
+
import bintrees
|
|
576
|
+
|
|
577
|
+
# Create an AVL tree
|
|
578
|
+
tree = bintrees.AVLTree()
|
|
579
|
+
tree.insert(10, "ten")
|
|
580
|
+
tree.insert(5, "five")
|
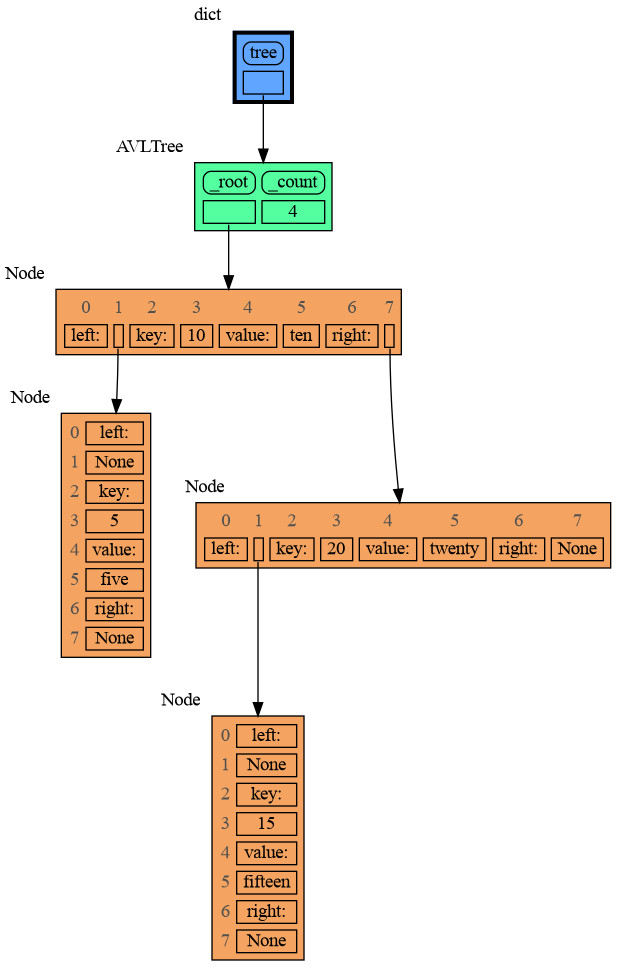
|
581
|
+
tree.insert(20, "twenty")
|
|
582
|
+
tree.insert(15, "fifteen")
|
|
583
|
+
|
|
584
|
+
mg.show(locals())
|
|
585
|
+
```
|
|
586
|
+
|
|
587
|
+
|
|
588
|
+
|
|
589
|
+
### dir() ###
|
|
590
|
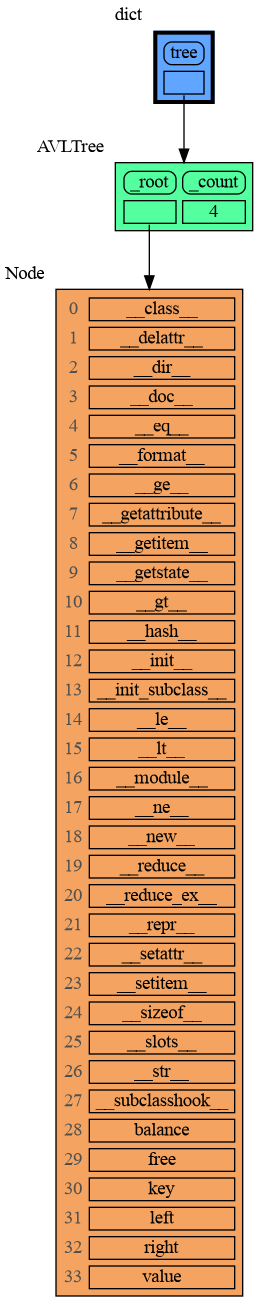
+
A usefull start is to give it some color, show the list of all its attributes using `dir()`, and setting an empty Slicer to see the attribute list in full.
|
|
591
|
+
|
|
592
|
+
```python
|
|
593
|
+
import memory_graph as mg
|
|
594
|
+
import bintrees
|
|
595
|
+
|
|
596
|
+
# Create an AVL tree
|
|
597
|
+
tree = bintrees.AVLTree()
|
|
598
|
+
tree.insert(10, "ten")
|
|
599
|
+
tree.insert(5, "five")
|
|
600
|
+
tree.insert(20, "twenty")
|
|
601
|
+
tree.insert(15, "fifteen")
|
|
602
|
+
|
|
603
|
+
mg.config.type_to_color[bintrees.avltree.Node] = "sandybrown"
|
|
604
|
+
mg.config.type_to_node[bintrees.avltree.Node] = lambda data: mg.node_linear.Node_Linear(data,
|
|
605
|
+
dir(data))
|
|
606
|
+
mg.config.type_to_slicer[bintrees.avltree.Node] = mg.slicer.Slicer()
|
|
607
|
+
|
|
608
|
+
mg.show(locals())
|
|
609
|
+
```
|
|
610
|
+
|
|
611
|
+
|
|
612
|
+
Next figure out what are the attributes you want to graph and choose a Node type, there are four options.
|
|
613
|
+
|
|
614
|
+
### 1 Node_Base ###
|
|
615
|
+
Node_base is a leaf node (with no children) and shows just a single value.
|
|
616
|
+
```python
|
|
617
|
+
import memory_graph as mg
|
|
618
|
+
import bintrees
|
|
619
|
+
|
|
620
|
+
# Create an AVL tree
|
|
621
|
+
tree = bintrees.AVLTree()
|
|
622
|
+
tree.insert(10, "ten")
|
|
623
|
+
tree.insert(5, "five")
|
|
624
|
+
tree.insert(20, "twenty")
|
|
625
|
+
tree.insert(15, "fifteen")
|
|
626
|
+
|
|
627
|
+
mg.config.type_to_color[bintrees.avltree.Node] = "sandybrown"
|
|
628
|
+
mg.config.type_to_node[bintrees.avltree.Node] = lambda data: mg.node_base.Node_Base(f"key:{data.key} value:{data.value}")
|
|
629
|
+
|
|
630
|
+
mg.show(locals())
|
|
631
|
+
```
|
|
632
|
+
|
|
633
|
+
|
|
634
|
+
### 2 Node_Linear ###
|
|
635
|
+
Node_Linear shows all the values in a line like a list.
|
|
636
|
+
```python
|
|
637
|
+
import memory_graph as mg
|
|
638
|
+
import bintrees
|
|
639
|
+
|
|
640
|
+
# Create an AVL tree
|
|
641
|
+
tree = bintrees.AVLTree()
|
|
642
|
+
tree.insert(10, "ten")
|
|
643
|
+
tree.insert(5, "five")
|
|
644
|
+
tree.insert(20, "twenty")
|
|
645
|
+
tree.insert(15, "fifteen")
|
|
646
|
+
|
|
647
|
+
mg.config.type_to_color[bintrees.avltree.Node] = "sandybrown"
|
|
648
|
+
mg.config.type_to_node[bintrees.avltree.Node] = lambda data: mg.node_linear.Node_Linear(data,
|
|
649
|
+
['left:', data.left,
|
|
650
|
+
'key:', data.key,
|
|
651
|
+
'value:', data.value,
|
|
652
|
+
'right:', data.right] )
|
|
653
|
+
|
|
654
|
+
mg.show(locals())
|
|
655
|
+
```
|
|
656
|
+
|
|
657
|
+
|
|
658
|
+
### 3 Node_Key_Value ###
|
|
659
|
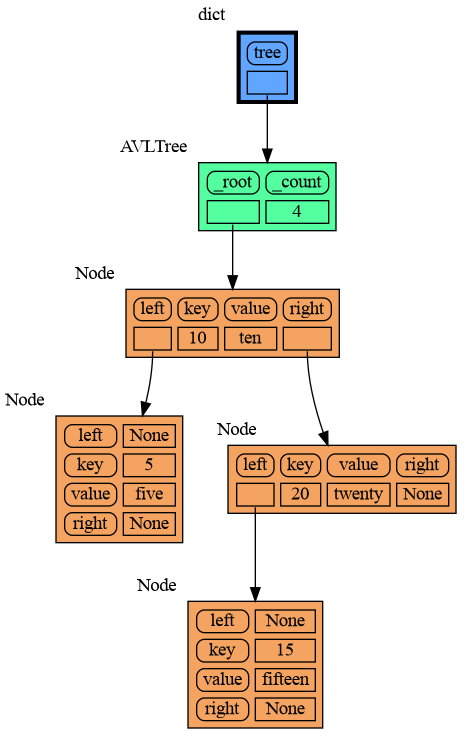
+
Node_Key_Value shows key-value pairs like a dictionary. Note the required `items()` call at the end.
|
|
660
|
+
```python
|
|
661
|
+
import memory_graph as mg
|
|
662
|
+
import bintrees
|
|
663
|
+
|
|
664
|
+
# Create an AVL tree
|
|
665
|
+
tree = bintrees.AVLTree()
|
|
666
|
+
tree.insert(10, "ten")
|
|
667
|
+
tree.insert(5, "five")
|
|
668
|
+
tree.insert(20, "twenty")
|
|
669
|
+
tree.insert(15, "fifteen")
|
|
670
|
+
|
|
671
|
+
mg.config.type_to_color[bintrees.avltree.Node] = "sandybrown"
|
|
672
|
+
mg.config.type_to_node[bintrees.avltree.Node] = lambda data: mg.node_key_value.Node_Key_Value(data,
|
|
673
|
+
{'left': data.left,
|
|
674
|
+
'key': data.key,
|
|
675
|
+
'value': data.value,
|
|
676
|
+
'right': data.right}.items() )
|
|
677
|
+
|
|
678
|
+
mg.show(locals())
|
|
679
|
+
```
|
|
680
|
+
|
|
681
|
+
|
|
682
|
+
### 4 Node_Table ###
|
|
683
|
+
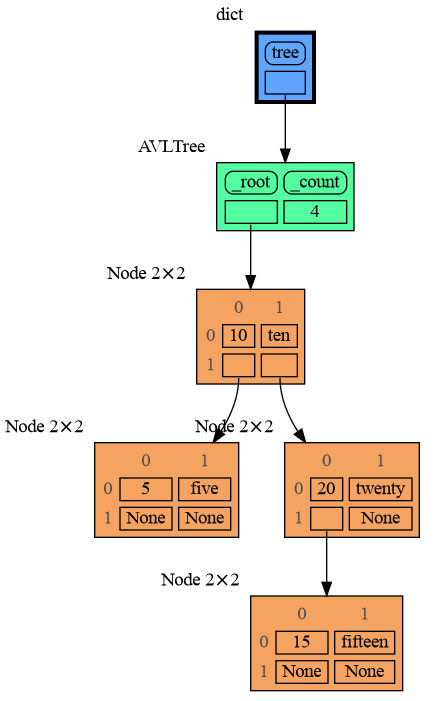
Node_Table shows all the values as a table.
|
|
684
|
+
```python
|
|
685
|
+
import memory_graph as mg
|
|
686
|
+
import bintrees
|
|
687
|
+
|
|
688
|
+
# Create an AVL tree
|
|
689
|
+
tree = bintrees.AVLTree()
|
|
690
|
+
tree.insert(10, "ten")
|
|
691
|
+
tree.insert(5, "five")
|
|
692
|
+
tree.insert(20, "twenty")
|
|
693
|
+
tree.insert(15, "fifteen")
|
|
694
|
+
|
|
695
|
+
mg.config.type_to_color[bintrees.avltree.Node] = "sandybrown"
|
|
696
|
+
mg.config.type_to_node[bintrees.avltree.Node] = lambda data: mg.node_table.Node_Table(data,
|
|
697
|
+
[[data.key, data.value],
|
|
698
|
+
[data.left, data.right]] )
|
|
699
|
+
|
|
700
|
+
|
|
701
|
+
mg.show(locals())
|
|
702
|
+
```
|
|
703
|
+
|
|
704
|
+
|
|
705
|
+
|
|
584
706
|
## Jupyter Notebook ##
|
|
707
|
+
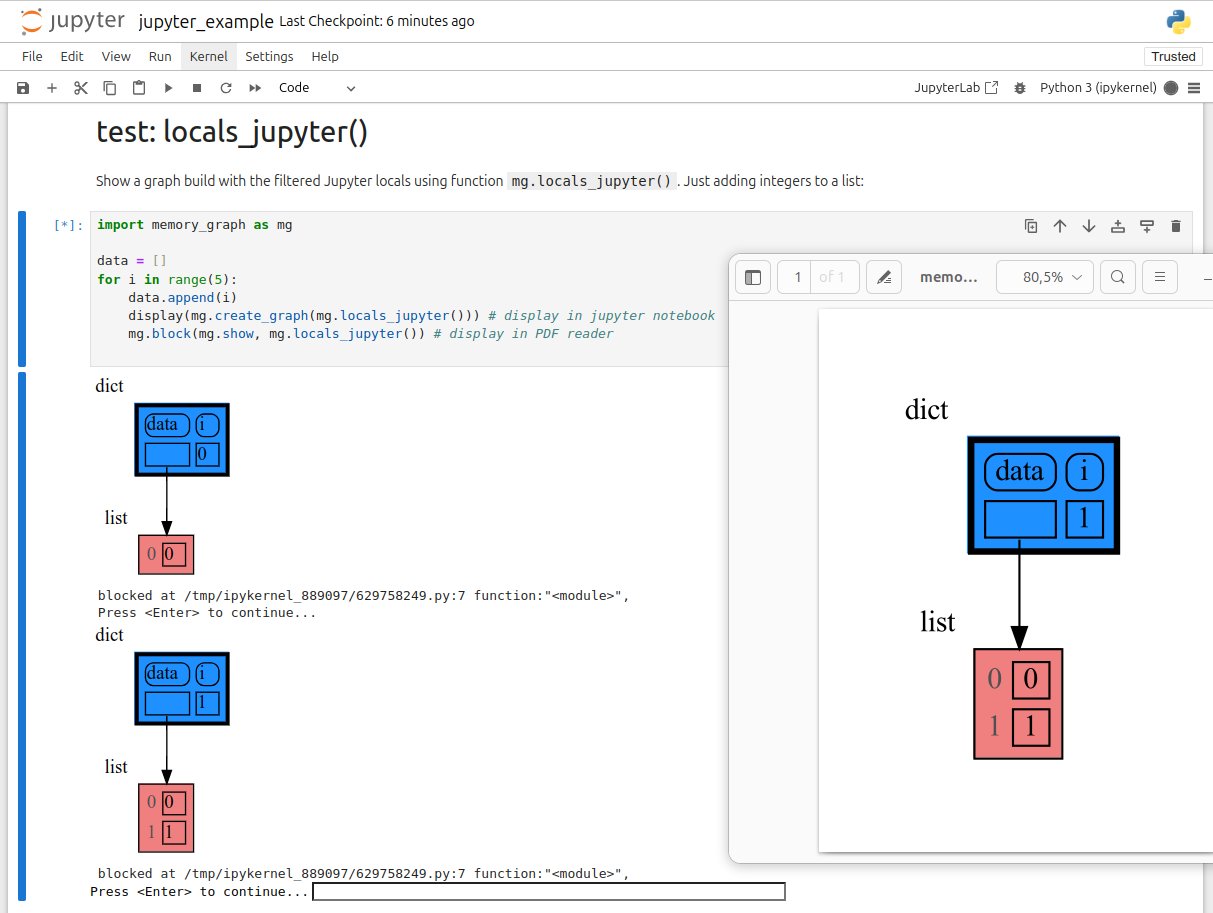
In Jupyter Notebook `locals()` has additional variables that cause problems in the graph, use `mg.locals_jupyter()` to get the local variables with these problematic variables filtered out. Use `mg.get_call_stack_jupyter()` to get the whole call stack with these variables filtered out.
|
|
708
|
+
|
|
709
|
+
We can use `mg.show()` and `mg.render()` in a Jupyter Notebook, but alternatively we can also use `mg.create_graph()` to create a graph and the `display()` function to render it inline with for example:
|
|
585
710
|
|
|
586
|
-
|
|
711
|
+
```python
|
|
712
|
+
display( mg.create_graph(mg.locals_jupyter()) ) # display the local variables inline
|
|
713
|
+
mg.block(display, mg.create_graph(mg.locals_jupyter()) ) # the same but blocked
|
|
714
|
+
```
|
|
587
715
|
|
|
588
716
|
See for example [jupyter_example.ipynb](https://raw.githubusercontent.com/bterwijn/memory_graph/main/images/jupyter_example.ipynb).
|
|
589
717
|
|
|
@@ -591,6 +719,6 @@ See for example [jupyter_example.ipynb](https://raw.githubusercontent.com/bterwi
|
|
|
591
719
|
|
|
592
720
|
## Troubleshooting ##
|
|
593
721
|
|
|
594
|
-
- Adobe Acrobat Reader [doesn't refresh a PDF file](https://superuser.com/questions/337011/windows-pdf-viewer-that-auto-refreshes-pdf-when-compiling-with-pdflatex) when it changes on disk and blocks updates which results in an `Could not open 'somefile.pdf' for writing : Permission denied` error. One solution is to install a PDF reader that does refresh ([Evince](https://www.fosshub.com/Evince.html)
|
|
722
|
+
- Adobe Acrobat Reader [doesn't refresh a PDF file](https://superuser.com/questions/337011/windows-pdf-viewer-that-auto-refreshes-pdf-when-compiling-with-pdflatex) when it changes on disk and blocks updates which results in an `Could not open 'somefile.pdf' for writing : Permission denied` error. One solution is to install a PDF reader that does refresh ([Evince](https://www.fosshub.com/Evince.html), [Okular](https://okular.kde.org/), [SumatraPDF](https://www.sumatrapdfreader.org/), ...) and set it as the default PDF reader. Another solution is to `render()` the graph to a different output format and to open it manually.
|
|
595
723
|
|
|
596
724
|
- When graph edges overlap it can be hard to distinguish them. Using an interactive graphviz viewer, such as [xdot](https://github.com/jrfonseca/xdot.py), on a '*.gv' DOT output file will help.
|