memory-graph 0.3.6__tar.gz → 0.3.7__tar.gz
This diff represents the content of publicly available package versions that have been released to one of the supported registries. The information contained in this diff is provided for informational purposes only and reflects changes between package versions as they appear in their respective public registries.
- {memory_graph-0.3.6/memory_graph.egg-info → memory_graph-0.3.7}/PKG-INFO +38 -55
- {memory_graph-0.3.6 → memory_graph-0.3.7}/README.md +37 -54
- {memory_graph-0.3.6 → memory_graph-0.3.7}/memory_graph/__init__.py +47 -69
- {memory_graph-0.3.6 → memory_graph-0.3.7/memory_graph.egg-info}/PKG-INFO +38 -55
- {memory_graph-0.3.6 → memory_graph-0.3.7}/setup.py +1 -1
- {memory_graph-0.3.6 → memory_graph-0.3.7}/LICENSE.txt +0 -0
- {memory_graph-0.3.6 → memory_graph-0.3.7}/MANIFEST.in +0 -0
- {memory_graph-0.3.6 → memory_graph-0.3.7}/memory_graph/config.py +0 -0
- {memory_graph-0.3.6 → memory_graph-0.3.7}/memory_graph/config_default.py +0 -0
- {memory_graph-0.3.6 → memory_graph-0.3.7}/memory_graph/config_helpers.py +0 -0
- {memory_graph-0.3.6 → memory_graph-0.3.7}/memory_graph/extension_numpy.py +0 -0
- {memory_graph-0.3.6 → memory_graph-0.3.7}/memory_graph/extension_pandas.py +0 -0
- {memory_graph-0.3.6 → memory_graph-0.3.7}/memory_graph/html_table.py +0 -0
- {memory_graph-0.3.6 → memory_graph-0.3.7}/memory_graph/list_view.py +0 -0
- {memory_graph-0.3.6 → memory_graph-0.3.7}/memory_graph/memory_to_nodes.py +0 -0
- {memory_graph-0.3.6 → memory_graph-0.3.7}/memory_graph/node_base.py +0 -0
- {memory_graph-0.3.6 → memory_graph-0.3.7}/memory_graph/node_key_value.py +0 -0
- {memory_graph-0.3.6 → memory_graph-0.3.7}/memory_graph/node_linear.py +0 -0
- {memory_graph-0.3.6 → memory_graph-0.3.7}/memory_graph/node_table.py +0 -0
- {memory_graph-0.3.6 → memory_graph-0.3.7}/memory_graph/sequence.py +0 -0
- {memory_graph-0.3.6 → memory_graph-0.3.7}/memory_graph/slicer.py +0 -0
- {memory_graph-0.3.6 → memory_graph-0.3.7}/memory_graph/slices.py +0 -0
- {memory_graph-0.3.6 → memory_graph-0.3.7}/memory_graph/slices_iterator.py +0 -0
- {memory_graph-0.3.6 → memory_graph-0.3.7}/memory_graph/slices_table_iterator.py +0 -0
- {memory_graph-0.3.6 → memory_graph-0.3.7}/memory_graph/t.py +0 -0
- {memory_graph-0.3.6 → memory_graph-0.3.7}/memory_graph/test.py +0 -0
- {memory_graph-0.3.6 → memory_graph-0.3.7}/memory_graph/test_memory_graph.py +0 -0
- {memory_graph-0.3.6 → memory_graph-0.3.7}/memory_graph/test_memory_to_nodes.py +0 -0
- {memory_graph-0.3.6 → memory_graph-0.3.7}/memory_graph/test_sequence.py +0 -0
- {memory_graph-0.3.6 → memory_graph-0.3.7}/memory_graph/test_slicer.py +0 -0
- {memory_graph-0.3.6 → memory_graph-0.3.7}/memory_graph/test_slices.py +0 -0
- {memory_graph-0.3.6 → memory_graph-0.3.7}/memory_graph/test_slices_iterator.py +0 -0
- {memory_graph-0.3.6 → memory_graph-0.3.7}/memory_graph/utils.py +0 -0
- {memory_graph-0.3.6 → memory_graph-0.3.7}/memory_graph.egg-info/SOURCES.txt +0 -0
- {memory_graph-0.3.6 → memory_graph-0.3.7}/memory_graph.egg-info/dependency_links.txt +0 -0
- {memory_graph-0.3.6 → memory_graph-0.3.7}/memory_graph.egg-info/requires.txt +0 -0
- {memory_graph-0.3.6 → memory_graph-0.3.7}/memory_graph.egg-info/top_level.txt +0 -0
- {memory_graph-0.3.6 → memory_graph-0.3.7}/setup.cfg +0 -0
|
@@ -1,6 +1,6 @@
|
|
|
1
1
|
Metadata-Version: 2.1
|
|
2
2
|
Name: memory_graph
|
|
3
|
-
Version: 0.3.
|
|
3
|
+
Version: 0.3.7
|
|
4
4
|
Summary: Draws a graph of your data to analyze its structure.
|
|
5
5
|
Home-page: https://github.com/bterwijn/memory_graph
|
|
6
6
|
Author: Bas Terwijn
|
|
@@ -80,11 +80,11 @@ class MyClass:
|
|
|
80
80
|
self.y = y
|
|
81
81
|
|
|
82
82
|
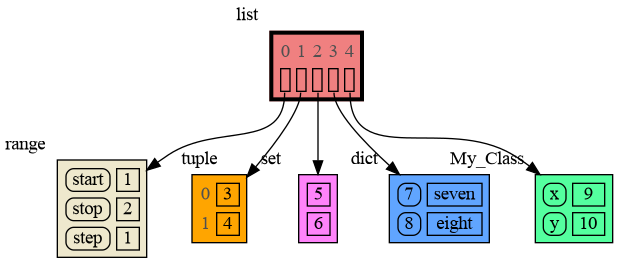
data = [ range(1, 2), (3, 4), {5, 6}, {7:'seven', 8:'eight'}, MyClass(9, 10) ]
|
|
83
|
-
mg.show(data
|
|
83
|
+
mg.show(data)
|
|
84
84
|
```
|
|
85
85
|
|
|
86
86
|
|
|
87
|
-
|
|
87
|
+
Instead of showing the graph you can also render it to an output file of your choosing (see [Graphviz Output Formats](https://graphviz.org/docs/outputs/)) using for example:
|
|
88
88
|
|
|
89
89
|
```python
|
|
90
90
|
mg.render(data, "my_graph.pdf")
|
|
@@ -190,7 +190,7 @@ mg.show(locals())
|
|
|
190
190
|
|
|
191
191
|
|
|
192
192
|
### Custom Copy Method ###
|
|
193
|
-
We can write our own custom copy function or method in case the three "copy" options don't do what we want. For example the copy() method of My_Class
|
|
193
|
+
We can write our own custom copy function or method in case the three "copy" options don't do what we want. For example, in the code below the copy() method of My_Class copies the `digits` but shares the `letters` between two objects.
|
|
194
194
|
|
|
195
195
|
```python
|
|
196
196
|
import memory_graph as mg
|
|
@@ -216,7 +216,7 @@ mg.show(locals())
|
|
|
216
216
|
|
|
217
217
|
|
|
218
218
|
## Call Stack ##
|
|
219
|
-
The
|
|
219
|
+
The `mg.get_call_stack()` function retrieves the entire call stack, including the local variables for each function on the stack. This enables us to visualize the local variables across all active functions simultaneously. Then by examining the graph, we can determine whether any local variables from different functions on the call stack share data. For instance, consider the function `add_one()` which adds the value `1` to each of its parameters, `a`, `b`, and `c`.
|
|
220
220
|
|
|
221
221
|
```python
|
|
222
222
|
import memory_graph as mg
|
|
@@ -243,9 +243,17 @@ a:[4, 3, 2, 1] b:(4, 3, 2) c:[4, 3, 2]
|
|
|
243
243
|
|
|
244
244
|
This is because `b` is of immutable type 'tuple' so its value gets copied automatically when it is changed. And because the function is called with a copy of `c`, its original value is not changed by the function. The value of variable `a` is the only value of mutable type that is shared between the root stack frame **'0: \<module>'** and the **'1: add_one'** stack frame of the function so only that variable is affected as a result of the function call. The other changes remain confined to the local variables of the ```add_one()``` function.
|
|
245
245
|
|
|
246
|
+
### Block ###
|
|
247
|
+
It is often helpful to temporarily block program execution to inspect the graph. For this, you can use the `mg.block()` function:
|
|
248
|
+
|
|
249
|
+
```python
|
|
250
|
+
mg.block(fun, arg1, arg2, ..., loc=True)
|
|
251
|
+
```
|
|
252
|
+
|
|
253
|
+
This function first executes `fun(arg1, arg2, ...)`, then prints the current source location in the program, and blocks execution until the <Enter> key is pressed. To skip printing the source location, set `loc=False`.
|
|
246
254
|
|
|
247
255
|
### Recursion ###
|
|
248
|
-
The call stack
|
|
256
|
+
The call stack is also helpful to visualize how recursion works. Here we use `mg.block()` to show each step of how recursively ```factorial(3)``` is computed:
|
|
249
257
|
|
|
250
258
|
```python
|
|
251
259
|
import memory_graph as mg
|
|
@@ -253,28 +261,26 @@ import memory_graph as mg
|
|
|
253
261
|
def factorial(n):
|
|
254
262
|
if n==0:
|
|
255
263
|
return 1
|
|
256
|
-
mg.show
|
|
264
|
+
mg.block(mg.show, mg.get_call_stack())
|
|
257
265
|
result = n * factorial(n-1)
|
|
258
|
-
mg.show
|
|
266
|
+
mg.block(mg.show, mg.get_call_stack())
|
|
259
267
|
return result
|
|
260
268
|
|
|
261
269
|
print(factorial(3))
|
|
262
270
|
```
|
|
263
271
|
|
|
264
|
-
Execution results in:
|
|
265
|
-
|
|
266
272
|
|
|
267
273
|
|
|
268
274
|
and the result is: 1 x 2 x 3 = 6
|
|
269
275
|
|
|
270
276
|
### Power Set ###
|
|
271
|
-
A more
|
|
277
|
+
A more interesting recursive example that shows sharing of data is power_set(). A power set is the set of all subsets of a collection of values.
|
|
272
278
|
|
|
273
279
|
```python
|
|
274
280
|
import memory_graph as mg
|
|
275
281
|
|
|
276
282
|
def get_subsets(subsets, data, i, subset):
|
|
277
|
-
mg.
|
|
283
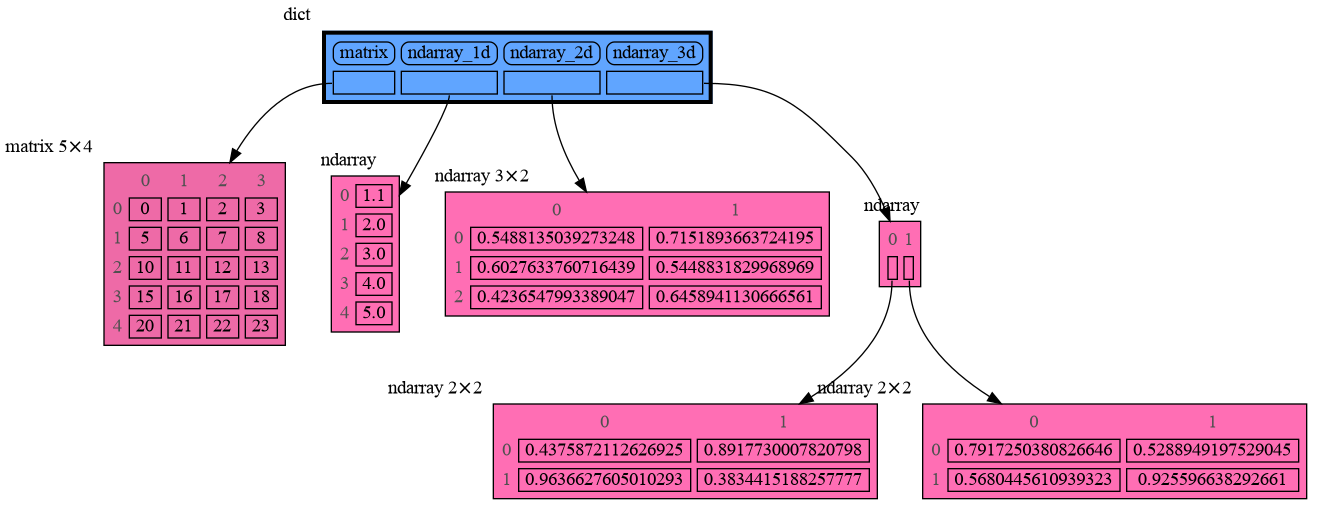
|
+
mg.block(mg.show, mg.get_call_stack())
|
|
278
284
|
if i == len(data):
|
|
279
285
|
subsets.append(subset.copy())
|
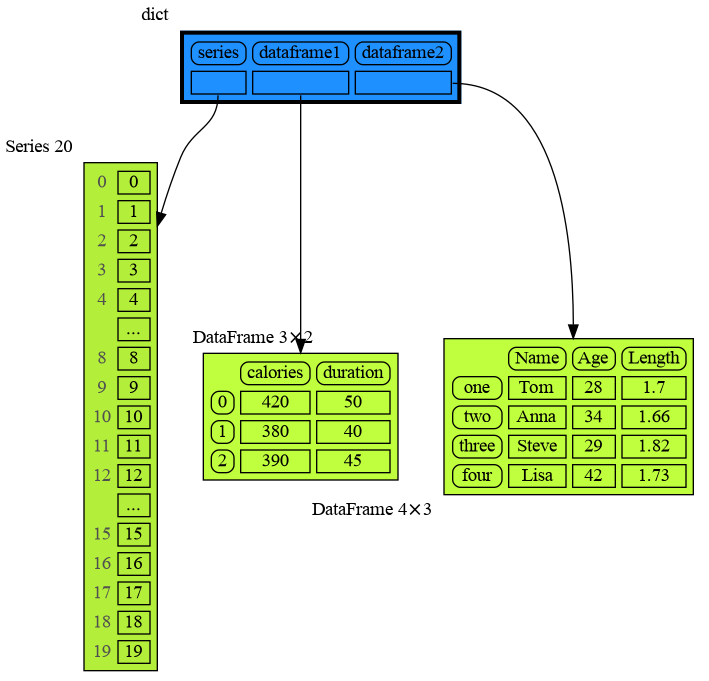
|
280
286
|
return
|
|
@@ -282,7 +288,7 @@ def get_subsets(subsets, data, i, subset):
|
|
|
282
288
|
get_subsets(subsets, data, i+1, subset) # do include data[i]
|
|
283
289
|
subset.pop()
|
|
284
290
|
get_subsets(subsets, data, i+1, subset) # don't include data[i]
|
|
285
|
-
mg.
|
|
291
|
+
mg.block(mg.show, mg.get_call_stack())
|
|
286
292
|
|
|
287
293
|
def power_set(data):
|
|
288
294
|
subsets = []
|
|
@@ -292,8 +298,6 @@ def power_set(data):
|
|
|
292
298
|
print( power_set(['a', 'b', 'c']) )
|
|
293
299
|
```
|
|
294
300
|
|
|
295
|
-
Execution results in:
|
|
296
|
-
|
|
297
301
|
|
|
298
302
|
```
|
|
299
303
|
[['a', 'b', 'c'], ['a', 'b'], ['a', 'c'], ['a'], ['b', 'c'], ['b'], ['c'], []]
|
|
@@ -329,49 +333,28 @@ mg.get_call_stack_after_up_to(after_function, up_to_function="<module>")
|
|
|
329
333
|
|
|
330
334
|
### Debugging without Debugger Tool ###
|
|
331
335
|
|
|
332
|
-
To
|
|
333
|
-
|
|
334
|
-
| alias | function|
|
|
335
|
-
|:---|:---|
|
|
336
|
-
| `d()` | `mg.show(locals(), block=True)` |
|
|
337
|
-
| `ds()` | `mg.show(mg.get_call_stack(), block=True)` |
|
|
336
|
+
To simplify debugging without a debugger tool, we offer these blocking alias functions that you can insert into your code at a specific point to visualize a graph:
|
|
338
337
|
|
|
339
|
-
|
|
340
|
-
|
|
341
|
-
|
|
342
|
-
|
|
343
|
-
- data: defaults to locals() and mg.get_call_stack() respectively
|
|
344
|
-
- graph: if True the data is visualized as a graph
|
|
345
|
-
- log: if True the data is printed
|
|
346
|
-
- block: if True the function blocks until the <Enter> key is pressed
|
|
347
|
-
|
|
348
|
-
To print to a log file instead of standard output use:
|
|
349
|
-
```python
|
|
350
|
-
mg.log_file = open("my_log_file.txt", "w")
|
|
351
|
-
```
|
|
338
|
+
| alias | purpose | function call |
|
|
339
|
+
|:---|:---|:---|
|
|
340
|
+
| `mg.l()` | graph **l**ocal variables | `mg.block(mg.show, locals())` |
|
|
341
|
+
| `mg.s()` | graph the call **s**tack | `mg.block(mg.show, mg.get_call_stack())` |
|
|
352
342
|
|
|
353
343
|
For example, executing this program:
|
|
354
344
|
|
|
355
345
|
```python
|
|
356
|
-
|
|
357
|
-
from memory_graph import d, ds
|
|
346
|
+
from memory_graph as mg
|
|
358
347
|
|
|
359
348
|
squares = []
|
|
360
349
|
squares_collector = []
|
|
361
350
|
for i in range(1, 6):
|
|
362
351
|
squares.append(i**2)
|
|
363
352
|
squares_collector.append(squares.copy())
|
|
364
|
-
|
|
353
|
+
mg.l() # graph local variables
|
|
365
354
|
```
|
|
366
|
-
and pressing <Enter> a number of times,
|
|
355
|
+
and pressing <Enter> a number of times, results in:
|
|
367
356
|
|
|
368
357
|
|
|
369
|
-
```
|
|
370
|
-
squares: [1, 4, 9, 16, 25]
|
|
371
|
-
squares_collector: [[1], [1, 4], [1, 4, 9], [1, 4, 9, 16], [1, 4, 9, 16, 25]]
|
|
372
|
-
i: 5
|
|
373
|
-
```
|
|
374
|
-
|
|
375
358
|
|
|
376
359
|
## Datastructure Examples ##
|
|
377
360
|
Module memory_graph can be very useful in a course about datastructures, some examples:
|
|
@@ -404,7 +387,7 @@ class LinkedList:
|
|
|
404
387
|
new_node.next = self.head
|
|
405
388
|
self.head.prev = new_node
|
|
406
389
|
self.head = new_node
|
|
407
|
-
mg.show
|
|
390
|
+
mg.block(mg.show, locals()) # <--- draw graph
|
|
408
391
|
|
|
409
392
|
linked_list = LinkedList()
|
|
410
393
|
n = 100
|
|
@@ -443,7 +426,7 @@ class BinTree:
|
|
|
443
426
|
node.larger = Node(new_value)
|
|
444
427
|
else:
|
|
445
428
|
self.add_recursive(new_value, node.larger)
|
|
446
|
-
mg.show
|
|
429
|
+
mg.block(mg.show, locals()) # <--- draw graph
|
|
447
430
|
|
|
448
431
|
def add(self, value):
|
|
449
432
|
if self.root is None:
|
|
@@ -476,7 +459,7 @@ class HashSet:
|
|
|
476
459
|
self.buckets[index] = []
|
|
477
460
|
bucket = self.buckets[index]
|
|
478
461
|
bucket.append(value)
|
|
479
|
-
mg.show
|
|
462
|
+
mg.block(mg.show, locals()) # <--- draw graph
|
|
480
463
|
|
|
481
464
|
def contains(self, value):
|
|
482
465
|
index = hash(value) % len(self.buckets)
|
|
@@ -499,10 +482,10 @@ for i in range(n):
|
|
|
499
482
|
|
|
500
483
|
|
|
501
484
|
## Configuration ##
|
|
502
|
-
Different aspects of memory_graph can be configured. The default configuration is reset by importing '
|
|
485
|
+
Different aspects of memory_graph can be configured. The default configuration is reset by importing 'memory_graph.config_default'.
|
|
503
486
|
|
|
504
|
-
- ***mg.config.
|
|
505
|
-
- The maxium
|
|
487
|
+
- ***mg.config.max_tree_depth*** : int
|
|
488
|
+
- The maxium depth of the graph. A `★` symbol indictes where the graph is cut short.
|
|
506
489
|
|
|
507
490
|
- ***mg.config.max_string_length*** : int
|
|
508
491
|
- The maximum length of strings shown in the graph. Longer strings will be truncated.
|
|
@@ -547,7 +530,7 @@ mg.show( locals(),
|
|
|
547
530
|
Different extensions are available for types from other Python packages.
|
|
548
531
|
|
|
549
532
|
### Numpy ###
|
|
550
|
-
Numpy types `arrray` and `matrix` and `ndarray` can be graphed with
|
|
533
|
+
Numpy types `arrray` and `matrix` and `ndarray` can be graphed with "memory_graph.extension_numpy":
|
|
551
534
|
|
|
552
535
|
```python
|
|
553
536
|
import memory_graph as mg
|
|
@@ -558,12 +541,12 @@ np.random.seed(0) # use same random numbers each run
|
|
|
558
541
|
array = np.array([1.1, 2, 3, 4, 5])
|
|
559
542
|
matrix = np.matrix([[i*20+j for j in range(20)] for i in range(20)])
|
|
560
543
|
ndarray = np.random.rand(20,20)
|
|
561
|
-
mg.show(locals()
|
|
544
|
+
mg.show(locals())
|
|
562
545
|
```
|
|
563
546
|
|
|
564
547
|
|
|
565
548
|
### Pandas ###
|
|
566
|
-
Pandas types `Series` and `DataFrame` can be graphed with
|
|
549
|
+
Pandas types `Series` and `DataFrame` can be graphed with "memory_graph.extension_pandas":
|
|
567
550
|
|
|
568
551
|
```python
|
|
569
552
|
import memory_graph as mg
|
|
@@ -577,7 +560,7 @@ dataframe2 = pd.DataFrame({ 'Name' : [ 'Tom', 'Anna', 'Steve', 'Lisa'],
|
|
|
577
560
|
'Age' : [ 28, 34, 29, 42],
|
|
578
561
|
'Length' : [ 1.70, 1.66, 1.82, 1.73] },
|
|
579
562
|
index=['one', 'two', 'three', 'four']) # with row names
|
|
580
|
-
mg.show(locals()
|
|
563
|
+
mg.show(locals())
|
|
581
564
|
```
|
|
582
565
|
|
|
583
566
|
|
|
@@ -591,6 +574,6 @@ See for example [jupyter_example.ipynb](https://raw.githubusercontent.com/bterwi
|
|
|
591
574
|
|
|
592
575
|
## Troubleshooting ##
|
|
593
576
|
|
|
594
|
-
- Adobe Acrobat Reader [doesn't refresh a PDF file](https://superuser.com/questions/337011/windows-pdf-viewer-that-auto-refreshes-pdf-when-compiling-with-pdflatex) when it changes on disk and blocks updates which results in an `Could not open 'somefile.pdf' for writing : Permission denied` error. One solution is to install a PDF reader that does refresh ([Evince](https://www.fosshub.com/Evince.html)
|
|
577
|
+
- Adobe Acrobat Reader [doesn't refresh a PDF file](https://superuser.com/questions/337011/windows-pdf-viewer-that-auto-refreshes-pdf-when-compiling-with-pdflatex) when it changes on disk and blocks updates which results in an `Could not open 'somefile.pdf' for writing : Permission denied` error. One solution is to install a PDF reader that does refresh ([Evince](https://www.fosshub.com/Evince.html), [Okular](https://okular.kde.org/), [SumatraPDF](https://www.sumatrapdfreader.org/), ...) and set it as the default PDF reader. Another solution is to `render()` the graph to a different output format and to open it manually.
|
|
595
578
|
|
|
596
579
|
- When graph edges overlap it can be hard to distinguish them. Using an interactive graphviz viewer, such as [xdot](https://github.com/jrfonseca/xdot.py), on a '*.gv' DOT output file will help.
|
|
@@ -61,11 +61,11 @@ class MyClass:
|
|
|
61
61
|
self.y = y
|
|
62
62
|
|
|
63
63
|
data = [ range(1, 2), (3, 4), {5, 6}, {7:'seven', 8:'eight'}, MyClass(9, 10) ]
|
|
64
|
-
mg.show(data
|
|
64
|
+
mg.show(data)
|
|
65
65
|
```
|
|
66
66
|

|
|
67
67
|
|
|
68
|
-
|
|
68
|
+
Instead of showing the graph you can also render it to an output file of your choosing (see [Graphviz Output Formats](https://graphviz.org/docs/outputs/)) using for example:
|
|
69
69
|
|
|
70
70
|
```python
|
|
71
71
|
mg.render(data, "my_graph.pdf")
|
|
@@ -171,7 +171,7 @@ mg.show(locals())
|
|
|
171
171
|
|
|
172
172
|
|
|
173
173
|
### Custom Copy Method ###
|
|
174
|
-
We can write our own custom copy function or method in case the three "copy" options don't do what we want. For example the copy() method of My_Class
|
|
174
|
+
We can write our own custom copy function or method in case the three "copy" options don't do what we want. For example, in the code below the copy() method of My_Class copies the `digits` but shares the `letters` between two objects.
|
|
175
175
|
|
|
176
176
|
```python
|
|
177
177
|
import memory_graph as mg
|
|
@@ -197,7 +197,7 @@ mg.show(locals())
|
|
|
197
197
|
|
|
198
198
|
|
|
199
199
|
## Call Stack ##
|
|
200
|
-
The
|
|
200
|
+
The `mg.get_call_stack()` function retrieves the entire call stack, including the local variables for each function on the stack. This enables us to visualize the local variables across all active functions simultaneously. Then by examining the graph, we can determine whether any local variables from different functions on the call stack share data. For instance, consider the function `add_one()` which adds the value `1` to each of its parameters, `a`, `b`, and `c`.
|
|
201
201
|
|
|
202
202
|
```python
|
|
203
203
|
import memory_graph as mg
|
|
@@ -224,9 +224,17 @@ a:[4, 3, 2, 1] b:(4, 3, 2) c:[4, 3, 2]
|
|
|
224
224
|
|
|
225
225
|
This is because `b` is of immutable type 'tuple' so its value gets copied automatically when it is changed. And because the function is called with a copy of `c`, its original value is not changed by the function. The value of variable `a` is the only value of mutable type that is shared between the root stack frame **'0: \<module>'** and the **'1: add_one'** stack frame of the function so only that variable is affected as a result of the function call. The other changes remain confined to the local variables of the ```add_one()``` function.
|
|
226
226
|
|
|
227
|
+
### Block ###
|
|
228
|
+
It is often helpful to temporarily block program execution to inspect the graph. For this, you can use the `mg.block()` function:
|
|
229
|
+
|
|
230
|
+
```python
|
|
231
|
+
mg.block(fun, arg1, arg2, ..., loc=True)
|
|
232
|
+
```
|
|
233
|
+
|
|
234
|
+
This function first executes `fun(arg1, arg2, ...)`, then prints the current source location in the program, and blocks execution until the <Enter> key is pressed. To skip printing the source location, set `loc=False`.
|
|
227
235
|
|
|
228
236
|
### Recursion ###
|
|
229
|
-
The call stack
|
|
237
|
+
The call stack is also helpful to visualize how recursion works. Here we use `mg.block()` to show each step of how recursively ```factorial(3)``` is computed:
|
|
230
238
|
|
|
231
239
|
```python
|
|
232
240
|
import memory_graph as mg
|
|
@@ -234,28 +242,26 @@ import memory_graph as mg
|
|
|
234
242
|
def factorial(n):
|
|
235
243
|
if n==0:
|
|
236
244
|
return 1
|
|
237
|
-
mg.show
|
|
245
|
+
mg.block(mg.show, mg.get_call_stack())
|
|
238
246
|
result = n * factorial(n-1)
|
|
239
|
-
mg.show
|
|
247
|
+
mg.block(mg.show, mg.get_call_stack())
|
|
240
248
|
return result
|
|
241
249
|
|
|
242
250
|
print(factorial(3))
|
|
243
251
|
```
|
|
244
252
|
|
|
245
|
-
Execution results in:
|
|
246
|
-
|
|
247
253
|

|
|
248
254
|
|
|
249
255
|
and the result is: 1 x 2 x 3 = 6
|
|
250
256
|
|
|
251
257
|
### Power Set ###
|
|
252
|
-
A more
|
|
258
|
+
A more interesting recursive example that shows sharing of data is power_set(). A power set is the set of all subsets of a collection of values.
|
|
253
259
|
|
|
254
260
|
```python
|
|
255
261
|
import memory_graph as mg
|
|
256
262
|
|
|
257
263
|
def get_subsets(subsets, data, i, subset):
|
|
258
|
-
mg.
|
|
264
|
+
mg.block(mg.show, mg.get_call_stack())
|
|
259
265
|
if i == len(data):
|
|
260
266
|
subsets.append(subset.copy())
|
|
261
267
|
return
|
|
@@ -263,7 +269,7 @@ def get_subsets(subsets, data, i, subset):
|
|
|
263
269
|
get_subsets(subsets, data, i+1, subset) # do include data[i]
|
|
264
270
|
subset.pop()
|
|
265
271
|
get_subsets(subsets, data, i+1, subset) # don't include data[i]
|
|
266
|
-
mg.
|
|
272
|
+
mg.block(mg.show, mg.get_call_stack())
|
|
267
273
|
|
|
268
274
|
def power_set(data):
|
|
269
275
|
subsets = []
|
|
@@ -273,8 +279,6 @@ def power_set(data):
|
|
|
273
279
|
print( power_set(['a', 'b', 'c']) )
|
|
274
280
|
```
|
|
275
281
|
|
|
276
|
-
Execution results in:
|
|
277
|
-
|
|
278
282
|

|
|
279
283
|
```
|
|
280
284
|
[['a', 'b', 'c'], ['a', 'b'], ['a', 'c'], ['a'], ['b', 'c'], ['b'], ['c'], []]
|
|
@@ -310,49 +314,28 @@ mg.get_call_stack_after_up_to(after_function, up_to_function="<module>")
|
|
|
310
314
|
|
|
311
315
|
### Debugging without Debugger Tool ###
|
|
312
316
|
|
|
313
|
-
To
|
|
314
|
-
|
|
315
|
-
| alias | function|
|
|
316
|
-
|:---|:---|
|
|
317
|
-
| `d()` | `mg.show(locals(), block=True)` |
|
|
318
|
-
| `ds()` | `mg.show(mg.get_call_stack(), block=True)` |
|
|
317
|
+
To simplify debugging without a debugger tool, we offer these blocking alias functions that you can insert into your code at a specific point to visualize a graph:
|
|
319
318
|
|
|
320
|
-
|
|
321
|
-
|
|
322
|
-
|
|
323
|
-
|
|
324
|
-
- data: defaults to locals() and mg.get_call_stack() respectively
|
|
325
|
-
- graph: if True the data is visualized as a graph
|
|
326
|
-
- log: if True the data is printed
|
|
327
|
-
- block: if True the function blocks until the <Enter> key is pressed
|
|
328
|
-
|
|
329
|
-
To print to a log file instead of standard output use:
|
|
330
|
-
```python
|
|
331
|
-
mg.log_file = open("my_log_file.txt", "w")
|
|
332
|
-
```
|
|
319
|
+
| alias | purpose | function call |
|
|
320
|
+
|:---|:---|:---|
|
|
321
|
+
| `mg.l()` | graph **l**ocal variables | `mg.block(mg.show, locals())` |
|
|
322
|
+
| `mg.s()` | graph the call **s**tack | `mg.block(mg.show, mg.get_call_stack())` |
|
|
333
323
|
|
|
334
324
|
For example, executing this program:
|
|
335
325
|
|
|
336
326
|
```python
|
|
337
|
-
|
|
338
|
-
from memory_graph import d, ds
|
|
327
|
+
from memory_graph as mg
|
|
339
328
|
|
|
340
329
|
squares = []
|
|
341
330
|
squares_collector = []
|
|
342
331
|
for i in range(1, 6):
|
|
343
332
|
squares.append(i**2)
|
|
344
333
|
squares_collector.append(squares.copy())
|
|
345
|
-
|
|
334
|
+
mg.l() # graph local variables
|
|
346
335
|
```
|
|
347
|
-
and pressing <Enter> a number of times,
|
|
336
|
+
and pressing <Enter> a number of times, results in:
|
|
348
337
|
|
|
349
338
|

|
|
350
|
-
```
|
|
351
|
-
squares: [1, 4, 9, 16, 25]
|
|
352
|
-
squares_collector: [[1], [1, 4], [1, 4, 9], [1, 4, 9, 16], [1, 4, 9, 16, 25]]
|
|
353
|
-
i: 5
|
|
354
|
-
```
|
|
355
|
-
|
|
356
339
|
|
|
357
340
|
## Datastructure Examples ##
|
|
358
341
|
Module memory_graph can be very useful in a course about datastructures, some examples:
|
|
@@ -385,7 +368,7 @@ class LinkedList:
|
|
|
385
368
|
new_node.next = self.head
|
|
386
369
|
self.head.prev = new_node
|
|
387
370
|
self.head = new_node
|
|
388
|
-
mg.show
|
|
371
|
+
mg.block(mg.show, locals()) # <--- draw graph
|
|
389
372
|
|
|
390
373
|
linked_list = LinkedList()
|
|
391
374
|
n = 100
|
|
@@ -424,7 +407,7 @@ class BinTree:
|
|
|
424
407
|
node.larger = Node(new_value)
|
|
425
408
|
else:
|
|
426
409
|
self.add_recursive(new_value, node.larger)
|
|
427
|
-
mg.show
|
|
410
|
+
mg.block(mg.show, locals()) # <--- draw graph
|
|
428
411
|
|
|
429
412
|
def add(self, value):
|
|
430
413
|
if self.root is None:
|
|
@@ -457,7 +440,7 @@ class HashSet:
|
|
|
457
440
|
self.buckets[index] = []
|
|
458
441
|
bucket = self.buckets[index]
|
|
459
442
|
bucket.append(value)
|
|
460
|
-
mg.show
|
|
443
|
+
mg.block(mg.show, locals()) # <--- draw graph
|
|
461
444
|
|
|
462
445
|
def contains(self, value):
|
|
463
446
|
index = hash(value) % len(self.buckets)
|
|
@@ -480,10 +463,10 @@ for i in range(n):
|
|
|
480
463
|
|
|
481
464
|
|
|
482
465
|
## Configuration ##
|
|
483
|
-
Different aspects of memory_graph can be configured. The default configuration is reset by importing '
|
|
466
|
+
Different aspects of memory_graph can be configured. The default configuration is reset by importing 'memory_graph.config_default'.
|
|
484
467
|
|
|
485
|
-
- ***mg.config.
|
|
486
|
-
- The maxium
|
|
468
|
+
- ***mg.config.max_tree_depth*** : int
|
|
469
|
+
- The maxium depth of the graph. A `★` symbol indictes where the graph is cut short.
|
|
487
470
|
|
|
488
471
|
- ***mg.config.max_string_length*** : int
|
|
489
472
|
- The maximum length of strings shown in the graph. Longer strings will be truncated.
|
|
@@ -528,7 +511,7 @@ mg.show( locals(),
|
|
|
528
511
|
Different extensions are available for types from other Python packages.
|
|
529
512
|
|
|
530
513
|
### Numpy ###
|
|
531
|
-
Numpy types `arrray` and `matrix` and `ndarray` can be graphed with
|
|
514
|
+
Numpy types `arrray` and `matrix` and `ndarray` can be graphed with "memory_graph.extension_numpy":
|
|
532
515
|
|
|
533
516
|
```python
|
|
534
517
|
import memory_graph as mg
|
|
@@ -539,12 +522,12 @@ np.random.seed(0) # use same random numbers each run
|
|
|
539
522
|
array = np.array([1.1, 2, 3, 4, 5])
|
|
540
523
|
matrix = np.matrix([[i*20+j for j in range(20)] for i in range(20)])
|
|
541
524
|
ndarray = np.random.rand(20,20)
|
|
542
|
-
mg.show(locals()
|
|
525
|
+
mg.show(locals())
|
|
543
526
|
```
|
|
544
527
|

|
|
545
528
|
|
|
546
529
|
### Pandas ###
|
|
547
|
-
Pandas types `Series` and `DataFrame` can be graphed with
|
|
530
|
+
Pandas types `Series` and `DataFrame` can be graphed with "memory_graph.extension_pandas":
|
|
548
531
|
|
|
549
532
|
```python
|
|
550
533
|
import memory_graph as mg
|
|
@@ -558,7 +541,7 @@ dataframe2 = pd.DataFrame({ 'Name' : [ 'Tom', 'Anna', 'Steve', 'Lisa'],
|
|
|
558
541
|
'Age' : [ 28, 34, 29, 42],
|
|
559
542
|
'Length' : [ 1.70, 1.66, 1.82, 1.73] },
|
|
560
543
|
index=['one', 'two', 'three', 'four']) # with row names
|
|
561
|
-
mg.show(locals()
|
|
544
|
+
mg.show(locals())
|
|
562
545
|
```
|
|
563
546
|

|
|
564
547
|
|
|
@@ -572,6 +555,6 @@ See for example [jupyter_example.ipynb](https://raw.githubusercontent.com/bterwi
|
|
|
572
555
|
|
|
573
556
|
## Troubleshooting ##
|
|
574
557
|
|
|
575
|
-
- Adobe Acrobat Reader [doesn't refresh a PDF file](https://superuser.com/questions/337011/windows-pdf-viewer-that-auto-refreshes-pdf-when-compiling-with-pdflatex) when it changes on disk and blocks updates which results in an `Could not open 'somefile.pdf' for writing : Permission denied` error. One solution is to install a PDF reader that does refresh ([Evince](https://www.fosshub.com/Evince.html)
|
|
558
|
+
- Adobe Acrobat Reader [doesn't refresh a PDF file](https://superuser.com/questions/337011/windows-pdf-viewer-that-auto-refreshes-pdf-when-compiling-with-pdflatex) when it changes on disk and blocks updates which results in an `Could not open 'somefile.pdf' for writing : Permission denied` error. One solution is to install a PDF reader that does refresh ([Evince](https://www.fosshub.com/Evince.html), [Okular](https://okular.kde.org/), [SumatraPDF](https://www.sumatrapdfreader.org/), ...) and set it as the default PDF reader. Another solution is to `render()` the graph to a different output format and to open it manually.
|
|
576
559
|
|
|
577
560
|
- When graph edges overlap it can be hard to distinguish them. Using an interactive graphviz viewer, such as [xdot](https://github.com/jrfonseca/xdot.py), on a '*.gv' DOT output file will help.
|
|
@@ -9,24 +9,41 @@ import sys
|
|
|
9
9
|
|
|
10
10
|
import graphviz
|
|
11
11
|
|
|
12
|
-
__version__ = "0.3.
|
|
12
|
+
__version__ = "0.3.07"
|
|
13
13
|
__author__ = 'Bas Terwijn'
|
|
14
14
|
|
|
15
|
-
log_file=sys.stdout
|
|
16
|
-
press_enter_text="press <ENTER> to continue..."
|
|
17
|
-
|
|
18
15
|
def get_source_location(stack_index):
|
|
19
16
|
""" Helper function to get the source location of the stack with 'stack_index' of the call stack. """
|
|
20
17
|
frameInfo = inspect.stack()[stack_index] # get frameInfo of calling frame
|
|
21
18
|
filename= frameInfo.filename
|
|
22
19
|
line_nr= frameInfo.lineno
|
|
23
20
|
function = frameInfo.function
|
|
24
|
-
return f'
|
|
21
|
+
return f'blocked at {filename}:{line_nr} function:"{function}"'
|
|
25
22
|
|
|
26
|
-
def
|
|
27
|
-
"""
|
|
28
|
-
|
|
29
|
-
|
|
23
|
+
def block(fun=None, *args, **kwargs):
|
|
24
|
+
"""
|
|
25
|
+
Calls the given function `fun` with specified arguments and keyword arguments,
|
|
26
|
+
waits for the user to press Enter, and returns the result of `fun`.
|
|
27
|
+
"""
|
|
28
|
+
loc=True
|
|
29
|
+
stack_index=2
|
|
30
|
+
if 'loc' in kwargs:
|
|
31
|
+
loc = kwargs['loc']
|
|
32
|
+
del kwargs['loc']
|
|
33
|
+
if 'stack_index' in kwargs:
|
|
34
|
+
stack_index = kwargs['stack_index']
|
|
35
|
+
del kwargs['stack_index']
|
|
36
|
+
result = None
|
|
37
|
+
if callable(fun):
|
|
38
|
+
result = fun(*args, **kwargs)
|
|
39
|
+
if loc:
|
|
40
|
+
print(get_source_location(stack_index),end=', ')
|
|
41
|
+
input("Press <Enter> to continue...")
|
|
42
|
+
return result
|
|
43
|
+
|
|
44
|
+
def block_deprecated_message():
|
|
45
|
+
print("Warning: 'block=True' deprecated, use mg.block(fun) instead.")
|
|
46
|
+
input(f"{get_source_location(3)}, Press <Enter> to continue...")
|
|
30
47
|
|
|
31
48
|
def create_graph(data,
|
|
32
49
|
colors = None,
|
|
@@ -37,88 +54,49 @@ def create_graph(data,
|
|
|
37
54
|
graphviz_graph = memory_to_nodes.memory_to_nodes(data)
|
|
38
55
|
return graphviz_graph
|
|
39
56
|
|
|
40
|
-
def show(data
|
|
57
|
+
def show(data ,block=False,
|
|
41
58
|
colors = None,
|
|
42
59
|
vertical_orientations = None,
|
|
43
60
|
slicers = None):
|
|
44
61
|
""" Shows the graph of 'data' and optionally blocks. """
|
|
45
|
-
if data is None:
|
|
46
|
-
data=get_locals_from_calling_frame(stack_index)
|
|
47
62
|
graph = create_graph(data, colors, vertical_orientations, slicers)
|
|
48
63
|
graph.view()
|
|
49
64
|
if block:
|
|
50
|
-
|
|
65
|
+
block_deprecated_message()
|
|
51
66
|
|
|
52
|
-
def render(data
|
|
67
|
+
def render(data, outfile=None, block=False,
|
|
53
68
|
colors = None,
|
|
54
69
|
vertical_orientations = None,
|
|
55
70
|
slicers = None):
|
|
56
71
|
""" Renders the graph of 'data' to 'output_filename' and optionally blocks. """
|
|
57
|
-
if data is None:
|
|
58
|
-
data=get_locals_from_calling_frame(stack_index)
|
|
59
72
|
graph = create_graph(data, colors, vertical_orientations, slicers)
|
|
60
73
|
filename = outfile if outfile else graph.filename+".pdf"
|
|
61
74
|
graph.render(outfile=filename)
|
|
62
75
|
if block:
|
|
63
|
-
|
|
76
|
+
block_deprecated_message()
|
|
64
77
|
|
|
65
|
-
def
|
|
66
|
-
try:
|
|
67
|
-
return str(data)
|
|
68
|
-
except Exception as e:
|
|
69
|
-
return f"problem printing: {type(data)}"
|
|
70
|
-
|
|
71
|
-
def d(data=None,graph=True,log=False,block=True,stack_index=2,
|
|
72
|
-
colors = None,
|
|
73
|
-
vertical_orientations = None,
|
|
74
|
-
slicers = None):
|
|
78
|
+
def l(loc=True, stack_index=2, colors = None, vertical_orientations = None, slicers = None):
|
|
75
79
|
"""
|
|
76
|
-
Shows the graph of
|
|
77
|
-
When no 'data' is given, the locals of the calling frame are used as 'data'.
|
|
80
|
+
Shows the graph of 'data' or the locals of the calling frame, and blocks.
|
|
78
81
|
"""
|
|
79
|
-
|
|
80
|
-
|
|
81
|
-
|
|
82
|
-
|
|
83
|
-
|
|
84
|
-
if log:
|
|
85
|
-
if isinstance(data,dict):
|
|
86
|
-
for key,value in utils.filter_dict_attributes(data.items()):
|
|
87
|
-
print(f"{to_str(key)}: {to_str(value)}", file=log_file, flush=True)
|
|
88
|
-
else:
|
|
89
|
-
print(to_str(data), file=log_file, flush=True)
|
|
90
|
-
if not block and not log_file == sys.stdout:
|
|
91
|
-
print(f"debugging, {get_source_location(stack_index)}",file=log_file)
|
|
92
|
-
if block:
|
|
93
|
-
input(f"debugging, {get_source_location(stack_index)}, {press_enter_text}")
|
|
94
|
-
|
|
95
|
-
def ds(data=None,graph=True,log=False,block=True,stack_index=2,
|
|
96
|
-
colors = None,
|
|
97
|
-
vertical_orientations = None,
|
|
98
|
-
slicers = None):
|
|
82
|
+
data = get_locals_from_calling_frame(stack_index=stack_index)
|
|
83
|
+
memory_graph.block(memory_graph.show, data, loc=loc, stack_index=stack_index+1, block=False,
|
|
84
|
+
colors=colors, vertical_orientations=vertical_orientations, slicers=slicers)
|
|
85
|
+
|
|
86
|
+
def s(loc=True, stack_index=2, colors = None, vertical_orientations = None, slicers = None):
|
|
99
87
|
"""
|
|
100
88
|
Shows the graph of and optionally prints the call stack, and optionally blocks.
|
|
101
89
|
"""
|
|
102
|
-
|
|
103
|
-
|
|
104
|
-
|
|
105
|
-
|
|
106
|
-
|
|
107
|
-
|
|
108
|
-
|
|
109
|
-
|
|
110
|
-
|
|
111
|
-
|
|
112
|
-
for key,value in utils.filter_dict_attributes(vars.items()):
|
|
113
|
-
print(f"{to_str(key)}: {to_str(value)}", file=log_file, flush=True)
|
|
114
|
-
else:
|
|
115
|
-
print(to_str(frame), file=log_file, flush=True)
|
|
116
|
-
else:
|
|
117
|
-
print(to_str(data), file=log_file, flush=True)
|
|
118
|
-
if not block and not log_file == sys.stdout:
|
|
119
|
-
print(f"debugging, {get_source_location(stack_index)}",file=log_file)
|
|
120
|
-
if block:
|
|
121
|
-
input(f"debugging, {get_source_location(stack_index)}, {press_enter_text}")
|
|
90
|
+
data = get_call_stack(stack_index=stack_index)
|
|
91
|
+
memory_graph.block(memory_graph.show, data, loc=loc, stack_index=stack_index+1, block=False,
|
|
92
|
+
colors=colors, vertical_orientations=vertical_orientations, slicers=slicers)
|
|
93
|
+
|
|
94
|
+
# ------------ locals
|
|
95
|
+
|
|
96
|
+
def get_locals_from_calling_frame(stack_index=1):
|
|
97
|
+
""" Helper function to get locals of the stack with 'stack_inex' of the call stack. """
|
|
98
|
+
frameInfo = inspect.stack()[stack_index] # get frameInfo of calling frame
|
|
99
|
+
return frameInfo.frame.f_locals
|
|
122
100
|
|
|
123
101
|
# ------------ call stack
|
|
124
102
|
|
|
@@ -1,6 +1,6 @@
|
|
|
1
1
|
Metadata-Version: 2.1
|
|
2
2
|
Name: memory_graph
|
|
3
|
-
Version: 0.3.
|
|
3
|
+
Version: 0.3.7
|
|
4
4
|
Summary: Draws a graph of your data to analyze its structure.
|
|
5
5
|
Home-page: https://github.com/bterwijn/memory_graph
|
|
6
6
|
Author: Bas Terwijn
|
|
@@ -80,11 +80,11 @@ class MyClass:
|
|
|
80
80
|
self.y = y
|
|
81
81
|
|
|
82
82
|
data = [ range(1, 2), (3, 4), {5, 6}, {7:'seven', 8:'eight'}, MyClass(9, 10) ]
|
|
83
|
-
mg.show(data
|
|
83
|
+
mg.show(data)
|
|
84
84
|
```
|
|
85
85
|

|
|
86
86
|
|
|
87
|
-
|
|
87
|
+
Instead of showing the graph you can also render it to an output file of your choosing (see [Graphviz Output Formats](https://graphviz.org/docs/outputs/)) using for example:
|
|
88
88
|
|
|
89
89
|
```python
|
|
90
90
|
mg.render(data, "my_graph.pdf")
|
|
@@ -190,7 +190,7 @@ mg.show(locals())
|
|
|
190
190
|
|
|
191
191
|
|
|
192
192
|
### Custom Copy Method ###
|
|
193
|
-
We can write our own custom copy function or method in case the three "copy" options don't do what we want. For example the copy() method of My_Class
|
|
193
|
+
We can write our own custom copy function or method in case the three "copy" options don't do what we want. For example, in the code below the copy() method of My_Class copies the `digits` but shares the `letters` between two objects.
|
|
194
194
|
|
|
195
195
|
```python
|
|
196
196
|
import memory_graph as mg
|
|
@@ -216,7 +216,7 @@ mg.show(locals())
|
|
|
216
216
|
|
|
217
217
|
|
|
218
218
|
## Call Stack ##
|
|
219
|
-
The
|
|
219
|
+
The `mg.get_call_stack()` function retrieves the entire call stack, including the local variables for each function on the stack. This enables us to visualize the local variables across all active functions simultaneously. Then by examining the graph, we can determine whether any local variables from different functions on the call stack share data. For instance, consider the function `add_one()` which adds the value `1` to each of its parameters, `a`, `b`, and `c`.
|
|
220
220
|
|
|
221
221
|
```python
|
|
222
222
|
import memory_graph as mg
|
|
@@ -243,9 +243,17 @@ a:[4, 3, 2, 1] b:(4, 3, 2) c:[4, 3, 2]
|
|
|
243
243
|
|
|
244
244
|
This is because `b` is of immutable type 'tuple' so its value gets copied automatically when it is changed. And because the function is called with a copy of `c`, its original value is not changed by the function. The value of variable `a` is the only value of mutable type that is shared between the root stack frame **'0: \<module>'** and the **'1: add_one'** stack frame of the function so only that variable is affected as a result of the function call. The other changes remain confined to the local variables of the ```add_one()``` function.
|
|
245
245
|
|
|
246
|
+
### Block ###
|
|
247
|
+
It is often helpful to temporarily block program execution to inspect the graph. For this, you can use the `mg.block()` function:
|
|
248
|
+
|
|
249
|
+
```python
|
|
250
|
+
mg.block(fun, arg1, arg2, ..., loc=True)
|
|
251
|
+
```
|
|
252
|
+
|
|
253
|
+
This function first executes `fun(arg1, arg2, ...)`, then prints the current source location in the program, and blocks execution until the <Enter> key is pressed. To skip printing the source location, set `loc=False`.
|
|
246
254
|
|
|
247
255
|
### Recursion ###
|
|
248
|
-
The call stack
|
|
256
|
+
The call stack is also helpful to visualize how recursion works. Here we use `mg.block()` to show each step of how recursively ```factorial(3)``` is computed:
|
|
249
257
|
|
|
250
258
|
```python
|
|
251
259
|
import memory_graph as mg
|
|
@@ -253,28 +261,26 @@ import memory_graph as mg
|
|
|
253
261
|
def factorial(n):
|
|
254
262
|
if n==0:
|
|
255
263
|
return 1
|
|
256
|
-
mg.show
|
|
264
|
+
mg.block(mg.show, mg.get_call_stack())
|
|
257
265
|
result = n * factorial(n-1)
|
|
258
|
-
mg.show
|
|
266
|
+
mg.block(mg.show, mg.get_call_stack())
|
|
259
267
|
return result
|
|
260
268
|
|
|
261
269
|
print(factorial(3))
|
|
262
270
|
```
|
|
263
271
|
|
|
264
|
-
Execution results in:
|
|
265
|
-
|
|
266
272
|

|
|
267
273
|
|
|
268
274
|
and the result is: 1 x 2 x 3 = 6
|
|
269
275
|
|
|
270
276
|
### Power Set ###
|
|
271
|
-
A more
|
|
277
|
+
A more interesting recursive example that shows sharing of data is power_set(). A power set is the set of all subsets of a collection of values.
|
|
272
278
|
|
|
273
279
|
```python
|
|
274
280
|
import memory_graph as mg
|
|
275
281
|
|
|
276
282
|
def get_subsets(subsets, data, i, subset):
|
|
277
|
-
mg.
|
|
283
|
+
mg.block(mg.show, mg.get_call_stack())
|
|
278
284
|
if i == len(data):
|
|
279
285
|
subsets.append(subset.copy())
|
|
280
286
|
return
|
|
@@ -282,7 +288,7 @@ def get_subsets(subsets, data, i, subset):
|
|
|
282
288
|
get_subsets(subsets, data, i+1, subset) # do include data[i]
|
|
283
289
|
subset.pop()
|
|
284
290
|
get_subsets(subsets, data, i+1, subset) # don't include data[i]
|
|
285
|
-
mg.
|
|
291
|
+
mg.block(mg.show, mg.get_call_stack())
|
|
286
292
|
|
|
287
293
|
def power_set(data):
|
|
288
294
|
subsets = []
|
|
@@ -292,8 +298,6 @@ def power_set(data):
|
|
|
292
298
|
print( power_set(['a', 'b', 'c']) )
|
|
293
299
|
```
|
|
294
300
|
|
|
295
|
-
Execution results in:
|
|
296
|
-
|
|
297
301
|

|
|
298
302
|
```
|
|
299
303
|
[['a', 'b', 'c'], ['a', 'b'], ['a', 'c'], ['a'], ['b', 'c'], ['b'], ['c'], []]
|
|
@@ -329,49 +333,28 @@ mg.get_call_stack_after_up_to(after_function, up_to_function="<module>")
|
|
|
329
333
|
|
|
330
334
|
### Debugging without Debugger Tool ###
|
|
331
335
|
|
|
332
|
-
To
|
|
333
|
-
|
|
334
|
-
| alias | function|
|
|
335
|
-
|:---|:---|
|
|
336
|
-
| `d()` | `mg.show(locals(), block=True)` |
|
|
337
|
-
| `ds()` | `mg.show(mg.get_call_stack(), block=True)` |
|
|
336
|
+
To simplify debugging without a debugger tool, we offer these blocking alias functions that you can insert into your code at a specific point to visualize a graph:
|
|
338
337
|
|
|
339
|
-
|
|
340
|
-
|
|
341
|
-
|
|
342
|
-
|
|
343
|
-
- data: defaults to locals() and mg.get_call_stack() respectively
|
|
344
|
-
- graph: if True the data is visualized as a graph
|
|
345
|
-
- log: if True the data is printed
|
|
346
|
-
- block: if True the function blocks until the <Enter> key is pressed
|
|
347
|
-
|
|
348
|
-
To print to a log file instead of standard output use:
|
|
349
|
-
```python
|
|
350
|
-
mg.log_file = open("my_log_file.txt", "w")
|
|
351
|
-
```
|
|
338
|
+
| alias | purpose | function call |
|
|
339
|
+
|:---|:---|:---|
|
|
340
|
+
| `mg.l()` | graph **l**ocal variables | `mg.block(mg.show, locals())` |
|
|
341
|
+
| `mg.s()` | graph the call **s**tack | `mg.block(mg.show, mg.get_call_stack())` |
|
|
352
342
|
|
|
353
343
|
For example, executing this program:
|
|
354
344
|
|
|
355
345
|
```python
|
|
356
|
-
|
|
357
|
-
from memory_graph import d, ds
|
|
346
|
+
from memory_graph as mg
|
|
358
347
|
|
|
359
348
|
squares = []
|
|
360
349
|
squares_collector = []
|
|
361
350
|
for i in range(1, 6):
|
|
362
351
|
squares.append(i**2)
|
|
363
352
|
squares_collector.append(squares.copy())
|
|
364
|
-
|
|
353
|
+
mg.l() # graph local variables
|
|
365
354
|
```
|
|
366
|
-
and pressing <Enter> a number of times,
|
|
355
|
+
and pressing <Enter> a number of times, results in:
|
|
367
356
|
|
|
368
357
|

|
|
369
|
-
```
|
|
370
|
-
squares: [1, 4, 9, 16, 25]
|
|
371
|
-
squares_collector: [[1], [1, 4], [1, 4, 9], [1, 4, 9, 16], [1, 4, 9, 16, 25]]
|
|
372
|
-
i: 5
|
|
373
|
-
```
|
|
374
|
-
|
|
375
358
|
|
|
376
359
|
## Datastructure Examples ##
|
|
377
360
|
Module memory_graph can be very useful in a course about datastructures, some examples:
|
|
@@ -404,7 +387,7 @@ class LinkedList:
|
|
|
404
387
|
new_node.next = self.head
|
|
405
388
|
self.head.prev = new_node
|
|
406
389
|
self.head = new_node
|
|
407
|
-
mg.show
|
|
390
|
+
mg.block(mg.show, locals()) # <--- draw graph
|
|
408
391
|
|
|
409
392
|
linked_list = LinkedList()
|
|
410
393
|
n = 100
|
|
@@ -443,7 +426,7 @@ class BinTree:
|
|
|
443
426
|
node.larger = Node(new_value)
|
|
444
427
|
else:
|
|
445
428
|
self.add_recursive(new_value, node.larger)
|
|
446
|
-
mg.show
|
|
429
|
+
mg.block(mg.show, locals()) # <--- draw graph
|
|
447
430
|
|
|
448
431
|
def add(self, value):
|
|
449
432
|
if self.root is None:
|
|
@@ -476,7 +459,7 @@ class HashSet:
|
|
|
476
459
|
self.buckets[index] = []
|
|
477
460
|
bucket = self.buckets[index]
|
|
478
461
|
bucket.append(value)
|
|
479
|
-
mg.show
|
|
462
|
+
mg.block(mg.show, locals()) # <--- draw graph
|
|
480
463
|
|
|
481
464
|
def contains(self, value):
|
|
482
465
|
index = hash(value) % len(self.buckets)
|
|
@@ -499,10 +482,10 @@ for i in range(n):
|
|
|
499
482
|
|
|
500
483
|
|
|
501
484
|
## Configuration ##
|
|
502
|
-
Different aspects of memory_graph can be configured. The default configuration is reset by importing '
|
|
485
|
+
Different aspects of memory_graph can be configured. The default configuration is reset by importing 'memory_graph.config_default'.
|
|
503
486
|
|
|
504
|
-
- ***mg.config.
|
|
505
|
-
- The maxium
|
|
487
|
+
- ***mg.config.max_tree_depth*** : int
|
|
488
|
+
- The maxium depth of the graph. A `★` symbol indictes where the graph is cut short.
|
|
506
489
|
|
|
507
490
|
- ***mg.config.max_string_length*** : int
|
|
508
491
|
- The maximum length of strings shown in the graph. Longer strings will be truncated.
|
|
@@ -547,7 +530,7 @@ mg.show( locals(),
|
|
|
547
530
|
Different extensions are available for types from other Python packages.
|
|
548
531
|
|
|
549
532
|
### Numpy ###
|
|
550
|
-
Numpy types `arrray` and `matrix` and `ndarray` can be graphed with
|
|
533
|
+
Numpy types `arrray` and `matrix` and `ndarray` can be graphed with "memory_graph.extension_numpy":
|
|
551
534
|
|
|
552
535
|
```python
|
|
553
536
|
import memory_graph as mg
|
|
@@ -558,12 +541,12 @@ np.random.seed(0) # use same random numbers each run
|
|
|
558
541
|
array = np.array([1.1, 2, 3, 4, 5])
|
|
559
542
|
matrix = np.matrix([[i*20+j for j in range(20)] for i in range(20)])
|
|
560
543
|
ndarray = np.random.rand(20,20)
|
|
561
|
-
mg.show(locals()
|
|
544
|
+
mg.show(locals())
|
|
562
545
|
```
|
|
563
546
|

|
|
564
547
|
|
|
565
548
|
### Pandas ###
|
|
566
|
-
Pandas types `Series` and `DataFrame` can be graphed with
|
|
549
|
+
Pandas types `Series` and `DataFrame` can be graphed with "memory_graph.extension_pandas":
|
|
567
550
|
|
|
568
551
|
```python
|
|
569
552
|
import memory_graph as mg
|
|
@@ -577,7 +560,7 @@ dataframe2 = pd.DataFrame({ 'Name' : [ 'Tom', 'Anna', 'Steve', 'Lisa'],
|
|
|
577
560
|
'Age' : [ 28, 34, 29, 42],
|
|
578
561
|
'Length' : [ 1.70, 1.66, 1.82, 1.73] },
|
|
579
562
|
index=['one', 'two', 'three', 'four']) # with row names
|
|
580
|
-
mg.show(locals()
|
|
563
|
+
mg.show(locals())
|
|
581
564
|
```
|
|
582
565
|

|
|
583
566
|
|
|
@@ -591,6 +574,6 @@ See for example [jupyter_example.ipynb](https://raw.githubusercontent.com/bterwi
|
|
|
591
574
|
|
|
592
575
|
## Troubleshooting ##
|
|
593
576
|
|
|
594
|
-
- Adobe Acrobat Reader [doesn't refresh a PDF file](https://superuser.com/questions/337011/windows-pdf-viewer-that-auto-refreshes-pdf-when-compiling-with-pdflatex) when it changes on disk and blocks updates which results in an `Could not open 'somefile.pdf' for writing : Permission denied` error. One solution is to install a PDF reader that does refresh ([Evince](https://www.fosshub.com/Evince.html)
|
|
577
|
+
- Adobe Acrobat Reader [doesn't refresh a PDF file](https://superuser.com/questions/337011/windows-pdf-viewer-that-auto-refreshes-pdf-when-compiling-with-pdflatex) when it changes on disk and blocks updates which results in an `Could not open 'somefile.pdf' for writing : Permission denied` error. One solution is to install a PDF reader that does refresh ([Evince](https://www.fosshub.com/Evince.html), [Okular](https://okular.kde.org/), [SumatraPDF](https://www.sumatrapdfreader.org/), ...) and set it as the default PDF reader. Another solution is to `render()` the graph to a different output format and to open it manually.
|
|
595
578
|
|
|
596
579
|
- When graph edges overlap it can be hard to distinguish them. Using an interactive graphviz viewer, such as [xdot](https://github.com/jrfonseca/xdot.py), on a '*.gv' DOT output file will help.
|
|
@@ -7,7 +7,7 @@ long_description_from_readme = (this_directory / "README.md").read_text()
|
|
|
7
7
|
|
|
8
8
|
setup(
|
|
9
9
|
name = 'memory_graph',
|
|
10
|
-
version = '0.3.
|
|
10
|
+
version = '0.3.07',
|
|
11
11
|
description = 'Draws a graph of your data to analyze its structure.',
|
|
12
12
|
long_description = long_description_from_readme,
|
|
13
13
|
long_description_content_type = 'text/markdown',
|
|
File without changes
|
|
File without changes
|
|
File without changes
|
|
File without changes
|
|
File without changes
|
|
File without changes
|
|
File without changes
|
|
File without changes
|
|
File without changes
|
|
File without changes
|
|
File without changes
|
|
File without changes
|
|
File without changes
|
|
File without changes
|
|
File without changes
|
|
File without changes
|
|
File without changes
|
|
File without changes
|
|
File without changes
|
|
File without changes
|
|
File without changes
|
|
File without changes
|
|
File without changes
|
|
File without changes
|
|
File without changes
|
|
File without changes
|
|
File without changes
|
|
File without changes
|
|
File without changes
|
|
File without changes
|
|
File without changes
|
|
File without changes
|
|
File without changes
|