memory-graph 0.3.64__tar.gz → 0.3.66__tar.gz
This diff represents the content of publicly available package versions that have been released to one of the supported registries. The information contained in this diff is provided for informational purposes only and reflects changes between package versions as they appear in their respective public registries.
- {memory_graph-0.3.64 → memory_graph-0.3.66}/PKG-INFO +38 -30
- {memory_graph-0.3.64 → memory_graph-0.3.66}/README.md +37 -29
- {memory_graph-0.3.64 → memory_graph-0.3.66}/memory_graph/__init__.py +24 -1
- {memory_graph-0.3.64 → memory_graph-0.3.66}/memory_graph/config.py +1 -1
- memory_graph-0.3.66/memory_graph/extension_numpy.py +48 -0
- memory_graph-0.3.66/memory_graph/extension_pandas.py +36 -0
- memory_graph-0.3.66/memory_graph/extension_torch.py +19 -0
- {memory_graph-0.3.64 → memory_graph-0.3.66}/memory_graph/node_linear.py +6 -6
- {memory_graph-0.3.64 → memory_graph-0.3.66}/memory_graph.egg-info/PKG-INFO +38 -30
- {memory_graph-0.3.64 → memory_graph-0.3.66}/pyproject.toml +1 -1
- memory_graph-0.3.64/memory_graph/extension_numpy.py +0 -33
- memory_graph-0.3.64/memory_graph/extension_pandas.py +0 -26
- memory_graph-0.3.64/memory_graph/extension_torch.py +0 -6
- {memory_graph-0.3.64 → memory_graph-0.3.66}/LICENSE.txt +0 -0
- {memory_graph-0.3.64 → memory_graph-0.3.66}/memory_graph/call_stack.py +0 -0
- {memory_graph-0.3.64 → memory_graph-0.3.66}/memory_graph/config_default.py +0 -0
- {memory_graph-0.3.64 → memory_graph-0.3.66}/memory_graph/config_helpers.py +0 -0
- {memory_graph-0.3.64 → memory_graph-0.3.66}/memory_graph/html_table.py +0 -0
- {memory_graph-0.3.64 → memory_graph-0.3.66}/memory_graph/list_view.py +0 -0
- {memory_graph-0.3.64 → memory_graph-0.3.66}/memory_graph/memory_to_nodes.py +0 -0
- {memory_graph-0.3.64 → memory_graph-0.3.66}/memory_graph/node_base.py +0 -0
- {memory_graph-0.3.64 → memory_graph-0.3.66}/memory_graph/node_key_value.py +0 -0
- {memory_graph-0.3.64 → memory_graph-0.3.66}/memory_graph/node_leaf.py +0 -0
- {memory_graph-0.3.64 → memory_graph-0.3.66}/memory_graph/node_table.py +0 -0
- {memory_graph-0.3.64 → memory_graph-0.3.66}/memory_graph/sequence.py +0 -0
- {memory_graph-0.3.64 → memory_graph-0.3.66}/memory_graph/slicer.py +0 -0
- {memory_graph-0.3.64 → memory_graph-0.3.66}/memory_graph/slices.py +0 -0
- {memory_graph-0.3.64 → memory_graph-0.3.66}/memory_graph/slices_iterator.py +0 -0
- {memory_graph-0.3.64 → memory_graph-0.3.66}/memory_graph/slices_table_iterator.py +0 -0
- {memory_graph-0.3.64 → memory_graph-0.3.66}/memory_graph/test.py +0 -0
- {memory_graph-0.3.64 → memory_graph-0.3.66}/memory_graph/test_max_graph_depth.py +0 -0
- {memory_graph-0.3.64 → memory_graph-0.3.66}/memory_graph/test_memory_graph.py +0 -0
- {memory_graph-0.3.64 → memory_graph-0.3.66}/memory_graph/test_memory_to_nodes.py +0 -0
- {memory_graph-0.3.64 → memory_graph-0.3.66}/memory_graph/test_sequence.py +0 -0
- {memory_graph-0.3.64 → memory_graph-0.3.66}/memory_graph/test_slicer.py +0 -0
- {memory_graph-0.3.64 → memory_graph-0.3.66}/memory_graph/test_slices.py +0 -0
- {memory_graph-0.3.64 → memory_graph-0.3.66}/memory_graph/test_slices_iterator.py +0 -0
- {memory_graph-0.3.64 → memory_graph-0.3.66}/memory_graph/utils.py +0 -0
- {memory_graph-0.3.64 → memory_graph-0.3.66}/memory_graph.egg-info/SOURCES.txt +0 -0
- {memory_graph-0.3.64 → memory_graph-0.3.66}/memory_graph.egg-info/dependency_links.txt +0 -0
- {memory_graph-0.3.64 → memory_graph-0.3.66}/memory_graph.egg-info/requires.txt +0 -0
- {memory_graph-0.3.64 → memory_graph-0.3.66}/memory_graph.egg-info/top_level.txt +0 -0
- {memory_graph-0.3.64 → memory_graph-0.3.66}/setup.cfg +0 -0
- {memory_graph-0.3.64 → memory_graph-0.3.66}/setup.py +0 -0
|
@@ -1,6 +1,6 @@
|
|
|
1
1
|
Metadata-Version: 2.4
|
|
2
2
|
Name: memory_graph
|
|
3
|
-
Version: 0.3.
|
|
3
|
+
Version: 0.3.66
|
|
4
4
|
Summary: Teaching tool and debugging aid in context of references, mutable data types, and shallow and deep copy.
|
|
5
5
|
Author-email: Bas Terwijn <bterwijn@gmail.com>
|
|
6
6
|
License-Expression: BSD-2-Clause
|
|
@@ -30,11 +30,11 @@ Additionally [Graphviz](https://graphviz.org/download/) needs to be installed.
|
|
|
30
30
|
Run a live demo in the 👉 [**Memory Graph Web Debugger**](https://memory-graph.com/#breakpoints=8&continues=1×tep=1.0&play) 👈 now, no installation required!
|
|
31
31
|
|
|
32
32
|
- learn the right **mental model** to think about Python data (references, mutability, shallow vs deep copy)
|
|
33
|
-
- **visualize the structure of your data** to easily understand and debug any data structure
|
|
33
|
+
- **visualize the structure of your data** to more easily understand and debug any data structure
|
|
34
34
|
- understand function calls, variable scope, and the **complete program state** through call stack visualization
|
|
35
35
|
|
|
36
36
|
An example Binary Tree data structure:
|
|
37
|
-
|
|
38
38
|
Or see it in the [Memory Grah Web Debugger](https://memory-graph.com/#codeurl=https://raw.githubusercontent.com/bterwijn/memory_graph/refs/heads/main/src/bin_tree.py×tep=0.2&play).
|
|
39
39
|
|
|
40
40
|
# Videos #
|
|
@@ -43,7 +43,7 @@ Or see it in the [Memory Grah Web Debugger](https://memory-graph.com/#codeurl=ht
|
|
|
43
43
|
| [Quick Intro (3:49)](https://www.youtube.com/watch?v=23_bHcr7hqo) | [Mutability (17:29)](https://www.youtube.com/watch?v=pvIJgHCaXhU) |
|
|
44
44
|
|
|
45
45
|
# Memory Graph #
|
|
46
|
-
For program understanding and debugging, the [memory_graph](https://
|
|
46
|
+
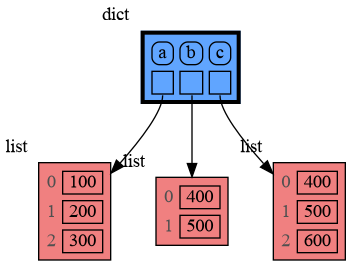
For program understanding and debugging, the [memory_graph](https://github.com/bterwijn/memory_graph) package can visualize your data, supporting many different data types, including but not limited to:
|
|
47
47
|
|
|
48
48
|
```python
|
|
49
49
|
import memory_graph as mg
|
|
@@ -69,7 +69,7 @@ mg.render(data, "my_graph.gv") # Graphviz DOT file
|
|
|
69
69
|
mg.render(data) # renders to default: 'memory_graph.pdf'
|
|
70
70
|
```
|
|
71
71
|
|
|
72
|
-
# Sharing Values #
|
|
72
|
+
# Sharing Values, Aliasing #
|
|
73
73
|
In Python, assigning a list from variable `a` to variable `b` causes both variables to reference the same list value and thus share it. Consequently, any change applied through one variable will impact the other. This behavior can lead to elusive bugs if a programmer incorrectly assumes that list `a` and `b` are independent.
|
|
74
74
|
|
|
75
75
|
<table><tr><td>
|
|
@@ -86,7 +86,7 @@ b.append(1) # changing 'b' changes 'a'
|
|
|
86
86
|
print('a:', a)
|
|
87
87
|
print('b:', b)
|
|
88
88
|
|
|
89
|
-
# check if 'a' and 'b' share
|
|
89
|
+
# check if 'a' and 'b' share the list
|
|
90
90
|
print('ids:', id(a), id(b))
|
|
91
91
|
print('identical?:', a is b)
|
|
92
92
|
|
|
@@ -98,18 +98,18 @@ mg.show( locals() )
|
|
|
98
98
|
|
|
99
99
|
|
|
100
100
|
|
|
101
|
-
a graph showing `a` and `b` share
|
|
101
|
+
a graph showing `a` and `b` share the list
|
|
102
102
|
|
|
103
103
|
</td></tr></table>
|
|
104
104
|
|
|
105
|
-
The fact that `a` and `b` share
|
|
105
|
+
The fact that `a` and `b` share the list can not be verified by printing the lists. It can be verified by comparing the identity of both variables using the `id()` function or by using the `is` comparison operator as shown in the program output below, but this quickly becomes impractical for larger programs.
|
|
106
106
|
```{verbatim}
|
|
107
107
|
a: 4, 3, 2, 1
|
|
108
108
|
b: 4, 3, 2, 1
|
|
109
109
|
ids: 126432214913216 126432214913216
|
|
110
110
|
identical?: True
|
|
111
111
|
```
|
|
112
|
-
A better way to understand what values are shared is to draw a graph using [memory_graph](https://
|
|
112
|
+
A better way to understand what values are shared is to draw a graph using [memory_graph](https://github.com/bterwijn/memory_graph).
|
|
113
113
|
|
|
114
114
|
# Topics #
|
|
115
115
|
|
|
@@ -161,7 +161,7 @@ Bas Terwijn
|
|
|
161
161
|
## Inspiration ##
|
|
162
162
|
Inspired by [Python Tutor](https://pythontutor.com/).
|
|
163
163
|
|
|
164
|
-
The main
|
|
164
|
+
The main differences are that by running memory_graph locally we support Python Tutor’s [unsupported features](https://github.com/pythontutor-dev/pythontutor/blob/master/unsupported-features.md#unsupported-features) so that it scales to full programs in many environments and IDEs instead of just code snippets in a webbrowser, and by mirroring the data’s hierarchy we improve graph readability for larger graphs.
|
|
165
165
|
|
|
166
166
|
## Social Media #
|
|
167
167
|
* [LinkedIn](https://www.linkedin.com/groups/13244150/)
|
|
@@ -271,22 +271,28 @@ mg.show(locals())
|
|
|
271
271
|
Or see it in the [Memory Grah Web Debugger](https://memory-graph.com/#codeurl=https://raw.githubusercontent.com/bterwijn/memory_graph/refs/heads/main/src/custom_copy.py&breakpoints=15&continues=1&play).
|
|
272
272
|
|
|
273
273
|
## Name Rebinding ##
|
|
274
|
-
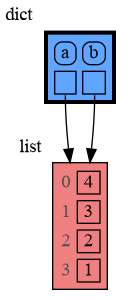
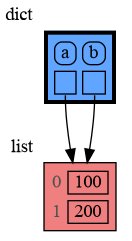
When `a` and `b` share a mutable value, then changing the value of `b` changes the value of `a` and vice versa. However, reassigning `b` does not change `a`. When you reassign `b`, you only **rebind** the name `b` to another value without affecting any other variable.
|
|
274
|
+
When `a` and `b` share a mutable value, then changing the value of `b` changes the value of `a` and vice versa. However, reassigning `b` does not change `a`. When you reassign `b`, you only **rebind** the name `b` to another value without affecting any other variable.
|
|
275
|
+
|
|
276
|
+
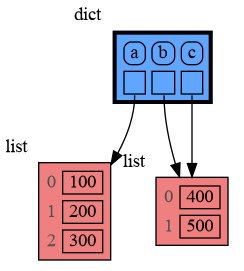
Also note the difference between statement `b += [1]` that changes `b` and `a`, and statement `c = c + [300]` that first creates the new value `c + [300]` and assigns this value to `c` without effecting `b`. This shows that `x += y` is not the same as `x = x + y` for values of mutable type.
|
|
275
277
|
|
|
276
278
|
```python
|
|
277
279
|
import memory_graph as mg
|
|
278
280
|
|
|
279
|
-
a = [
|
|
281
|
+
a = [100, 200]
|
|
280
282
|
b = a
|
|
281
283
|
mg.render(locals(), 'rebinding1.png')
|
|
282
284
|
|
|
283
|
-
b += [
|
|
284
|
-
b = [
|
|
285
|
+
b += [300] # changes the value of 'b' and 'a'
|
|
286
|
+
b = [400, 500] # rebinds 'b' to a new value, 'a' is unaffected
|
|
287
|
+
c = b
|
|
285
288
|
mg.render(locals(), 'rebinding2.png')
|
|
289
|
+
|
|
290
|
+
c = c + [600] # rebinds 'c' to new value 'c + [600]', `b` is unaffected
|
|
291
|
+
mg.render(locals(), 'rebinding3.png')
|
|
286
292
|
```
|
|
287
|
-
|  |  |
|
|
288
|
-
|
|
289
|
-
| rebinding1.png | rebinding2.png |
|
|
293
|
+
|  |  |  |
|
|
294
|
+
|:--------------:|:--------------:|:--------------:|
|
|
295
|
+
| rebinding1.png | rebinding2.png | rebinding3.png |
|
|
290
296
|
|
|
291
297
|
Or see it in the [Memory Grah Web Debugger](https://memory-graph.com/#codeurl=https://raw.githubusercontent.com/bterwijn/memory_graph/refs/heads/main/src/rebind.py&play).
|
|
292
298
|
|
|
@@ -314,7 +320,7 @@ When copying a mix of values of mutable and immutable type, to save on time and
|
|
|
314
320
|
import memory_graph as mg
|
|
315
321
|
import copy
|
|
316
322
|
|
|
317
|
-
a = ( [1, 2], ('x', 'y') ) # mix of mutable and immutable
|
|
323
|
+
a = ( [1, 2], ('x', 'y') ) # mix of mutable and immutable values
|
|
318
324
|
|
|
319
325
|
# three different ways to make a "copy" of 'a':
|
|
320
326
|
c1 = a
|
|
@@ -381,7 +387,7 @@ The effect of calling `add_one()` is that `b[0]` increases by 1, while `a` is un
|
|
|
381
387
|
|
|
382
388
|
# Data Model Exercises #
|
|
383
389
|
|
|
384
|
-
Now is a good time to practice with Python Data Model concepts. Here are [some exercises](https://github.com/bterwijn/memory_graph_videos/blob/main/exercises/exercises.md) on references, mutability, copies, and function calls.
|
|
390
|
+
Now is a good time to practice with these Python Data Model concepts. Here are [some exercises](https://github.com/bterwijn/memory_graph_videos/blob/main/exercises/exercises.md) on references, mutability, copies, and function calls. Also see the programming exercises at [the end of the Mutability video](https://www.youtube.com/watch?v=pvIJgHCaXhU&t=891s).
|
|
385
391
|
|
|
386
392
|
# Block #
|
|
387
393
|
It is often helpful to temporarily block program execution to inspect the graph. For this we can use the `mg.block()` function:
|
|
@@ -394,7 +400,7 @@ This function:
|
|
|
394
400
|
* first executes `fun(arg1, arg2, ...)`
|
|
395
401
|
* then prints the current source location in the program
|
|
396
402
|
* then blocks execution until the <Enter> key is pressed
|
|
397
|
-
*
|
|
403
|
+
* and returns the return value of the `fun()` call
|
|
398
404
|
|
|
399
405
|
## Recursion ##
|
|
400
406
|
The call stack is also helpful to visualize how recursion works. Here we use `mg.block()` to show each step of how recursively `factorial(4)` is computed:
|
|
@@ -773,9 +779,9 @@ Different aspects of memory_graph can be configured. The default configuration c
|
|
|
773
779
|
|
|
774
780
|
|
|
775
781
|
## Simplified Graph ##
|
|
776
|
-
Memory_graph simplifies the visualization (and the viewer's mental model) by **not** showing separate nodes for immutable types like `bool`, `int`, `float`, `complex`, and `str` by default. This simplification can sometimes be slightly misleading. As in the example below, after a shallow copy, lists `a` and `b` technically share their `int` values, but the graph makes it appear as though `a` and `b` each have their own copies. However, since `int` is immutable, this simplification will never lead to unexpected changes (changing `a` won’t affect `b`) so will never result in bugs.
|
|
782
|
+
Memory_graph simplifies the visualization (and the viewer's mental model) by **not** showing separate nodes for immutable types like `bool`, `int`, `float`, `complex`, and `str` by default. This simplification can sometimes be slightly misleading. As in the example below, after a shallow copy, lists `a` and `b` technically share their `int` values, but the graph makes it appear as though `a` and `b` each have their own copies. However, since `int` is immutable, this simplification will never lead to unexpected changes (changing `a`'s ints won’t affect `b`) so will never result in bugs.
|
|
777
783
|
|
|
778
|
-
The simplification strikes a balance: it is slightly misleading but keeps the graph clean and easy to understand
|
|
784
|
+
The simplification strikes a balance: it is slightly misleading but keeps the graph clean and easy to understand to focus on mutable types where unexpected changes can occur. This is why it is the default behavior. If you do want to show separate nodes for `int` values, such as for educational purposes, you can simply remove `int` from the `mg.config.embedded_types` set:
|
|
779
785
|
```python
|
|
780
786
|
import memory_graph as mg
|
|
781
787
|
|
|
@@ -809,7 +815,7 @@ tree.insert(15, "fifteen")
|
|
|
809
815
|
|
|
810
816
|
mg.show(locals())
|
|
811
817
|
```
|
|
812
|
-
|
|
813
819
|
|
|
814
820
|
## All attributes using dir() ##
|
|
815
821
|
A useful start is to give it some color, show the list of all its attributes using `dir()`, and setting an empty Slicer to see the attribute list in full.
|
|
@@ -980,6 +986,8 @@ mg.config.type_to_node[List_View] = (lambda l: mg.Node_Linear(l,
|
|
|
980
986
|
```
|
|
981
987
|

|
|
982
988
|
|
|
989
|
+
Or see it in the [Memory Grah Web Debugger](https://memory-graph.com/#codeurl=https://raw.githubusercontent.com/bterwijn/memory_graph/refs/heads/main/src/bin_search.py&breakpoints=32&continues=1×tep=0.5&play)
|
|
990
|
+
|
|
983
991
|
# Graph Depth #
|
|
984
992
|
To limit the size of the graph the maximum depth of the graph is set by `mg.config.max_graph_depth`. Additionally for each type a depth can be set to further limit the graph, as is done for type `B` in the example below. Scissors indicate where the graph is cut short. Alternatively the `id()` of a data elements can be used to limit the graph for that specific element, as is done for the value referenced by variable `c`.
|
|
985
993
|
|
|
@@ -1052,12 +1060,12 @@ mg.show(locals())
|
|
|
1052
1060
|
Different extensions are available for types from other Python packages.
|
|
1053
1061
|
|
|
1054
1062
|
## Numpy ##
|
|
1055
|
-
Numpy types `array` and `matrix` and `ndarray
|
|
1063
|
+
For Numpy types `array` and `matrix` and `ndarray`, use `mg.extend_numpy()`:
|
|
1056
1064
|
|
|
1057
1065
|
```python
|
|
1058
1066
|
import memory_graph as mg
|
|
1059
1067
|
import numpy as np
|
|
1060
|
-
|
|
1068
|
+
mg.extend_numpy()
|
|
1061
1069
|
np.random.seed(0) # use same random numbers each run
|
|
1062
1070
|
|
|
1063
1071
|
matrix = np.matrix([[i*5+j for j in range(4)] for i in range(5)])
|
|
@@ -1072,12 +1080,12 @@ mg.show(locals())
|
|
|
1072
1080
|
Or see it in the [Memory Grah Web Debugger](https://memory-graph.com/#micropip=numpy&codeurl=https://raw.githubusercontent.com/bterwijn/memory_graph/refs/heads/main/src/mg_numpy.py&continues=1).
|
|
1073
1081
|
|
|
1074
1082
|
## Pandas ##
|
|
1075
|
-
|
|
1083
|
+
For pandas types `Series` and `DataFrame`, use `mg.extend_pandas()`:
|
|
1076
1084
|
|
|
1077
1085
|
```python
|
|
1078
1086
|
import memory_graph as mg
|
|
1079
1087
|
import pandas as pd
|
|
1080
|
-
|
|
1088
|
+
mg.extend_pandas()
|
|
1081
1089
|
|
|
1082
1090
|
series = pd.Series( [i for i in range(20)] )
|
|
1083
1091
|
dataframe1 = pd.DataFrame({ "calories": [420, 380, 390],
|
|
@@ -1093,12 +1101,12 @@ mg.show(locals())
|
|
|
1093
1101
|
Or see it in the [Memory Grah Web Debugger](https://memory-graph.com/#micropip=pandas&codeurl=https://raw.githubusercontent.com/bterwijn/memory_graph/refs/heads/main/src/mg_pandas.py&continues=1).
|
|
1094
1102
|
|
|
1095
1103
|
## PyTorch ##
|
|
1096
|
-
|
|
1104
|
+
For torch type `tensor`, use `mg.extend_torch()`:
|
|
1097
1105
|
|
|
1098
1106
|
```python
|
|
1099
1107
|
import memory_graph as mg
|
|
1100
1108
|
import torch
|
|
1101
|
-
|
|
1109
|
+
mg.extend_torch()
|
|
1102
1110
|
torch.manual_seed(0) # same random numbers each run
|
|
1103
1111
|
|
|
1104
1112
|
tensor_1d = torch.rand(3)
|
|
@@ -1171,4 +1179,4 @@ $ bash create_gif.sh animated
|
|
|
1171
1179
|
- When graph edges overlap it can be hard to distinguish them. Using an interactive graphviz viewer, such as [xdot](https://github.com/jrfonseca/xdot.py), on a '*.gv' DOT output file will help.
|
|
1172
1180
|
|
|
1173
1181
|
# Other Packages #
|
|
1174
|
-
The [memory_graph](https://
|
|
1182
|
+
The [memory_graph](https://github.com/bterwijn/memory_graph) package visualizes your data. If instead you want to visualize function calls, check out the [invocation_tree](https://github.com/bterwijn/invocation_tree) package.
|
|
@@ -10,11 +10,11 @@ Additionally [Graphviz](https://graphviz.org/download/) needs to be installed.
|
|
|
10
10
|
Run a live demo in the 👉 [**Memory Graph Web Debugger**](https://memory-graph.com/#breakpoints=8&continues=1×tep=1.0&play) 👈 now, no installation required!
|
|
11
11
|
|
|
12
12
|
- learn the right **mental model** to think about Python data (references, mutability, shallow vs deep copy)
|
|
13
|
-
- **visualize the structure of your data** to easily understand and debug any data structure
|
|
13
|
+
- **visualize the structure of your data** to more easily understand and debug any data structure
|
|
14
14
|
- understand function calls, variable scope, and the **complete program state** through call stack visualization
|
|
15
15
|
|
|
16
16
|
An example Binary Tree data structure:
|
|
17
|
-

|
|
18
18
|
Or see it in the [Memory Grah Web Debugger](https://memory-graph.com/#codeurl=https://raw.githubusercontent.com/bterwijn/memory_graph/refs/heads/main/src/bin_tree.py×tep=0.2&play).
|
|
19
19
|
|
|
20
20
|
# Videos #
|
|
@@ -23,7 +23,7 @@ Or see it in the [Memory Grah Web Debugger](https://memory-graph.com/#codeurl=ht
|
|
|
23
23
|
| [Quick Intro (3:49)](https://www.youtube.com/watch?v=23_bHcr7hqo) | [Mutability (17:29)](https://www.youtube.com/watch?v=pvIJgHCaXhU) |
|
|
24
24
|
|
|
25
25
|
# Memory Graph #
|
|
26
|
-
For program understanding and debugging, the [memory_graph](https://
|
|
26
|
+
For program understanding and debugging, the [memory_graph](https://github.com/bterwijn/memory_graph) package can visualize your data, supporting many different data types, including but not limited to:
|
|
27
27
|
|
|
28
28
|
```python
|
|
29
29
|
import memory_graph as mg
|
|
@@ -49,7 +49,7 @@ mg.render(data, "my_graph.gv") # Graphviz DOT file
|
|
|
49
49
|
mg.render(data) # renders to default: 'memory_graph.pdf'
|
|
50
50
|
```
|
|
51
51
|
|
|
52
|
-
# Sharing Values #
|
|
52
|
+
# Sharing Values, Aliasing #
|
|
53
53
|
In Python, assigning a list from variable `a` to variable `b` causes both variables to reference the same list value and thus share it. Consequently, any change applied through one variable will impact the other. This behavior can lead to elusive bugs if a programmer incorrectly assumes that list `a` and `b` are independent.
|
|
54
54
|
|
|
55
55
|
<table><tr><td>
|
|
@@ -66,7 +66,7 @@ b.append(1) # changing 'b' changes 'a'
|
|
|
66
66
|
print('a:', a)
|
|
67
67
|
print('b:', b)
|
|
68
68
|
|
|
69
|
-
# check if 'a' and 'b' share
|
|
69
|
+
# check if 'a' and 'b' share the list
|
|
70
70
|
print('ids:', id(a), id(b))
|
|
71
71
|
print('identical?:', a is b)
|
|
72
72
|
|
|
@@ -78,18 +78,18 @@ mg.show( locals() )
|
|
|
78
78
|
|
|
79
79
|

|
|
80
80
|
|
|
81
|
-
a graph showing `a` and `b` share
|
|
81
|
+
a graph showing `a` and `b` share the list
|
|
82
82
|
|
|
83
83
|
</td></tr></table>
|
|
84
84
|
|
|
85
|
-
The fact that `a` and `b` share
|
|
85
|
+
The fact that `a` and `b` share the list can not be verified by printing the lists. It can be verified by comparing the identity of both variables using the `id()` function or by using the `is` comparison operator as shown in the program output below, but this quickly becomes impractical for larger programs.
|
|
86
86
|
```{verbatim}
|
|
87
87
|
a: 4, 3, 2, 1
|
|
88
88
|
b: 4, 3, 2, 1
|
|
89
89
|
ids: 126432214913216 126432214913216
|
|
90
90
|
identical?: True
|
|
91
91
|
```
|
|
92
|
-
A better way to understand what values are shared is to draw a graph using [memory_graph](https://
|
|
92
|
+
A better way to understand what values are shared is to draw a graph using [memory_graph](https://github.com/bterwijn/memory_graph).
|
|
93
93
|
|
|
94
94
|
# Topics #
|
|
95
95
|
|
|
@@ -141,7 +141,7 @@ Bas Terwijn
|
|
|
141
141
|
## Inspiration ##
|
|
142
142
|
Inspired by [Python Tutor](https://pythontutor.com/).
|
|
143
143
|
|
|
144
|
-
The main
|
|
144
|
+
The main differences are that by running memory_graph locally we support Python Tutor’s [unsupported features](https://github.com/pythontutor-dev/pythontutor/blob/master/unsupported-features.md#unsupported-features) so that it scales to full programs in many environments and IDEs instead of just code snippets in a webbrowser, and by mirroring the data’s hierarchy we improve graph readability for larger graphs.
|
|
145
145
|
|
|
146
146
|
## Social Media #
|
|
147
147
|
* [LinkedIn](https://www.linkedin.com/groups/13244150/)
|
|
@@ -251,22 +251,28 @@ mg.show(locals())
|
|
|
251
251
|
Or see it in the [Memory Grah Web Debugger](https://memory-graph.com/#codeurl=https://raw.githubusercontent.com/bterwijn/memory_graph/refs/heads/main/src/custom_copy.py&breakpoints=15&continues=1&play).
|
|
252
252
|
|
|
253
253
|
## Name Rebinding ##
|
|
254
|
-
When `a` and `b` share a mutable value, then changing the value of `b` changes the value of `a` and vice versa. However, reassigning `b` does not change `a`. When you reassign `b`, you only **rebind** the name `b` to another value without affecting any other variable.
|
|
254
|
+
When `a` and `b` share a mutable value, then changing the value of `b` changes the value of `a` and vice versa. However, reassigning `b` does not change `a`. When you reassign `b`, you only **rebind** the name `b` to another value without affecting any other variable.
|
|
255
|
+
|
|
256
|
+
Also note the difference between statement `b += [1]` that changes `b` and `a`, and statement `c = c + [300]` that first creates the new value `c + [300]` and assigns this value to `c` without effecting `b`. This shows that `x += y` is not the same as `x = x + y` for values of mutable type.
|
|
255
257
|
|
|
256
258
|
```python
|
|
257
259
|
import memory_graph as mg
|
|
258
260
|
|
|
259
|
-
a = [
|
|
261
|
+
a = [100, 200]
|
|
260
262
|
b = a
|
|
261
263
|
mg.render(locals(), 'rebinding1.png')
|
|
262
264
|
|
|
263
|
-
b += [
|
|
264
|
-
b = [
|
|
265
|
+
b += [300] # changes the value of 'b' and 'a'
|
|
266
|
+
b = [400, 500] # rebinds 'b' to a new value, 'a' is unaffected
|
|
267
|
+
c = b
|
|
265
268
|
mg.render(locals(), 'rebinding2.png')
|
|
269
|
+
|
|
270
|
+
c = c + [600] # rebinds 'c' to new value 'c + [600]', `b` is unaffected
|
|
271
|
+
mg.render(locals(), 'rebinding3.png')
|
|
266
272
|
```
|
|
267
|
-
|  |  |
|
|
268
|
-
|
|
269
|
-
| rebinding1.png | rebinding2.png |
|
|
273
|
+
|  |  |  |
|
|
274
|
+
|:--------------:|:--------------:|:--------------:|
|
|
275
|
+
| rebinding1.png | rebinding2.png | rebinding3.png |
|
|
270
276
|
|
|
271
277
|
Or see it in the [Memory Grah Web Debugger](https://memory-graph.com/#codeurl=https://raw.githubusercontent.com/bterwijn/memory_graph/refs/heads/main/src/rebind.py&play).
|
|
272
278
|
|
|
@@ -294,7 +300,7 @@ When copying a mix of values of mutable and immutable type, to save on time and
|
|
|
294
300
|
import memory_graph as mg
|
|
295
301
|
import copy
|
|
296
302
|
|
|
297
|
-
a = ( [1, 2], ('x', 'y') ) # mix of mutable and immutable
|
|
303
|
+
a = ( [1, 2], ('x', 'y') ) # mix of mutable and immutable values
|
|
298
304
|
|
|
299
305
|
# three different ways to make a "copy" of 'a':
|
|
300
306
|
c1 = a
|
|
@@ -361,7 +367,7 @@ The effect of calling `add_one()` is that `b[0]` increases by 1, while `a` is un
|
|
|
361
367
|
|
|
362
368
|
# Data Model Exercises #
|
|
363
369
|
|
|
364
|
-
Now is a good time to practice with Python Data Model concepts. Here are [some exercises](https://github.com/bterwijn/memory_graph_videos/blob/main/exercises/exercises.md) on references, mutability, copies, and function calls.
|
|
370
|
+
Now is a good time to practice with these Python Data Model concepts. Here are [some exercises](https://github.com/bterwijn/memory_graph_videos/blob/main/exercises/exercises.md) on references, mutability, copies, and function calls. Also see the programming exercises at [the end of the Mutability video](https://www.youtube.com/watch?v=pvIJgHCaXhU&t=891s).
|
|
365
371
|
|
|
366
372
|
# Block #
|
|
367
373
|
It is often helpful to temporarily block program execution to inspect the graph. For this we can use the `mg.block()` function:
|
|
@@ -374,7 +380,7 @@ This function:
|
|
|
374
380
|
* first executes `fun(arg1, arg2, ...)`
|
|
375
381
|
* then prints the current source location in the program
|
|
376
382
|
* then blocks execution until the <Enter> key is pressed
|
|
377
|
-
*
|
|
383
|
+
* and returns the return value of the `fun()` call
|
|
378
384
|
|
|
379
385
|
## Recursion ##
|
|
380
386
|
The call stack is also helpful to visualize how recursion works. Here we use `mg.block()` to show each step of how recursively `factorial(4)` is computed:
|
|
@@ -753,9 +759,9 @@ Different aspects of memory_graph can be configured. The default configuration c
|
|
|
753
759
|
|
|
754
760
|
|
|
755
761
|
## Simplified Graph ##
|
|
756
|
-
Memory_graph simplifies the visualization (and the viewer's mental model) by **not** showing separate nodes for immutable types like `bool`, `int`, `float`, `complex`, and `str` by default. This simplification can sometimes be slightly misleading. As in the example below, after a shallow copy, lists `a` and `b` technically share their `int` values, but the graph makes it appear as though `a` and `b` each have their own copies. However, since `int` is immutable, this simplification will never lead to unexpected changes (changing `a` won’t affect `b`) so will never result in bugs.
|
|
762
|
+
Memory_graph simplifies the visualization (and the viewer's mental model) by **not** showing separate nodes for immutable types like `bool`, `int`, `float`, `complex`, and `str` by default. This simplification can sometimes be slightly misleading. As in the example below, after a shallow copy, lists `a` and `b` technically share their `int` values, but the graph makes it appear as though `a` and `b` each have their own copies. However, since `int` is immutable, this simplification will never lead to unexpected changes (changing `a`'s ints won’t affect `b`) so will never result in bugs.
|
|
757
763
|
|
|
758
|
-
The simplification strikes a balance: it is slightly misleading but keeps the graph clean and easy to understand
|
|
764
|
+
The simplification strikes a balance: it is slightly misleading but keeps the graph clean and easy to understand to focus on mutable types where unexpected changes can occur. This is why it is the default behavior. If you do want to show separate nodes for `int` values, such as for educational purposes, you can simply remove `int` from the `mg.config.embedded_types` set:
|
|
759
765
|
```python
|
|
760
766
|
import memory_graph as mg
|
|
761
767
|
|
|
@@ -789,7 +795,7 @@ tree.insert(15, "fifteen")
|
|
|
789
795
|
|
|
790
796
|
mg.show(locals())
|
|
791
797
|
```
|
|
792
|
-

|
|
793
799
|
|
|
794
800
|
## All attributes using dir() ##
|
|
795
801
|
A useful start is to give it some color, show the list of all its attributes using `dir()`, and setting an empty Slicer to see the attribute list in full.
|
|
@@ -960,6 +966,8 @@ mg.config.type_to_node[List_View] = (lambda l: mg.Node_Linear(l,
|
|
|
960
966
|
```
|
|
961
967
|

|
|
962
968
|
|
|
969
|
+
Or see it in the [Memory Grah Web Debugger](https://memory-graph.com/#codeurl=https://raw.githubusercontent.com/bterwijn/memory_graph/refs/heads/main/src/bin_search.py&breakpoints=32&continues=1×tep=0.5&play)
|
|
970
|
+
|
|
963
971
|
# Graph Depth #
|
|
964
972
|
To limit the size of the graph the maximum depth of the graph is set by `mg.config.max_graph_depth`. Additionally for each type a depth can be set to further limit the graph, as is done for type `B` in the example below. Scissors indicate where the graph is cut short. Alternatively the `id()` of a data elements can be used to limit the graph for that specific element, as is done for the value referenced by variable `c`.
|
|
965
973
|
|
|
@@ -1032,12 +1040,12 @@ mg.show(locals())
|
|
|
1032
1040
|
Different extensions are available for types from other Python packages.
|
|
1033
1041
|
|
|
1034
1042
|
## Numpy ##
|
|
1035
|
-
Numpy types `array` and `matrix` and `ndarray
|
|
1043
|
+
For Numpy types `array` and `matrix` and `ndarray`, use `mg.extend_numpy()`:
|
|
1036
1044
|
|
|
1037
1045
|
```python
|
|
1038
1046
|
import memory_graph as mg
|
|
1039
1047
|
import numpy as np
|
|
1040
|
-
|
|
1048
|
+
mg.extend_numpy()
|
|
1041
1049
|
np.random.seed(0) # use same random numbers each run
|
|
1042
1050
|
|
|
1043
1051
|
matrix = np.matrix([[i*5+j for j in range(4)] for i in range(5)])
|
|
@@ -1052,12 +1060,12 @@ mg.show(locals())
|
|
|
1052
1060
|
Or see it in the [Memory Grah Web Debugger](https://memory-graph.com/#micropip=numpy&codeurl=https://raw.githubusercontent.com/bterwijn/memory_graph/refs/heads/main/src/mg_numpy.py&continues=1).
|
|
1053
1061
|
|
|
1054
1062
|
## Pandas ##
|
|
1055
|
-
|
|
1063
|
+
For pandas types `Series` and `DataFrame`, use `mg.extend_pandas()`:
|
|
1056
1064
|
|
|
1057
1065
|
```python
|
|
1058
1066
|
import memory_graph as mg
|
|
1059
1067
|
import pandas as pd
|
|
1060
|
-
|
|
1068
|
+
mg.extend_pandas()
|
|
1061
1069
|
|
|
1062
1070
|
series = pd.Series( [i for i in range(20)] )
|
|
1063
1071
|
dataframe1 = pd.DataFrame({ "calories": [420, 380, 390],
|
|
@@ -1073,12 +1081,12 @@ mg.show(locals())
|
|
|
1073
1081
|
Or see it in the [Memory Grah Web Debugger](https://memory-graph.com/#micropip=pandas&codeurl=https://raw.githubusercontent.com/bterwijn/memory_graph/refs/heads/main/src/mg_pandas.py&continues=1).
|
|
1074
1082
|
|
|
1075
1083
|
## PyTorch ##
|
|
1076
|
-
|
|
1084
|
+
For torch type `tensor`, use `mg.extend_torch()`:
|
|
1077
1085
|
|
|
1078
1086
|
```python
|
|
1079
1087
|
import memory_graph as mg
|
|
1080
1088
|
import torch
|
|
1081
|
-
|
|
1089
|
+
mg.extend_torch()
|
|
1082
1090
|
torch.manual_seed(0) # same random numbers each run
|
|
1083
1091
|
|
|
1084
1092
|
tensor_1d = torch.rand(3)
|
|
@@ -1151,4 +1159,4 @@ $ bash create_gif.sh animated
|
|
|
1151
1159
|
- When graph edges overlap it can be hard to distinguish them. Using an interactive graphviz viewer, such as [xdot](https://github.com/jrfonseca/xdot.py), on a '*.gv' DOT output file will help.
|
|
1152
1160
|
|
|
1153
1161
|
# Other Packages #
|
|
1154
|
-
The [memory_graph](https://
|
|
1162
|
+
The [memory_graph](https://github.com/bterwijn/memory_graph) package visualizes your data. If instead you want to visualize function calls, check out the [invocation_tree](https://github.com/bterwijn/invocation_tree) package.
|
|
@@ -2,7 +2,7 @@
|
|
|
2
2
|
# Copyright (c) 2023, Bas Terwijn.
|
|
3
3
|
# SPDX-License-Identifier: BSD-2-Clause
|
|
4
4
|
|
|
5
|
-
__version__ = "0.3.
|
|
5
|
+
__version__ = "0.3.66"
|
|
6
6
|
__author__ = 'Bas Terwijn'
|
|
7
7
|
|
|
8
8
|
import memory_graph.memory_to_nodes as memory_to_nodes
|
|
@@ -391,3 +391,26 @@ def stack_marimo(end_functions=["<cell line: 0>", "<module>"], stack_index=0):
|
|
|
391
391
|
globals_frame = next(iter(call_stack))
|
|
392
392
|
call_stack[globals_frame] = marimo_locals_filter(call_stack[globals_frame])
|
|
393
393
|
return call_stack
|
|
394
|
+
|
|
395
|
+
# ------------ extensions
|
|
396
|
+
|
|
397
|
+
def extend_numpy(on=True):
|
|
398
|
+
import memory_graph.extension_numpy as ext_np
|
|
399
|
+
if on:
|
|
400
|
+
ext_np.extend_numpy()
|
|
401
|
+
else:
|
|
402
|
+
ext_np.unextend_numpy()
|
|
403
|
+
|
|
404
|
+
def extend_pandas(on=True):
|
|
405
|
+
import memory_graph.extension_pandas as ext_pd
|
|
406
|
+
if on:
|
|
407
|
+
ext_pd.extend_pandas()
|
|
408
|
+
else:
|
|
409
|
+
ext_pd.unextend_pandas()
|
|
410
|
+
|
|
411
|
+
def extend_torch(on=True):
|
|
412
|
+
import memory_graph.extension_torch as ext_torch
|
|
413
|
+
if on:
|
|
414
|
+
ext_torch.extend_torch()
|
|
415
|
+
else:
|
|
416
|
+
ext_torch.unextend_torch()
|
|
@@ -0,0 +1,48 @@
|
|
|
1
|
+
# This file is part of memory_graph.
|
|
2
|
+
# Copyright (c) 2023, Bas Terwijn.
|
|
3
|
+
# SPDX-License-Identifier: BSD-2-Clause
|
|
4
|
+
|
|
5
|
+
""" Extension to add the memory graph configuration for Numpy types. """
|
|
6
|
+
from memory_graph.node_linear import Node_Linear
|
|
7
|
+
from memory_graph.node_table import Node_Table
|
|
8
|
+
|
|
9
|
+
import memory_graph.config as config
|
|
10
|
+
|
|
11
|
+
def ndarray_to_node(data, ndarray_data):
|
|
12
|
+
dim = len(ndarray_data.shape)
|
|
13
|
+
if dim > 2:
|
|
14
|
+
return Node_Linear(data, [i for i in ndarray_data])
|
|
15
|
+
elif dim == 2:
|
|
16
|
+
return Node_Table(data, ndarray_data)
|
|
17
|
+
else:
|
|
18
|
+
return Node_Linear(data, ndarray_data)
|
|
19
|
+
|
|
20
|
+
def get_numpy_immutables():
|
|
21
|
+
import numpy as np
|
|
22
|
+
|
|
23
|
+
return {
|
|
24
|
+
np.int8, np.int16, np.int32, np.int64, np.uint8, np.uint16, np.uint32, np.uint64,
|
|
25
|
+
np.float16, np.float32, np.float64,
|
|
26
|
+
np.complex64, np.complex128,
|
|
27
|
+
np.bool_, np.bytes_, np.str_, np.datetime64, np.timedelta64
|
|
28
|
+
}
|
|
29
|
+
|
|
30
|
+
def extend_numpy():
|
|
31
|
+
import numpy as np
|
|
32
|
+
|
|
33
|
+
config.embedded_types |= get_numpy_immutables()
|
|
34
|
+
config.type_to_node[np.matrix] = lambda data : Node_Table(data, np.asarray(data)) # convert to ndarray to avoid infinite recursion due to index issue
|
|
35
|
+
config.type_to_node[np.ndarray] = lambda data : ndarray_to_node(data, data)
|
|
36
|
+
|
|
37
|
+
config.type_to_color[np.ndarray] = "hotpink1"
|
|
38
|
+
config.type_to_color[np.matrix] = "hotpink2"
|
|
39
|
+
|
|
40
|
+
def unextend_numpy():
|
|
41
|
+
import numpy as np
|
|
42
|
+
|
|
43
|
+
config.embedded_types -= get_numpy_immutables()
|
|
44
|
+
del config.type_to_node[np.matrix]
|
|
45
|
+
del config.type_to_node[np.ndarray]
|
|
46
|
+
|
|
47
|
+
del config.type_to_color[np.ndarray]
|
|
48
|
+
del config.type_to_color[np.matrix]
|
|
@@ -0,0 +1,36 @@
|
|
|
1
|
+
# This file is part of memory_graph.
|
|
2
|
+
# Copyright (c) 2023, Bas Terwijn.
|
|
3
|
+
# SPDX-License-Identifier: BSD-2-Clause
|
|
4
|
+
|
|
5
|
+
""" Extension to add the memory graph configuration for Pandas types. """
|
|
6
|
+
from memory_graph.node_linear import Node_Linear
|
|
7
|
+
from memory_graph.node_table import Node_Table
|
|
8
|
+
|
|
9
|
+
import memory_graph.config as config
|
|
10
|
+
|
|
11
|
+
def extend_pandas():
|
|
12
|
+
import pandas as pd
|
|
13
|
+
|
|
14
|
+
config.type_to_node[pd.DataFrame] = lambda data : (
|
|
15
|
+
Node_Table(data,
|
|
16
|
+
data.values.tolist(),
|
|
17
|
+
col_names = data.columns.tolist(),
|
|
18
|
+
row_names = [ str(i) for i in data.index.tolist()]
|
|
19
|
+
)
|
|
20
|
+
)
|
|
21
|
+
|
|
22
|
+
config.type_to_node[pd.Series] = lambda data : (
|
|
23
|
+
Node_Linear(data, data.tolist())
|
|
24
|
+
)
|
|
25
|
+
|
|
26
|
+
config.type_to_color[pd.DataFrame] = "olivedrab1"
|
|
27
|
+
config.type_to_color[pd.Series] = "olivedrab2"
|
|
28
|
+
|
|
29
|
+
def unextend_pandas():
|
|
30
|
+
import pandas as pd
|
|
31
|
+
|
|
32
|
+
del config.type_to_node[pd.DataFrame]
|
|
33
|
+
del config.type_to_node[pd.Series]
|
|
34
|
+
|
|
35
|
+
del config.type_to_color[pd.DataFrame]
|
|
36
|
+
del config.type_to_color[pd.Series]
|
|
@@ -0,0 +1,19 @@
|
|
|
1
|
+
# This file is part of memory_graph.
|
|
2
|
+
# Copyright (c) 2023, Bas Terwijn.
|
|
3
|
+
# SPDX-License-Identifier: BSD-2-Clause
|
|
4
|
+
|
|
5
|
+
""" Extension to add the memory graph configuration for Pandas types. """
|
|
6
|
+
import memory_graph.extension_numpy as ext_np
|
|
7
|
+
import memory_graph.config as config
|
|
8
|
+
|
|
9
|
+
def extend_torch():
|
|
10
|
+
import torch
|
|
11
|
+
|
|
12
|
+
config.type_to_node[torch.Tensor] = lambda data : ext_np.ndarray_to_node(data, data.numpy())
|
|
13
|
+
config.type_to_color[torch.Tensor] = "darkolivegreen1"
|
|
14
|
+
|
|
15
|
+
def unextend_torch():
|
|
16
|
+
import torch
|
|
17
|
+
|
|
18
|
+
del config.type_to_node[torch.Tensor]
|
|
19
|
+
del config.type_to_color[torch.Tensor]
|
|
@@ -75,13 +75,13 @@ class Node_Linear(Node_Base):
|
|
|
75
75
|
Helper function to fill the html_table with the children of the Node_Base in horizontal orientation.
|
|
76
76
|
"""
|
|
77
77
|
show_index = not self.get_type() in config.no_index_types
|
|
78
|
-
|
|
79
|
-
|
|
80
|
-
if
|
|
78
|
+
if show_index:
|
|
79
|
+
for index in slices.table_iter(self.children.size()):
|
|
80
|
+
if index>=0:
|
|
81
81
|
html_table.add_index(index)
|
|
82
|
-
|
|
83
|
-
|
|
84
|
-
|
|
82
|
+
else:
|
|
83
|
+
html_table.add_value('', border=0)
|
|
84
|
+
html_table.add_new_line()
|
|
85
85
|
for index in slices.table_iter(self.children.size()):
|
|
86
86
|
if index>=0:
|
|
87
87
|
child = self.children[index]
|
|
@@ -1,6 +1,6 @@
|
|
|
1
1
|
Metadata-Version: 2.4
|
|
2
2
|
Name: memory_graph
|
|
3
|
-
Version: 0.3.
|
|
3
|
+
Version: 0.3.66
|
|
4
4
|
Summary: Teaching tool and debugging aid in context of references, mutable data types, and shallow and deep copy.
|
|
5
5
|
Author-email: Bas Terwijn <bterwijn@gmail.com>
|
|
6
6
|
License-Expression: BSD-2-Clause
|
|
@@ -30,11 +30,11 @@ Additionally [Graphviz](https://graphviz.org/download/) needs to be installed.
|
|
|
30
30
|
Run a live demo in the 👉 [**Memory Graph Web Debugger**](https://memory-graph.com/#breakpoints=8&continues=1×tep=1.0&play) 👈 now, no installation required!
|
|
31
31
|
|
|
32
32
|
- learn the right **mental model** to think about Python data (references, mutability, shallow vs deep copy)
|
|
33
|
-
- **visualize the structure of your data** to easily understand and debug any data structure
|
|
33
|
+
- **visualize the structure of your data** to more easily understand and debug any data structure
|
|
34
34
|
- understand function calls, variable scope, and the **complete program state** through call stack visualization
|
|
35
35
|
|
|
36
36
|
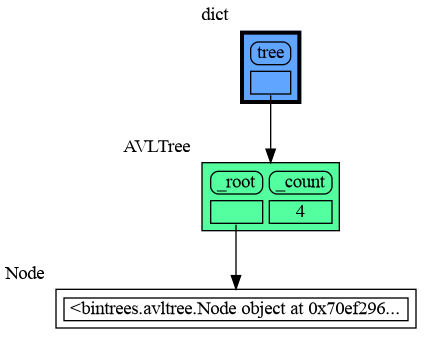
An example Binary Tree data structure:
|
|
37
|
-

|
|
38
38
|
Or see it in the [Memory Grah Web Debugger](https://memory-graph.com/#codeurl=https://raw.githubusercontent.com/bterwijn/memory_graph/refs/heads/main/src/bin_tree.py×tep=0.2&play).
|
|
39
39
|
|
|
40
40
|
# Videos #
|
|
@@ -43,7 +43,7 @@ Or see it in the [Memory Grah Web Debugger](https://memory-graph.com/#codeurl=ht
|
|
|
43
43
|
| [Quick Intro (3:49)](https://www.youtube.com/watch?v=23_bHcr7hqo) | [Mutability (17:29)](https://www.youtube.com/watch?v=pvIJgHCaXhU) |
|
|
44
44
|
|
|
45
45
|
# Memory Graph #
|
|
46
|
-
For program understanding and debugging, the [memory_graph](https://
|
|
46
|
+
For program understanding and debugging, the [memory_graph](https://github.com/bterwijn/memory_graph) package can visualize your data, supporting many different data types, including but not limited to:
|
|
47
47
|
|
|
48
48
|
```python
|
|
49
49
|
import memory_graph as mg
|
|
@@ -69,7 +69,7 @@ mg.render(data, "my_graph.gv") # Graphviz DOT file
|
|
|
69
69
|
mg.render(data) # renders to default: 'memory_graph.pdf'
|
|
70
70
|
```
|
|
71
71
|
|
|
72
|
-
# Sharing Values #
|
|
72
|
+
# Sharing Values, Aliasing #
|
|
73
73
|
In Python, assigning a list from variable `a` to variable `b` causes both variables to reference the same list value and thus share it. Consequently, any change applied through one variable will impact the other. This behavior can lead to elusive bugs if a programmer incorrectly assumes that list `a` and `b` are independent.
|
|
74
74
|
|
|
75
75
|
<table><tr><td>
|
|
@@ -86,7 +86,7 @@ b.append(1) # changing 'b' changes 'a'
|
|
|
86
86
|
print('a:', a)
|
|
87
87
|
print('b:', b)
|
|
88
88
|
|
|
89
|
-
# check if 'a' and 'b' share
|
|
89
|
+
# check if 'a' and 'b' share the list
|
|
90
90
|
print('ids:', id(a), id(b))
|
|
91
91
|
print('identical?:', a is b)
|
|
92
92
|
|
|
@@ -98,18 +98,18 @@ mg.show( locals() )
|
|
|
98
98
|
|
|
99
99
|

|
|
100
100
|
|
|
101
|
-
a graph showing `a` and `b` share
|
|
101
|
+
a graph showing `a` and `b` share the list
|
|
102
102
|
|
|
103
103
|
</td></tr></table>
|
|
104
104
|
|
|
105
|
-
The fact that `a` and `b` share
|
|
105
|
+
The fact that `a` and `b` share the list can not be verified by printing the lists. It can be verified by comparing the identity of both variables using the `id()` function or by using the `is` comparison operator as shown in the program output below, but this quickly becomes impractical for larger programs.
|
|
106
106
|
```{verbatim}
|
|
107
107
|
a: 4, 3, 2, 1
|
|
108
108
|
b: 4, 3, 2, 1
|
|
109
109
|
ids: 126432214913216 126432214913216
|
|
110
110
|
identical?: True
|
|
111
111
|
```
|
|
112
|
-
A better way to understand what values are shared is to draw a graph using [memory_graph](https://
|
|
112
|
+
A better way to understand what values are shared is to draw a graph using [memory_graph](https://github.com/bterwijn/memory_graph).
|
|
113
113
|
|
|
114
114
|
# Topics #
|
|
115
115
|
|
|
@@ -161,7 +161,7 @@ Bas Terwijn
|
|
|
161
161
|
## Inspiration ##
|
|
162
162
|
Inspired by [Python Tutor](https://pythontutor.com/).
|
|
163
163
|
|
|
164
|
-
The main
|
|
164
|
+
The main differences are that by running memory_graph locally we support Python Tutor’s [unsupported features](https://github.com/pythontutor-dev/pythontutor/blob/master/unsupported-features.md#unsupported-features) so that it scales to full programs in many environments and IDEs instead of just code snippets in a webbrowser, and by mirroring the data’s hierarchy we improve graph readability for larger graphs.
|
|
165
165
|
|
|
166
166
|
## Social Media #
|
|
167
167
|
* [LinkedIn](https://www.linkedin.com/groups/13244150/)
|
|
@@ -271,22 +271,28 @@ mg.show(locals())
|
|
|
271
271
|
Or see it in the [Memory Grah Web Debugger](https://memory-graph.com/#codeurl=https://raw.githubusercontent.com/bterwijn/memory_graph/refs/heads/main/src/custom_copy.py&breakpoints=15&continues=1&play).
|
|
272
272
|
|
|
273
273
|
## Name Rebinding ##
|
|
274
|
-
When `a` and `b` share a mutable value, then changing the value of `b` changes the value of `a` and vice versa. However, reassigning `b` does not change `a`. When you reassign `b`, you only **rebind** the name `b` to another value without affecting any other variable.
|
|
274
|
+
When `a` and `b` share a mutable value, then changing the value of `b` changes the value of `a` and vice versa. However, reassigning `b` does not change `a`. When you reassign `b`, you only **rebind** the name `b` to another value without affecting any other variable.
|
|
275
|
+
|
|
276
|
+
Also note the difference between statement `b += [1]` that changes `b` and `a`, and statement `c = c + [300]` that first creates the new value `c + [300]` and assigns this value to `c` without effecting `b`. This shows that `x += y` is not the same as `x = x + y` for values of mutable type.
|
|
275
277
|
|
|
276
278
|
```python
|
|
277
279
|
import memory_graph as mg
|
|
278
280
|
|
|
279
|
-
a = [
|
|
281
|
+
a = [100, 200]
|
|
280
282
|
b = a
|
|
281
283
|
mg.render(locals(), 'rebinding1.png')
|
|
282
284
|
|
|
283
|
-
b += [
|
|
284
|
-
b = [
|
|
285
|
+
b += [300] # changes the value of 'b' and 'a'
|
|
286
|
+
b = [400, 500] # rebinds 'b' to a new value, 'a' is unaffected
|
|
287
|
+
c = b
|
|
285
288
|
mg.render(locals(), 'rebinding2.png')
|
|
289
|
+
|
|
290
|
+
c = c + [600] # rebinds 'c' to new value 'c + [600]', `b` is unaffected
|
|
291
|
+
mg.render(locals(), 'rebinding3.png')
|
|
286
292
|
```
|
|
287
|
-
|  |  |
|
|
288
|
-
|
|
289
|
-
| rebinding1.png | rebinding2.png |
|
|
293
|
+
|  |  |  |
|
|
294
|
+
|:--------------:|:--------------:|:--------------:|
|
|
295
|
+
| rebinding1.png | rebinding2.png | rebinding3.png |
|
|
290
296
|
|
|
291
297
|
Or see it in the [Memory Grah Web Debugger](https://memory-graph.com/#codeurl=https://raw.githubusercontent.com/bterwijn/memory_graph/refs/heads/main/src/rebind.py&play).
|
|
292
298
|
|
|
@@ -314,7 +320,7 @@ When copying a mix of values of mutable and immutable type, to save on time and
|
|
|
314
320
|
import memory_graph as mg
|
|
315
321
|
import copy
|
|
316
322
|
|
|
317
|
-
a = ( [1, 2], ('x', 'y') ) # mix of mutable and immutable
|
|
323
|
+
a = ( [1, 2], ('x', 'y') ) # mix of mutable and immutable values
|
|
318
324
|
|
|
319
325
|
# three different ways to make a "copy" of 'a':
|
|
320
326
|
c1 = a
|
|
@@ -381,7 +387,7 @@ The effect of calling `add_one()` is that `b[0]` increases by 1, while `a` is un
|
|
|
381
387
|
|
|
382
388
|
# Data Model Exercises #
|
|
383
389
|
|
|
384
|
-
Now is a good time to practice with Python Data Model concepts. Here are [some exercises](https://github.com/bterwijn/memory_graph_videos/blob/main/exercises/exercises.md) on references, mutability, copies, and function calls.
|
|
390
|
+
Now is a good time to practice with these Python Data Model concepts. Here are [some exercises](https://github.com/bterwijn/memory_graph_videos/blob/main/exercises/exercises.md) on references, mutability, copies, and function calls. Also see the programming exercises at [the end of the Mutability video](https://www.youtube.com/watch?v=pvIJgHCaXhU&t=891s).
|
|
385
391
|
|
|
386
392
|
# Block #
|
|
387
393
|
It is often helpful to temporarily block program execution to inspect the graph. For this we can use the `mg.block()` function:
|
|
@@ -394,7 +400,7 @@ This function:
|
|
|
394
400
|
* first executes `fun(arg1, arg2, ...)`
|
|
395
401
|
* then prints the current source location in the program
|
|
396
402
|
* then blocks execution until the <Enter> key is pressed
|
|
397
|
-
*
|
|
403
|
+
* and returns the return value of the `fun()` call
|
|
398
404
|
|
|
399
405
|
## Recursion ##
|
|
400
406
|
The call stack is also helpful to visualize how recursion works. Here we use `mg.block()` to show each step of how recursively `factorial(4)` is computed:
|
|
@@ -773,9 +779,9 @@ Different aspects of memory_graph can be configured. The default configuration c
|
|
|
773
779
|
|
|
774
780
|
|
|
775
781
|
## Simplified Graph ##
|
|
776
|
-
Memory_graph simplifies the visualization (and the viewer's mental model) by **not** showing separate nodes for immutable types like `bool`, `int`, `float`, `complex`, and `str` by default. This simplification can sometimes be slightly misleading. As in the example below, after a shallow copy, lists `a` and `b` technically share their `int` values, but the graph makes it appear as though `a` and `b` each have their own copies. However, since `int` is immutable, this simplification will never lead to unexpected changes (changing `a` won’t affect `b`) so will never result in bugs.
|
|
782
|
+
Memory_graph simplifies the visualization (and the viewer's mental model) by **not** showing separate nodes for immutable types like `bool`, `int`, `float`, `complex`, and `str` by default. This simplification can sometimes be slightly misleading. As in the example below, after a shallow copy, lists `a` and `b` technically share their `int` values, but the graph makes it appear as though `a` and `b` each have their own copies. However, since `int` is immutable, this simplification will never lead to unexpected changes (changing `a`'s ints won’t affect `b`) so will never result in bugs.
|
|
777
783
|
|
|
778
|
-
The simplification strikes a balance: it is slightly misleading but keeps the graph clean and easy to understand
|
|
784
|
+
The simplification strikes a balance: it is slightly misleading but keeps the graph clean and easy to understand to focus on mutable types where unexpected changes can occur. This is why it is the default behavior. If you do want to show separate nodes for `int` values, such as for educational purposes, you can simply remove `int` from the `mg.config.embedded_types` set:
|
|
779
785
|
```python
|
|
780
786
|
import memory_graph as mg
|
|
781
787
|
|
|
@@ -809,7 +815,7 @@ tree.insert(15, "fifteen")
|
|
|
809
815
|
|
|
810
816
|
mg.show(locals())
|
|
811
817
|
```
|
|
812
|
-

|
|
813
819
|
|
|
814
820
|
## All attributes using dir() ##
|
|
815
821
|
A useful start is to give it some color, show the list of all its attributes using `dir()`, and setting an empty Slicer to see the attribute list in full.
|
|
@@ -980,6 +986,8 @@ mg.config.type_to_node[List_View] = (lambda l: mg.Node_Linear(l,
|
|
|
980
986
|
```
|
|
981
987
|

|
|
982
988
|
|
|
989
|
+
Or see it in the [Memory Grah Web Debugger](https://memory-graph.com/#codeurl=https://raw.githubusercontent.com/bterwijn/memory_graph/refs/heads/main/src/bin_search.py&breakpoints=32&continues=1×tep=0.5&play)
|
|
990
|
+
|
|
983
991
|
# Graph Depth #
|
|
984
992
|
To limit the size of the graph the maximum depth of the graph is set by `mg.config.max_graph_depth`. Additionally for each type a depth can be set to further limit the graph, as is done for type `B` in the example below. Scissors indicate where the graph is cut short. Alternatively the `id()` of a data elements can be used to limit the graph for that specific element, as is done for the value referenced by variable `c`.
|
|
985
993
|
|
|
@@ -1052,12 +1060,12 @@ mg.show(locals())
|
|
|
1052
1060
|
Different extensions are available for types from other Python packages.
|
|
1053
1061
|
|
|
1054
1062
|
## Numpy ##
|
|
1055
|
-
Numpy types `array` and `matrix` and `ndarray
|
|
1063
|
+
For Numpy types `array` and `matrix` and `ndarray`, use `mg.extend_numpy()`:
|
|
1056
1064
|
|
|
1057
1065
|
```python
|
|
1058
1066
|
import memory_graph as mg
|
|
1059
1067
|
import numpy as np
|
|
1060
|
-
|
|
1068
|
+
mg.extend_numpy()
|
|
1061
1069
|
np.random.seed(0) # use same random numbers each run
|
|
1062
1070
|
|
|
1063
1071
|
matrix = np.matrix([[i*5+j for j in range(4)] for i in range(5)])
|
|
@@ -1072,12 +1080,12 @@ mg.show(locals())
|
|
|
1072
1080
|
Or see it in the [Memory Grah Web Debugger](https://memory-graph.com/#micropip=numpy&codeurl=https://raw.githubusercontent.com/bterwijn/memory_graph/refs/heads/main/src/mg_numpy.py&continues=1).
|
|
1073
1081
|
|
|
1074
1082
|
## Pandas ##
|
|
1075
|
-
|
|
1083
|
+
For pandas types `Series` and `DataFrame`, use `mg.extend_pandas()`:
|
|
1076
1084
|
|
|
1077
1085
|
```python
|
|
1078
1086
|
import memory_graph as mg
|
|
1079
1087
|
import pandas as pd
|
|
1080
|
-
|
|
1088
|
+
mg.extend_pandas()
|
|
1081
1089
|
|
|
1082
1090
|
series = pd.Series( [i for i in range(20)] )
|
|
1083
1091
|
dataframe1 = pd.DataFrame({ "calories": [420, 380, 390],
|
|
@@ -1093,12 +1101,12 @@ mg.show(locals())
|
|
|
1093
1101
|
Or see it in the [Memory Grah Web Debugger](https://memory-graph.com/#micropip=pandas&codeurl=https://raw.githubusercontent.com/bterwijn/memory_graph/refs/heads/main/src/mg_pandas.py&continues=1).
|
|
1094
1102
|
|
|
1095
1103
|
## PyTorch ##
|
|
1096
|
-
|
|
1104
|
+
For torch type `tensor`, use `mg.extend_torch()`:
|
|
1097
1105
|
|
|
1098
1106
|
```python
|
|
1099
1107
|
import memory_graph as mg
|
|
1100
1108
|
import torch
|
|
1101
|
-
|
|
1109
|
+
mg.extend_torch()
|
|
1102
1110
|
torch.manual_seed(0) # same random numbers each run
|
|
1103
1111
|
|
|
1104
1112
|
tensor_1d = torch.rand(3)
|
|
@@ -1171,4 +1179,4 @@ $ bash create_gif.sh animated
|
|
|
1171
1179
|
- When graph edges overlap it can be hard to distinguish them. Using an interactive graphviz viewer, such as [xdot](https://github.com/jrfonseca/xdot.py), on a '*.gv' DOT output file will help.
|
|
1172
1180
|
|
|
1173
1181
|
# Other Packages #
|
|
1174
|
-
The [memory_graph](https://
|
|
1182
|
+
The [memory_graph](https://github.com/bterwijn/memory_graph) package visualizes your data. If instead you want to visualize function calls, check out the [invocation_tree](https://github.com/bterwijn/invocation_tree) package.
|
|
@@ -4,7 +4,7 @@ build-backend = "setuptools.build_meta"
|
|
|
4
4
|
|
|
5
5
|
[project]
|
|
6
6
|
name = "memory_graph"
|
|
7
|
-
version = "0.3.
|
|
7
|
+
version = "0.3.66"
|
|
8
8
|
description = "Teaching tool and debugging aid in context of references, mutable data types, and shallow and deep copy."
|
|
9
9
|
authors = [
|
|
10
10
|
{name = "Bas Terwijn", email = "bterwijn@gmail.com"}
|
|
@@ -1,33 +0,0 @@
|
|
|
1
|
-
# This file is part of memory_graph.
|
|
2
|
-
# Copyright (c) 2023, Bas Terwijn.
|
|
3
|
-
# SPDX-License-Identifier: BSD-2-Clause
|
|
4
|
-
|
|
5
|
-
""" Extension to add the memory graph configuration for Numpy types. """
|
|
6
|
-
from memory_graph.node_linear import Node_Linear
|
|
7
|
-
from memory_graph.node_table import Node_Table
|
|
8
|
-
|
|
9
|
-
import memory_graph.config as config
|
|
10
|
-
|
|
11
|
-
import numpy as np
|
|
12
|
-
|
|
13
|
-
config.embedded_types |= {
|
|
14
|
-
np.int8, np.int16, np.int32, np.int64, np.uint8, np.uint16, np.uint32, np.uint64,
|
|
15
|
-
np.float16, np.float32, np.float64,
|
|
16
|
-
np.complex64, np.complex128,
|
|
17
|
-
np.bool_, np.bytes_, np.str_, np.datetime64, np.timedelta64
|
|
18
|
-
}
|
|
19
|
-
|
|
20
|
-
def ndarray_to_node(data, ndarray_data):
|
|
21
|
-
dim = len(ndarray_data.shape)
|
|
22
|
-
if dim > 2:
|
|
23
|
-
return Node_Linear(data, [i for i in ndarray_data])
|
|
24
|
-
elif dim == 2:
|
|
25
|
-
return Node_Table(data, ndarray_data)
|
|
26
|
-
else:
|
|
27
|
-
return Node_Linear(data, ndarray_data)
|
|
28
|
-
|
|
29
|
-
config.type_to_node[np.matrix] = lambda data : Node_Table(data, np.asarray(data)) # convert to ndarray to avoid infinite recursion due to index issue
|
|
30
|
-
config.type_to_node[np.ndarray] = lambda data : ndarray_to_node(data, data)
|
|
31
|
-
|
|
32
|
-
config.type_to_color[np.ndarray] = "hotpink1"
|
|
33
|
-
config.type_to_color[np.matrix] = "hotpink2"
|
|
@@ -1,26 +0,0 @@
|
|
|
1
|
-
# This file is part of memory_graph.
|
|
2
|
-
# Copyright (c) 2023, Bas Terwijn.
|
|
3
|
-
# SPDX-License-Identifier: BSD-2-Clause
|
|
4
|
-
|
|
5
|
-
""" Extension to add the memory graph configuration for Pandas type. """
|
|
6
|
-
from memory_graph.node_linear import Node_Linear
|
|
7
|
-
from memory_graph.node_table import Node_Table
|
|
8
|
-
|
|
9
|
-
import memory_graph.config as config
|
|
10
|
-
|
|
11
|
-
import pandas as pd
|
|
12
|
-
|
|
13
|
-
config.type_to_node[pd.DataFrame] = lambda data : (
|
|
14
|
-
Node_Table(data,
|
|
15
|
-
data.values.tolist(),
|
|
16
|
-
col_names = data.columns.tolist(),
|
|
17
|
-
row_names = [ str(i) for i in data.index.tolist()]
|
|
18
|
-
)
|
|
19
|
-
)
|
|
20
|
-
|
|
21
|
-
config.type_to_node[pd.Series] = lambda data : (
|
|
22
|
-
Node_Linear(data, data.tolist())
|
|
23
|
-
)
|
|
24
|
-
|
|
25
|
-
config.type_to_color[pd.DataFrame] = "olivedrab1"
|
|
26
|
-
config.type_to_color[pd.Series] = "olivedrab2"
|
|
File without changes
|
|
File without changes
|
|
File without changes
|
|
File without changes
|
|
File without changes
|
|
File without changes
|
|
File without changes
|
|
File without changes
|
|
File without changes
|
|
File without changes
|
|
File without changes
|
|
File without changes
|
|
File without changes
|
|
File without changes
|
|
File without changes
|
|
File without changes
|
|
File without changes
|
|
File without changes
|
|
File without changes
|
|
File without changes
|
|
File without changes
|
|
File without changes
|
|
File without changes
|
|
File without changes
|
|
File without changes
|
|
File without changes
|
|
File without changes
|
|
File without changes
|
|
File without changes
|
|
File without changes
|
|
File without changes
|