memory-graph 0.3.12__tar.gz → 0.3.14__tar.gz
This diff represents the content of publicly available package versions that have been released to one of the supported registries. The information contained in this diff is provided for informational purposes only and reflects changes between package versions as they appear in their respective public registries.
- memory_graph-0.3.14/MANIFEST.in +1 -0
- {memory_graph-0.3.12 → memory_graph-0.3.14}/PKG-INFO +61 -39
- memory_graph-0.3.12/memory_graph.egg-info/PKG-INFO → memory_graph-0.3.14/README.md +59 -56
- memory_graph-0.3.14/images/add_one.png +0 -0
- memory_graph-0.3.14/images/avltree.py~ +41 -0
- memory_graph-0.3.14/images/avltree_base.png +0 -0
- memory_graph-0.3.14/images/avltree_dir.png +0 -0
- memory_graph-0.3.14/images/avltree_fail.gv +26 -0
- memory_graph-0.3.14/images/avltree_key_value.png +0 -0
- memory_graph-0.3.14/images/avltree_linear.png +0 -0
- memory_graph-0.3.14/images/avltree_table.png +0 -0
- memory_graph-0.3.14/images/bin_tree.png +0 -0
- memory_graph-0.3.14/images/copies.png +0 -0
- memory_graph-0.3.14/images/copy_method.png +0 -0
- {memory_graph-0.3.12 → memory_graph-0.3.14}/images/create_gif.sh +1 -1
- {memory_graph-0.3.12 → memory_graph-0.3.14}/images/create_images.sh +1 -0
- memory_graph-0.3.14/images/debugging.gif +0 -0
- memory_graph-0.3.14/images/debugging01.png +0 -0
- memory_graph-0.3.14/images/debugging02.png +0 -0
- memory_graph-0.3.14/images/debugging03.png +0 -0
- memory_graph-0.3.14/images/debugging04.png +0 -0
- memory_graph-0.3.14/images/debugging05.png +0 -0
- memory_graph-0.3.14/images/debugging06.png +0 -0
- memory_graph-0.3.14/images/extension_numpy.png +0 -0
- memory_graph-0.3.14/images/extension_pandas.png +0 -0
- memory_graph-0.3.14/images/factorial.gif +0 -0
- memory_graph-0.3.14/images/factorial01.png +0 -0
- memory_graph-0.3.14/images/factorial02.png +0 -0
- memory_graph-0.3.14/images/factorial03.png +0 -0
- memory_graph-0.3.14/images/factorial04.png +0 -0
- memory_graph-0.3.14/images/factorial05.png +0 -0
- memory_graph-0.3.14/images/factorial06.png +0 -0
- memory_graph-0.3.14/images/factorial07.png +0 -0
- memory_graph-0.3.14/images/hash_set.png +0 -0
- memory_graph-0.3.14/images/highlight.png +0 -0
- memory_graph-0.3.14/images/immutable1.png +0 -0
- memory_graph-0.3.14/images/immutable2.png +0 -0
- memory_graph-0.3.14/images/linked_list.png +0 -0
- memory_graph-0.3.14/images/many_types.png +0 -0
- memory_graph-0.3.14/images/memory_graph.gv +20 -0
- memory_graph-0.3.14/images/memory_graph.gv.pdf +0 -0
- memory_graph-0.3.14/images/mutable1.png +0 -0
- memory_graph-0.3.14/images/mutable2.png +0 -0
- memory_graph-0.3.14/images/my_graph.gv +35 -0
- memory_graph-0.3.14/images/my_graph.pdf +0 -0
- memory_graph-0.3.14/images/not_node_types.py +9 -0
- memory_graph-0.3.14/images/not_node_types.py~ +9 -0
- memory_graph-0.3.14/images/not_node_types1.png +0 -0
- memory_graph-0.3.14/images/not_node_types2.png +0 -0
- memory_graph-0.3.14/images/power_set.gif +0 -0
- memory_graph-0.3.14/images/power_set1.png +0 -0
- memory_graph-0.3.14/images/power_set10.png +0 -0
- memory_graph-0.3.14/images/power_set11.png +0 -0
- memory_graph-0.3.14/images/power_set12.png +0 -0
- memory_graph-0.3.14/images/power_set13.png +0 -0
- memory_graph-0.3.14/images/power_set14.png +0 -0
- memory_graph-0.3.14/images/power_set15.png +0 -0
- memory_graph-0.3.14/images/power_set16.png +0 -0
- memory_graph-0.3.14/images/power_set17.png +0 -0
- memory_graph-0.3.14/images/power_set18.png +0 -0
- memory_graph-0.3.14/images/power_set19.png +0 -0
- memory_graph-0.3.14/images/power_set2.png +0 -0
- memory_graph-0.3.14/images/power_set20.png +0 -0
- memory_graph-0.3.14/images/power_set21.png +0 -0
- memory_graph-0.3.14/images/power_set22.png +0 -0
- memory_graph-0.3.14/images/power_set3.png +0 -0
- memory_graph-0.3.14/images/power_set4.png +0 -0
- memory_graph-0.3.14/images/power_set5.png +0 -0
- memory_graph-0.3.14/images/power_set6.png +0 -0
- memory_graph-0.3.14/images/power_set7.png +0 -0
- memory_graph-0.3.14/images/power_set8.png +0 -0
- memory_graph-0.3.14/images/power_set9.png +0 -0
- {memory_graph-0.3.12 → memory_graph-0.3.14}/memory_graph/__init__.py +20 -10
- {memory_graph-0.3.12 → memory_graph-0.3.14}/memory_graph/html_table.py +26 -31
- memory_graph-0.3.12/README.md → memory_graph-0.3.14/memory_graph.egg-info/PKG-INFO +78 -37
- {memory_graph-0.3.12 → memory_graph-0.3.14}/memory_graph.egg-info/SOURCES.txt +47 -1
- {memory_graph-0.3.12 → memory_graph-0.3.14}/setup.py +3 -3
- memory_graph-0.3.14/src/jupyter_example.ipynb +85 -0
- memory_graph-0.3.12/MANIFEST.in +0 -1
- memory_graph-0.3.12/images/add_one.png +0 -0
- memory_graph-0.3.12/images/avltree_base.png +0 -0
- memory_graph-0.3.12/images/avltree_dir.png +0 -0
- memory_graph-0.3.12/images/avltree_key_value.png +0 -0
- memory_graph-0.3.12/images/avltree_linear.png +0 -0
- memory_graph-0.3.12/images/avltree_table.png +0 -0
- memory_graph-0.3.12/images/bin_tree.png +0 -0
- memory_graph-0.3.12/images/copies.png +0 -0
- memory_graph-0.3.12/images/copy_method.png +0 -0
- memory_graph-0.3.12/images/debugging.gif +0 -0
- memory_graph-0.3.12/images/extension_numpy.png +0 -0
- memory_graph-0.3.12/images/extension_pandas.png +0 -0
- memory_graph-0.3.12/images/factorial.gif +0 -0
- memory_graph-0.3.12/images/hash_set.png +0 -0
- memory_graph-0.3.12/images/highlight.png +0 -0
- memory_graph-0.3.12/images/immutable1.png +0 -0
- memory_graph-0.3.12/images/immutable2.png +0 -0
- memory_graph-0.3.12/images/linked_list.png +0 -0
- memory_graph-0.3.12/images/many_types.png +0 -0
- memory_graph-0.3.12/images/mutable1.png +0 -0
- memory_graph-0.3.12/images/mutable2.png +0 -0
- memory_graph-0.3.12/images/power_set.gif +0 -0
- {memory_graph-0.3.12 → memory_graph-0.3.14}/LICENSE.txt +0 -0
- {memory_graph-0.3.12 → memory_graph-0.3.14}/TODO.txt +0 -0
- /memory_graph-0.3.12/images/jupyter_example.ipynb → /memory_graph-0.3.14/images/.ipynb_checkpoints/jupyter_example-checkpoint.ipynb +0 -0
- {memory_graph-0.3.12 → memory_graph-0.3.14}/images/add_one.py +0 -0
- {memory_graph-0.3.12 → memory_graph-0.3.14}/images/avltree.py +0 -0
- {memory_graph-0.3.12 → memory_graph-0.3.14}/images/avltree_fail.png +0 -0
- {memory_graph-0.3.12 → memory_graph-0.3.14}/images/bin_tree.py +0 -0
- {memory_graph-0.3.12 → memory_graph-0.3.14}/images/copies.py +0 -0
- {memory_graph-0.3.12 → memory_graph-0.3.14}/images/copy_method.py +0 -0
- {memory_graph-0.3.12 → memory_graph-0.3.14}/images/debug_vscode.png +0 -0
- {memory_graph-0.3.12 → memory_graph-0.3.14}/images/debugging.py +0 -0
- {memory_graph-0.3.12 → memory_graph-0.3.14}/images/extension_numpy.py +0 -0
- {memory_graph-0.3.12 → memory_graph-0.3.14}/images/extension_pandas.py +0 -0
- {memory_graph-0.3.12 → memory_graph-0.3.14}/images/factorial.py +0 -0
- {memory_graph-0.3.12 → memory_graph-0.3.14}/images/hash_set.py +0 -0
- {memory_graph-0.3.12 → memory_graph-0.3.14}/images/highlight.py +0 -0
- {memory_graph-0.3.12 → memory_graph-0.3.14}/images/immutable.py +0 -0
- {memory_graph-0.3.12 → memory_graph-0.3.14}/images/ipython.png +0 -0
- {memory_graph-0.3.12 → memory_graph-0.3.14}/images/jupyter_example.png +0 -0
- {memory_graph-0.3.12 → memory_graph-0.3.14}/images/linked_list.py +0 -0
- {memory_graph-0.3.12 → memory_graph-0.3.14}/images/many_types.py +0 -0
- {memory_graph-0.3.12 → memory_graph-0.3.14}/images/mutable.py +0 -0
- {memory_graph-0.3.12 → memory_graph-0.3.14}/images/power_set.py +0 -0
- {memory_graph-0.3.12 → memory_graph-0.3.14}/images/pyodide.png +0 -0
- {memory_graph-0.3.12 → memory_graph-0.3.14}/images/uva.png +0 -0
- {memory_graph-0.3.12 → memory_graph-0.3.14}/install.txt +0 -0
- {memory_graph-0.3.12 → memory_graph-0.3.14}/memory_graph/config.py +0 -0
- {memory_graph-0.3.12 → memory_graph-0.3.14}/memory_graph/config_default.py +0 -0
- {memory_graph-0.3.12 → memory_graph-0.3.14}/memory_graph/config_helpers.py +0 -0
- {memory_graph-0.3.12 → memory_graph-0.3.14}/memory_graph/extension_numpy.py +0 -0
- {memory_graph-0.3.12 → memory_graph-0.3.14}/memory_graph/extension_pandas.py +0 -0
- {memory_graph-0.3.12 → memory_graph-0.3.14}/memory_graph/list_view.py +0 -0
- {memory_graph-0.3.12 → memory_graph-0.3.14}/memory_graph/memory_to_nodes.py +0 -0
- {memory_graph-0.3.12 → memory_graph-0.3.14}/memory_graph/node_base.py +0 -0
- {memory_graph-0.3.12 → memory_graph-0.3.14}/memory_graph/node_key_value.py +0 -0
- {memory_graph-0.3.12 → memory_graph-0.3.14}/memory_graph/node_linear.py +0 -0
- {memory_graph-0.3.12 → memory_graph-0.3.14}/memory_graph/node_table.py +0 -0
- {memory_graph-0.3.12 → memory_graph-0.3.14}/memory_graph/sequence.py +0 -0
- {memory_graph-0.3.12 → memory_graph-0.3.14}/memory_graph/slicer.py +0 -0
- {memory_graph-0.3.12 → memory_graph-0.3.14}/memory_graph/slices.py +0 -0
- {memory_graph-0.3.12 → memory_graph-0.3.14}/memory_graph/slices_iterator.py +0 -0
- {memory_graph-0.3.12 → memory_graph-0.3.14}/memory_graph/slices_table_iterator.py +0 -0
- {memory_graph-0.3.12 → memory_graph-0.3.14}/memory_graph/test.py +0 -0
- {memory_graph-0.3.12 → memory_graph-0.3.14}/memory_graph/test_max_graph_depth.py +0 -0
- {memory_graph-0.3.12 → memory_graph-0.3.14}/memory_graph/test_memory_graph.py +0 -0
- {memory_graph-0.3.12 → memory_graph-0.3.14}/memory_graph/test_memory_to_nodes.py +0 -0
- {memory_graph-0.3.12 → memory_graph-0.3.14}/memory_graph/test_sequence.py +0 -0
- {memory_graph-0.3.12 → memory_graph-0.3.14}/memory_graph/test_slicer.py +0 -0
- {memory_graph-0.3.12 → memory_graph-0.3.14}/memory_graph/test_slices.py +0 -0
- {memory_graph-0.3.12 → memory_graph-0.3.14}/memory_graph/test_slices_iterator.py +0 -0
- {memory_graph-0.3.12 → memory_graph-0.3.14}/memory_graph/utils.py +0 -0
- {memory_graph-0.3.12 → memory_graph-0.3.14}/memory_graph.egg-info/dependency_links.txt +0 -0
- {memory_graph-0.3.12 → memory_graph-0.3.14}/memory_graph.egg-info/requires.txt +0 -0
- {memory_graph-0.3.12 → memory_graph-0.3.14}/memory_graph.egg-info/top_level.txt +0 -0
- {memory_graph-0.3.12 → memory_graph-0.3.14}/setup.cfg +0 -0
- {memory_graph-0.3.12 → memory_graph-0.3.14}/src/auto_memory_graph.py +0 -0
- {memory_graph-0.3.12 → memory_graph-0.3.14}/src/pyodide.html +0 -0
- {memory_graph-0.3.12 → memory_graph-0.3.14}/uml/memory_graph.uxf +0 -0
|
@@ -0,0 +1 @@
|
|
|
1
|
+
recursive-include images/ *
|
|
@@ -1,7 +1,7 @@
|
|
|
1
1
|
Metadata-Version: 2.1
|
|
2
2
|
Name: memory_graph
|
|
3
|
-
Version: 0.3.
|
|
4
|
-
Summary:
|
|
3
|
+
Version: 0.3.14
|
|
4
|
+
Summary: Generate intuitive graphs of your Python data, perfect for debugging and understanding complex relationships.
|
|
5
5
|
Home-page: https://github.com/bterwijn/memory_graph
|
|
6
6
|
Author: Bas Terwijn
|
|
7
7
|
Author-email: bterwijn@gmail.com
|
|
@@ -24,9 +24,35 @@ pip install --upgrade memory_graph
|
|
|
24
24
|
```
|
|
25
25
|
Additionally [Graphviz](https://graphviz.org/download/) needs to be installed.
|
|
26
26
|
|
|
27
|
-
#
|
|
27
|
+
# Memory Graph #
|
|
28
|
+
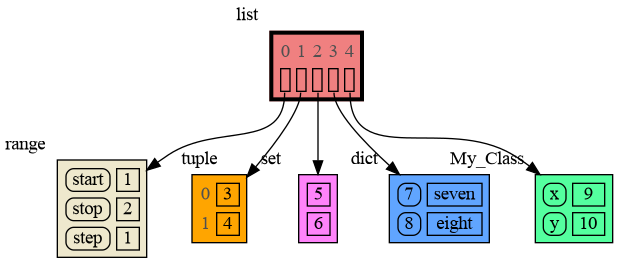
For program understanding and debugging, the [memory_graph](https://pypi.org/project/memory-graph/) package can visualize your data, supporting many different data types, including but not limited to:
|
|
29
|
+
|
|
30
|
+
```python
|
|
31
|
+
import memory_graph as mg
|
|
32
|
+
|
|
33
|
+
class MyClass:
|
|
34
|
+
|
|
35
|
+
def __init__(self, x, y):
|
|
36
|
+
self.x = x
|
|
37
|
+
self.y = y
|
|
38
|
+
|
|
39
|
+
data = [ range(1, 2), (3, 4), {5, 6}, {7:'seven', 8:'eight'}, MyClass(9, 10) ]
|
|
40
|
+
mg.show(data)
|
|
41
|
+
```
|
|
42
|
+
|
|
43
|
+
|
|
44
|
+
Instead of showing the graph on screen you can also render it to an output file of your choosing (see [Graphviz Output Formats](https://graphviz.org/docs/outputs/)) using for example:
|
|
28
45
|
|
|
29
|
-
|
|
46
|
+
```python
|
|
47
|
+
mg.render(data, "my_graph.pdf")
|
|
48
|
+
mg.render(data, "my_graph.svg")
|
|
49
|
+
mg.render(data, "my_graph.png")
|
|
50
|
+
mg.render(data, "my_graph.gv") # Graphviz DOT file
|
|
51
|
+
mg.render(data) # renders to 'mg.render_filename' with default value: 'memory_graph.pdf'
|
|
52
|
+
```
|
|
53
|
+
|
|
54
|
+
# Sharing Values #
|
|
55
|
+
In Python, assigning the list from variable `a` to variable `b` causes both variables to reference the same list value and thus share it. Consequently, any change applied through one variable will impact the other. This behavior can lead to elusive bugs if a programmer incorrectly assumes that list `a` and `b` are independent.
|
|
30
56
|
|
|
31
57
|
<table><tr><td>
|
|
32
58
|
|
|
@@ -67,33 +93,6 @@ identical?: True
|
|
|
67
93
|
```
|
|
68
94
|
A better way to understand what data is shared is to draw a graph of the data using the [memory_graph](https://pypi.org/project/memory-graph/) package.
|
|
69
95
|
|
|
70
|
-
# Memory Graph #
|
|
71
|
-
The [memory_graph](https://pypi.org/project/memory-graph/) package can graph many different data types, not limited to:
|
|
72
|
-
|
|
73
|
-
```python
|
|
74
|
-
import memory_graph as mg
|
|
75
|
-
|
|
76
|
-
class MyClass:
|
|
77
|
-
|
|
78
|
-
def __init__(self, x, y):
|
|
79
|
-
self.x = x
|
|
80
|
-
self.y = y
|
|
81
|
-
|
|
82
|
-
data = [ range(1, 2), (3, 4), {5, 6}, {7:'seven', 8:'eight'}, MyClass(9, 10) ]
|
|
83
|
-
mg.show(data)
|
|
84
|
-
```
|
|
85
|
-

|
|
86
|
-
|
|
87
|
-
Instead of showing the graph you can also render it to an output file of your choosing (see [Graphviz Output Formats](https://graphviz.org/docs/outputs/)) using for example:
|
|
88
|
-
|
|
89
|
-
```python
|
|
90
|
-
mg.render(data, "my_graph.pdf")
|
|
91
|
-
mg.render(data, "my_graph.svg")
|
|
92
|
-
mg.render(data, "my_graph.png")
|
|
93
|
-
mg.render(data, "my_graph.gv") # Graphviz DOT file
|
|
94
|
-
mg.render(data) # renders to 'mg.render_filename' with default value: 'memory_graph.pdf'
|
|
95
|
-
```
|
|
96
|
-
|
|
97
96
|
# Chapters #
|
|
98
97
|
|
|
99
98
|
[Python Data Model](#python-data-model)
|
|
@@ -197,7 +196,7 @@ mg.show(locals())
|
|
|
197
196
|
|
|
198
197
|
|
|
199
198
|
|
|
200
|
-
### Custom Copy
|
|
199
|
+
### Custom Copy ###
|
|
201
200
|
We can write our own custom copy function or method in case the three "copy" options don't do what we want. For example, in the code below the copy() method of My_Class copies the `digits` but shares the `letters` between two objects.
|
|
202
201
|
|
|
203
202
|
```python
|
|
@@ -224,7 +223,7 @@ mg.show(locals())
|
|
|
224
223
|
|
|
225
224
|
|
|
226
225
|
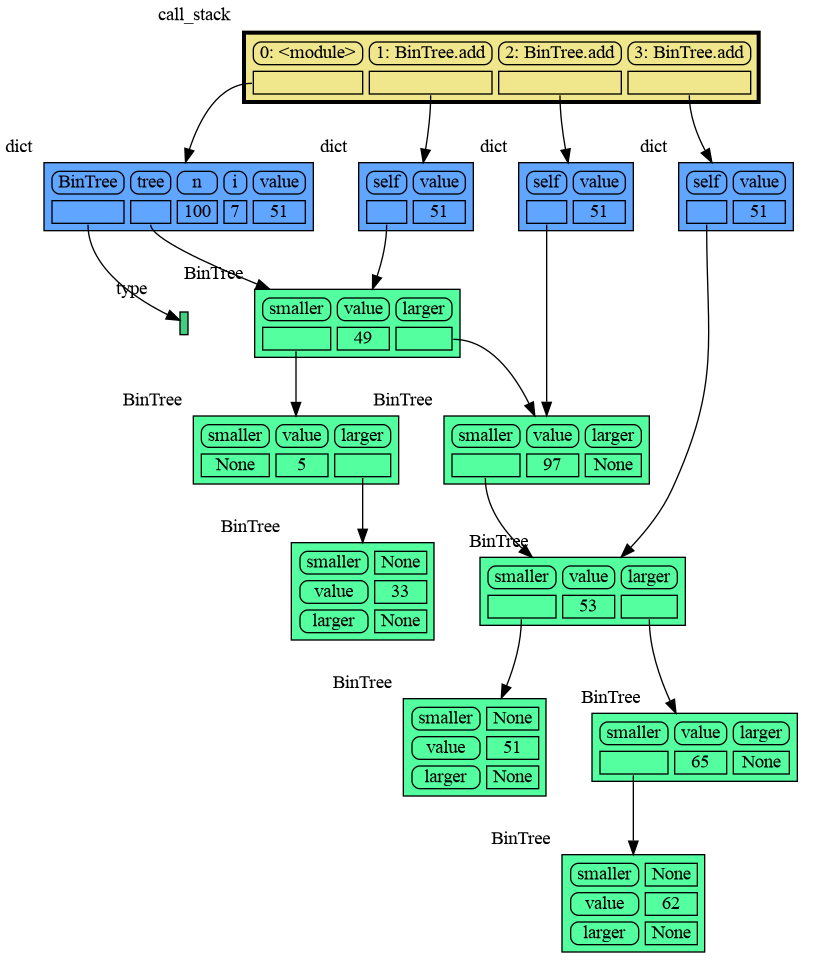
## Call Stack ##
|
|
227
|
-
The `mg.get_call_stack()` function retrieves the entire call stack, including the local variables for each function on the stack. This enables us to visualize the local variables across all active functions simultaneously.
|
|
226
|
+
The `mg.get_call_stack()` function retrieves the entire call stack, including the local variables for each function on the stack. This enables us to visualize the local variables across all active functions simultaneously. By examining the graph, we can determine whether any local variables from different functions share data. For instance, consider the function `add_one()` which adds the value `1` to each of its parameters `a`, `b`, and `c`.
|
|
228
227
|
|
|
229
228
|
```python
|
|
230
229
|
import memory_graph as mg
|
|
@@ -252,7 +251,7 @@ a:[4, 3, 2, 1] b:(4, 3, 2) c:[4, 3, 2]
|
|
|
252
251
|
This is because `b` is of immutable type 'tuple' so its value gets copied automatically when it is changed. And because the function is called with a copy of `c`, its original value is not changed by the function. The value of variable `a` is the only value of mutable type that is shared between the root stack frame **'0: \<module>'** and the **'1: add_one'** stack frame of the function so only that variable is affected as a result of the function call. The other changes remain confined to the local variables of the ```add_one()``` function.
|
|
253
252
|
|
|
254
253
|
### Block ###
|
|
255
|
-
It is often helpful to temporarily block program execution to inspect the graph. For this
|
|
254
|
+
It is often helpful to temporarily block program execution to inspect the graph. For this we can use the `mg.block()` function:
|
|
256
255
|
|
|
257
256
|
```python
|
|
258
257
|
mg.block(fun, arg1, arg2, ...)
|
|
@@ -264,7 +263,7 @@ This function:
|
|
|
264
263
|
* then blocks execution until the <Enter> key is pressed
|
|
265
264
|
* finally returns the value of the `fun()` call
|
|
266
265
|
|
|
267
|
-
|
|
266
|
+
To change its behavior:
|
|
268
267
|
* Set `mg.block_prints_location = False` to skip printing the source location.
|
|
269
268
|
* Set `mg.press_enter_message = None` to skip printing "Press <Enter> to continue...".
|
|
270
269
|
|
|
@@ -319,7 +318,6 @@ print( power_set(['a', 'b', 'c']) )
|
|
|
319
318
|
[['a', 'b', 'c'], ['a', 'b'], ['a', 'c'], ['a'], ['b', 'c'], ['b'], ['c'], []]
|
|
320
319
|
```
|
|
321
320
|
|
|
322
|
-
|
|
323
321
|
## Debugging ##
|
|
324
322
|
|
|
325
323
|
For the best debugging experience with memory_graph set for example expression:
|
|
@@ -463,7 +461,7 @@ class BinTree:
|
|
|
463
461
|
tree = BinTree()
|
|
464
462
|
n = 100
|
|
465
463
|
for i in range(n):
|
|
466
|
-
new_value = random.randrange(
|
|
464
|
+
new_value = random.randrange(n)
|
|
467
465
|
tree.add(new_value)
|
|
468
466
|
```
|
|
469
467
|
|
|
@@ -534,6 +532,27 @@ Different aspects of memory_graph can be configured. The default configuration i
|
|
|
534
532
|
- ***mg.config.type_to_slicer*** : dict
|
|
535
533
|
- Maps each type to a Slicer. A slicer determines how many elements of a data type are shown in the graph to prevent the graph from getting too big. 'Slicer()' does no slicing, 'Slicer(1,2,3)' shows just 1 element at the beginning, 2 in the middle, and 3 at the end.
|
|
536
534
|
|
|
535
|
+
### Simplified Graph ###
|
|
536
|
+
Memory_graph simplifies the visualization (and the viewer's mental model) by **not** showing separate nodes for immutable types like `bool`, `int`, `float`, `complex`, and `str` by default. This simplification can sometimes be slightly misleading. As in the example below, after a shallow copy, lists `a` and `b` technically share their `int` values, but the graph makes it appear as though `a` and `b` each have their own copies. However, since `int` is immutable, this simplification will never lead to unexpected changes—changing `a` won’t effect `b`.
|
|
537
|
+
|
|
538
|
+
The simplification strikes a balance: it is slightly misleading but keeps the graph clean and easy to understand and focuses on the mutable types where unexpected changes can occur. This is why it is the default behavior. If you do want to show separate nodes for `int` values, such as for educational purposes, you can simply remove `int` from the `mg.config.not_node_types` set:
|
|
539
|
+
```python
|
|
540
|
+
import memory_graph as mg
|
|
541
|
+
|
|
542
|
+
a = [100, 200, 300]
|
|
543
|
+
b = a.copy()
|
|
544
|
+
mg.render(locals(), 'not_node_types1.png')
|
|
545
|
+
|
|
546
|
+
mg.config.not_node_types.remove(int) # now show separate nodes for int values
|
|
547
|
+
|
|
548
|
+
mg.render(locals(), 'not_node_types2.png')
|
|
549
|
+
```
|
|
550
|
+
|  |  |
|
|
551
|
+
|:-----------------------------------------------------------:|:-------------------------------------------------------------:|
|
|
552
|
+
| not_node_types1.png — simplified | not_node_types2.png — technically correct |
|
|
553
|
+
|
|
554
|
+
Additionally, the simplification hides the [reuse of small int values](https://docs.python.org/3/c-api/long.html#c.PyLong_FromLong) in the current CPython implementation, an optimization that might otherwise confuse beginner Python programmers. For instance, after executing `a[1]+=1; b[1]+=1` the `201` value is, maybe surprisingly, still shared between `a` and `b`, whereas executing `a[2]+=1; b[2]+=1` does not result in sharing the `301` value.
|
|
555
|
+
|
|
537
556
|
### Temporary Configuration ###
|
|
538
557
|
In addition to the global configuration, a temporary configuration can be set for a single `show()` or `render()` call to change the colors, orientation, and slicer. This example highlights a particular list element in red, gives it a horizontal orientation, and overwrites the default slicer for lists:
|
|
539
558
|
|
|
@@ -545,7 +564,7 @@ data = [ list(range(20)) for i in range(1,5)]
|
|
|
545
564
|
highlight = data[2]
|
|
546
565
|
|
|
547
566
|
mg.show( locals(),
|
|
548
|
-
colors = {id(highlight): "red" }, # set color to
|
|
567
|
+
colors = {id(highlight): "red" }, # set color to red
|
|
549
568
|
vertical_orientations = {id(highlight): False }, # set horizontal orientation
|
|
550
569
|
slicers = {id(highlight): Slicer()} # set no slicing
|
|
551
570
|
)
|
|
@@ -736,7 +755,7 @@ display( mg.create_graph(mg.locals_jupyter()) ) # display the local variables in
|
|
|
736
755
|
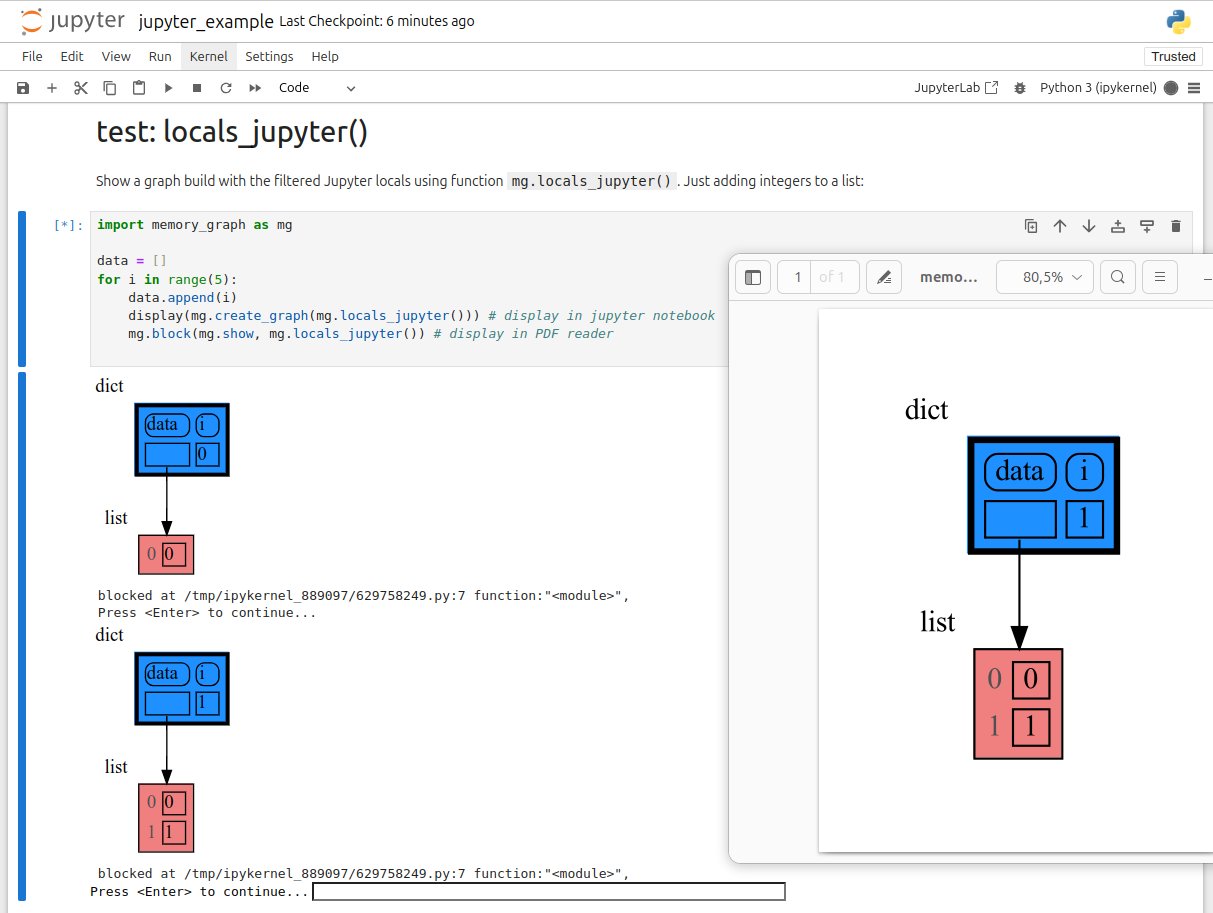
mg.block(display, mg.create_graph(mg.locals_jupyter()) ) # the same but blocked
|
|
737
756
|
```
|
|
738
757
|
|
|
739
|
-
See for example [jupyter_example.ipynb](https://raw.githubusercontent.com/bterwijn/memory_graph/main/
|
|
758
|
+
See for example [jupyter_example.ipynb](https://raw.githubusercontent.com/bterwijn/memory_graph/main/src/jupyter_example.ipynb).
|
|
740
759
|
|
|
741
760
|
|
|
742
761
|
## ipython ##
|
|
@@ -758,3 +777,6 @@ We can also run memory_graph in the browser: <a href="https://bterwijn.github.io
|
|
|
758
777
|
- Adobe Acrobat Reader [doesn't refresh a PDF file](https://superuser.com/questions/337011/windows-pdf-viewer-that-auto-refreshes-pdf-when-compiling-with-pdflatex) when it changes on disk and blocks updates which results in an `Could not open 'somefile.pdf' for writing : Permission denied` error. One solution is to install a PDF reader that does refresh ([Evince](https://www.fosshub.com/Evince.html), [Okular](https://okular.kde.org/), [SumatraPDF](https://www.sumatrapdfreader.org/), ...) and set it as the default PDF reader. Another solution is to `render()` the graph to a different output format and to open it manually.
|
|
759
778
|
|
|
760
779
|
- When graph edges overlap it can be hard to distinguish them. Using an interactive graphviz viewer, such as [xdot](https://github.com/jrfonseca/xdot.py), on a '*.gv' DOT output file will help.
|
|
780
|
+
|
|
781
|
+
### Invocation_Tree Package ###
|
|
782
|
+
The [memory_graph](https://pypi.org/project/memory-graph/) package visualizes your data. If instead you want to visualize function calls, check out the [invocation_tree](https://pypi.org/project/invocation-tree/) package.
|
|
@@ -1,22 +1,3 @@
|
|
|
1
|
-
Metadata-Version: 2.1
|
|
2
|
-
Name: memory_graph
|
|
3
|
-
Version: 0.3.12
|
|
4
|
-
Summary: Draws a graph of your data to analyze its structure.
|
|
5
|
-
Home-page: https://github.com/bterwijn/memory_graph
|
|
6
|
-
Author: Bas Terwijn
|
|
7
|
-
Author-email: bterwijn@gmail.com
|
|
8
|
-
License: BSD 2-clause
|
|
9
|
-
Classifier: Development Status :: 4 - Beta
|
|
10
|
-
Classifier: Intended Audience :: Education
|
|
11
|
-
Classifier: Intended Audience :: Developers
|
|
12
|
-
Classifier: License :: OSI Approved :: BSD License
|
|
13
|
-
Classifier: Programming Language :: Python :: 3
|
|
14
|
-
Classifier: Topic :: Education
|
|
15
|
-
Classifier: Topic :: Software Development :: Debuggers
|
|
16
|
-
Description-Content-Type: text/markdown
|
|
17
|
-
License-File: LICENSE.txt
|
|
18
|
-
Requires-Dist: graphviz
|
|
19
|
-
|
|
20
1
|
# Installation #
|
|
21
2
|
Install (or upgrade) `memory_graph` using pip:
|
|
22
3
|
```
|
|
@@ -24,9 +5,35 @@ pip install --upgrade memory_graph
|
|
|
24
5
|
```
|
|
25
6
|
Additionally [Graphviz](https://graphviz.org/download/) needs to be installed.
|
|
26
7
|
|
|
27
|
-
#
|
|
8
|
+
# Memory Graph #
|
|
9
|
+
For program understanding and debugging, the [memory_graph](https://pypi.org/project/memory-graph/) package can visualize your data, supporting many different data types, including but not limited to:
|
|
10
|
+
|
|
11
|
+
```python
|
|
12
|
+
import memory_graph as mg
|
|
13
|
+
|
|
14
|
+
class MyClass:
|
|
15
|
+
|
|
16
|
+
def __init__(self, x, y):
|
|
17
|
+
self.x = x
|
|
18
|
+
self.y = y
|
|
19
|
+
|
|
20
|
+
data = [ range(1, 2), (3, 4), {5, 6}, {7:'seven', 8:'eight'}, MyClass(9, 10) ]
|
|
21
|
+
mg.show(data)
|
|
22
|
+
```
|
|
23
|
+

|
|
24
|
+
|
|
25
|
+
Instead of showing the graph on screen you can also render it to an output file of your choosing (see [Graphviz Output Formats](https://graphviz.org/docs/outputs/)) using for example:
|
|
26
|
+
|
|
27
|
+
```python
|
|
28
|
+
mg.render(data, "my_graph.pdf")
|
|
29
|
+
mg.render(data, "my_graph.svg")
|
|
30
|
+
mg.render(data, "my_graph.png")
|
|
31
|
+
mg.render(data, "my_graph.gv") # Graphviz DOT file
|
|
32
|
+
mg.render(data) # renders to 'mg.render_filename' with default value: 'memory_graph.pdf'
|
|
33
|
+
```
|
|
28
34
|
|
|
29
|
-
|
|
35
|
+
# Sharing Values #
|
|
36
|
+
In Python, assigning the list from variable `a` to variable `b` causes both variables to reference the same list value and thus share it. Consequently, any change applied through one variable will impact the other. This behavior can lead to elusive bugs if a programmer incorrectly assumes that list `a` and `b` are independent.
|
|
30
37
|
|
|
31
38
|
<table><tr><td>
|
|
32
39
|
|
|
@@ -67,33 +74,6 @@ identical?: True
|
|
|
67
74
|
```
|
|
68
75
|
A better way to understand what data is shared is to draw a graph of the data using the [memory_graph](https://pypi.org/project/memory-graph/) package.
|
|
69
76
|
|
|
70
|
-
# Memory Graph #
|
|
71
|
-
The [memory_graph](https://pypi.org/project/memory-graph/) package can graph many different data types, not limited to:
|
|
72
|
-
|
|
73
|
-
```python
|
|
74
|
-
import memory_graph as mg
|
|
75
|
-
|
|
76
|
-
class MyClass:
|
|
77
|
-
|
|
78
|
-
def __init__(self, x, y):
|
|
79
|
-
self.x = x
|
|
80
|
-
self.y = y
|
|
81
|
-
|
|
82
|
-
data = [ range(1, 2), (3, 4), {5, 6}, {7:'seven', 8:'eight'}, MyClass(9, 10) ]
|
|
83
|
-
mg.show(data)
|
|
84
|
-
```
|
|
85
|
-

|
|
86
|
-
|
|
87
|
-
Instead of showing the graph you can also render it to an output file of your choosing (see [Graphviz Output Formats](https://graphviz.org/docs/outputs/)) using for example:
|
|
88
|
-
|
|
89
|
-
```python
|
|
90
|
-
mg.render(data, "my_graph.pdf")
|
|
91
|
-
mg.render(data, "my_graph.svg")
|
|
92
|
-
mg.render(data, "my_graph.png")
|
|
93
|
-
mg.render(data, "my_graph.gv") # Graphviz DOT file
|
|
94
|
-
mg.render(data) # renders to 'mg.render_filename' with default value: 'memory_graph.pdf'
|
|
95
|
-
```
|
|
96
|
-
|
|
97
77
|
# Chapters #
|
|
98
78
|
|
|
99
79
|
[Python Data Model](#python-data-model)
|
|
@@ -197,7 +177,7 @@ mg.show(locals())
|
|
|
197
177
|

|
|
198
178
|
|
|
199
179
|
|
|
200
|
-
### Custom Copy
|
|
180
|
+
### Custom Copy ###
|
|
201
181
|
We can write our own custom copy function or method in case the three "copy" options don't do what we want. For example, in the code below the copy() method of My_Class copies the `digits` but shares the `letters` between two objects.
|
|
202
182
|
|
|
203
183
|
```python
|
|
@@ -224,7 +204,7 @@ mg.show(locals())
|
|
|
224
204
|
|
|
225
205
|
|
|
226
206
|
## Call Stack ##
|
|
227
|
-
The `mg.get_call_stack()` function retrieves the entire call stack, including the local variables for each function on the stack. This enables us to visualize the local variables across all active functions simultaneously.
|
|
207
|
+
The `mg.get_call_stack()` function retrieves the entire call stack, including the local variables for each function on the stack. This enables us to visualize the local variables across all active functions simultaneously. By examining the graph, we can determine whether any local variables from different functions share data. For instance, consider the function `add_one()` which adds the value `1` to each of its parameters `a`, `b`, and `c`.
|
|
228
208
|
|
|
229
209
|
```python
|
|
230
210
|
import memory_graph as mg
|
|
@@ -252,7 +232,7 @@ a:[4, 3, 2, 1] b:(4, 3, 2) c:[4, 3, 2]
|
|
|
252
232
|
This is because `b` is of immutable type 'tuple' so its value gets copied automatically when it is changed. And because the function is called with a copy of `c`, its original value is not changed by the function. The value of variable `a` is the only value of mutable type that is shared between the root stack frame **'0: \<module>'** and the **'1: add_one'** stack frame of the function so only that variable is affected as a result of the function call. The other changes remain confined to the local variables of the ```add_one()``` function.
|
|
253
233
|
|
|
254
234
|
### Block ###
|
|
255
|
-
It is often helpful to temporarily block program execution to inspect the graph. For this
|
|
235
|
+
It is often helpful to temporarily block program execution to inspect the graph. For this we can use the `mg.block()` function:
|
|
256
236
|
|
|
257
237
|
```python
|
|
258
238
|
mg.block(fun, arg1, arg2, ...)
|
|
@@ -264,7 +244,7 @@ This function:
|
|
|
264
244
|
* then blocks execution until the <Enter> key is pressed
|
|
265
245
|
* finally returns the value of the `fun()` call
|
|
266
246
|
|
|
267
|
-
|
|
247
|
+
To change its behavior:
|
|
268
248
|
* Set `mg.block_prints_location = False` to skip printing the source location.
|
|
269
249
|
* Set `mg.press_enter_message = None` to skip printing "Press <Enter> to continue...".
|
|
270
250
|
|
|
@@ -319,7 +299,6 @@ print( power_set(['a', 'b', 'c']) )
|
|
|
319
299
|
[['a', 'b', 'c'], ['a', 'b'], ['a', 'c'], ['a'], ['b', 'c'], ['b'], ['c'], []]
|
|
320
300
|
```
|
|
321
301
|
|
|
322
|
-
|
|
323
302
|
## Debugging ##
|
|
324
303
|
|
|
325
304
|
For the best debugging experience with memory_graph set for example expression:
|
|
@@ -463,7 +442,7 @@ class BinTree:
|
|
|
463
442
|
tree = BinTree()
|
|
464
443
|
n = 100
|
|
465
444
|
for i in range(n):
|
|
466
|
-
new_value = random.randrange(
|
|
445
|
+
new_value = random.randrange(n)
|
|
467
446
|
tree.add(new_value)
|
|
468
447
|
```
|
|
469
448
|

|
|
@@ -534,6 +513,27 @@ Different aspects of memory_graph can be configured. The default configuration i
|
|
|
534
513
|
- ***mg.config.type_to_slicer*** : dict
|
|
535
514
|
- Maps each type to a Slicer. A slicer determines how many elements of a data type are shown in the graph to prevent the graph from getting too big. 'Slicer()' does no slicing, 'Slicer(1,2,3)' shows just 1 element at the beginning, 2 in the middle, and 3 at the end.
|
|
536
515
|
|
|
516
|
+
### Simplified Graph ###
|
|
517
|
+
Memory_graph simplifies the visualization (and the viewer's mental model) by **not** showing separate nodes for immutable types like `bool`, `int`, `float`, `complex`, and `str` by default. This simplification can sometimes be slightly misleading. As in the example below, after a shallow copy, lists `a` and `b` technically share their `int` values, but the graph makes it appear as though `a` and `b` each have their own copies. However, since `int` is immutable, this simplification will never lead to unexpected changes—changing `a` won’t effect `b`.
|
|
518
|
+
|
|
519
|
+
The simplification strikes a balance: it is slightly misleading but keeps the graph clean and easy to understand and focuses on the mutable types where unexpected changes can occur. This is why it is the default behavior. If you do want to show separate nodes for `int` values, such as for educational purposes, you can simply remove `int` from the `mg.config.not_node_types` set:
|
|
520
|
+
```python
|
|
521
|
+
import memory_graph as mg
|
|
522
|
+
|
|
523
|
+
a = [100, 200, 300]
|
|
524
|
+
b = a.copy()
|
|
525
|
+
mg.render(locals(), 'not_node_types1.png')
|
|
526
|
+
|
|
527
|
+
mg.config.not_node_types.remove(int) # now show separate nodes for int values
|
|
528
|
+
|
|
529
|
+
mg.render(locals(), 'not_node_types2.png')
|
|
530
|
+
```
|
|
531
|
+
|  |  |
|
|
532
|
+
|:-----------------------------------------------------------:|:-------------------------------------------------------------:|
|
|
533
|
+
| not_node_types1.png — simplified | not_node_types2.png — technically correct |
|
|
534
|
+
|
|
535
|
+
Additionally, the simplification hides the [reuse of small int values](https://docs.python.org/3/c-api/long.html#c.PyLong_FromLong) in the current CPython implementation, an optimization that might otherwise confuse beginner Python programmers. For instance, after executing `a[1]+=1; b[1]+=1` the `201` value is, maybe surprisingly, still shared between `a` and `b`, whereas executing `a[2]+=1; b[2]+=1` does not result in sharing the `301` value.
|
|
536
|
+
|
|
537
537
|
### Temporary Configuration ###
|
|
538
538
|
In addition to the global configuration, a temporary configuration can be set for a single `show()` or `render()` call to change the colors, orientation, and slicer. This example highlights a particular list element in red, gives it a horizontal orientation, and overwrites the default slicer for lists:
|
|
539
539
|
|
|
@@ -545,7 +545,7 @@ data = [ list(range(20)) for i in range(1,5)]
|
|
|
545
545
|
highlight = data[2]
|
|
546
546
|
|
|
547
547
|
mg.show( locals(),
|
|
548
|
-
colors = {id(highlight): "red" }, # set color to
|
|
548
|
+
colors = {id(highlight): "red" }, # set color to red
|
|
549
549
|
vertical_orientations = {id(highlight): False }, # set horizontal orientation
|
|
550
550
|
slicers = {id(highlight): Slicer()} # set no slicing
|
|
551
551
|
)
|
|
@@ -736,7 +736,7 @@ display( mg.create_graph(mg.locals_jupyter()) ) # display the local variables in
|
|
|
736
736
|
mg.block(display, mg.create_graph(mg.locals_jupyter()) ) # the same but blocked
|
|
737
737
|
```
|
|
738
738
|
|
|
739
|
-
See for example [jupyter_example.ipynb](https://raw.githubusercontent.com/bterwijn/memory_graph/main/
|
|
739
|
+
See for example [jupyter_example.ipynb](https://raw.githubusercontent.com/bterwijn/memory_graph/main/src/jupyter_example.ipynb).
|
|
740
740
|

|
|
741
741
|
|
|
742
742
|
## ipython ##
|
|
@@ -758,3 +758,6 @@ We can also run memory_graph in the browser: <a href="https://bterwijn.github.io
|
|
|
758
758
|
- Adobe Acrobat Reader [doesn't refresh a PDF file](https://superuser.com/questions/337011/windows-pdf-viewer-that-auto-refreshes-pdf-when-compiling-with-pdflatex) when it changes on disk and blocks updates which results in an `Could not open 'somefile.pdf' for writing : Permission denied` error. One solution is to install a PDF reader that does refresh ([Evince](https://www.fosshub.com/Evince.html), [Okular](https://okular.kde.org/), [SumatraPDF](https://www.sumatrapdfreader.org/), ...) and set it as the default PDF reader. Another solution is to `render()` the graph to a different output format and to open it manually.
|
|
759
759
|
|
|
760
760
|
- When graph edges overlap it can be hard to distinguish them. Using an interactive graphviz viewer, such as [xdot](https://github.com/jrfonseca/xdot.py), on a '*.gv' DOT output file will help.
|
|
761
|
+
|
|
762
|
+
### Invocation_Tree Package ###
|
|
763
|
+
The [memory_graph](https://pypi.org/project/memory-graph/) package visualizes your data. If instead you want to visualize function calls, check out the [invocation_tree](https://pypi.org/project/invocation-tree/) package.
|
|
Binary file
|
|
@@ -0,0 +1,41 @@
|
|
|
1
|
+
import memory_graph as mg
|
|
2
|
+
import bintrees
|
|
3
|
+
|
|
4
|
+
# Create an AVL tree
|
|
5
|
+
tree = bintrees.AVLTree()
|
|
6
|
+
tree.insert(10, "ten")
|
|
7
|
+
tree.insert(5, "five")
|
|
8
|
+
tree.insert(20, "twenty")
|
|
9
|
+
tree.insert(15, "fifteen")
|
|
10
|
+
|
|
11
|
+
mg.render(locals(), 'avltree_fail.png')
|
|
12
|
+
|
|
13
|
+
mg.config.type_to_color[bintrees.avltree.Node] = "sandybrown"
|
|
14
|
+
mg.render(locals(), 'avltree_color.png')
|
|
15
|
+
|
|
16
|
+
mg.config.type_to_node[bintrees.avltree.Node] = lambda data: mg.node_linear.Node_Linear(data, dir(data))
|
|
17
|
+
mg.config.type_to_slicer[bintrees.avltree.Node] = mg.slicer.Slicer()
|
|
18
|
+
mg.render(locals(), 'avltree_dir.png')
|
|
19
|
+
|
|
20
|
+
mg.config.type_to_node[bintrees.avltree.Node] = lambda data: mg.node_base.Node_Base(f"key:{data.key} value:{data.value}")
|
|
21
|
+
mg.render(locals(), 'avltree_base.png')
|
|
22
|
+
|
|
23
|
+
mg.config.type_to_node[bintrees.avltree.Node] = lambda data: mg.node_linear.Node_Linear(data,
|
|
24
|
+
['left', data.left,
|
|
25
|
+
'key', data.key,
|
|
26
|
+
'value', data.value,
|
|
27
|
+
'right', data.right])
|
|
28
|
+
mg.render(locals(), 'avltree_linear.png')
|
|
29
|
+
|
|
30
|
+
mg.config.type_to_node[bintrees.avltree.Node] = lambda data: mg.node_key_value.Node_Key_Value(data,
|
|
31
|
+
{'left': data.left,
|
|
32
|
+
'key': data.key,
|
|
33
|
+
'value': data.value,
|
|
34
|
+
'right': data.right}.items())
|
|
35
|
+
mg.render(locals(), 'avltree_key_value.png')
|
|
36
|
+
|
|
37
|
+
mg.config.type_to_node[bintrees.avltree.Node] = lambda data: mg.node_table.Node_Table(data,
|
|
38
|
+
[[data.key, data.value],
|
|
39
|
+
[data.left, data.right]]
|
|
40
|
+
)
|
|
41
|
+
mg.render(locals(), 'avltree_table.png')
|
|
Binary file
|
|
Binary file
|
|
@@ -0,0 +1,26 @@
|
|
|
1
|
+
digraph memory_graph {
|
|
2
|
+
node [shape=plaintext]
|
|
3
|
+
node130513740275104 [label=<
|
|
4
|
+
<TABLE BORDER="0" CELLBORDER="1" CELLSPACING="0" CELLPADDING="0" BGCOLOR="white"><TR><TD PORT="table">
|
|
5
|
+
<bintrees.avltree.Node object at 0x76b3992...
|
|
6
|
+
</TD></TR></TABLE>
|
|
7
|
+
> xlabel="Node"]
|
|
8
|
+
node130513740453920 [label=<
|
|
9
|
+
<TABLE BORDER="0" CELLBORDER="1" CELLSPACING="0" CELLPADDING="0" BGCOLOR="seagreen1"><TR><TD PORT="table">
|
|
10
|
+
<TABLE BORDER="0" CELLBORDER="0" CELLSPACING="5" CELLPADDING="0">
|
|
11
|
+
<TR><TD BORDER="1" STYLE="ROUNDED"> _root </TD><TD BORDER="1" STYLE="ROUNDED"> _count </TD></TR>
|
|
12
|
+
<TR><TD BORDER="1" PORT="ref0"> </TD><TD BORDER="1"> 4 </TD></TR>
|
|
13
|
+
</TABLE>
|
|
14
|
+
</TD></TR></TABLE>
|
|
15
|
+
> xlabel=AVLTree]
|
|
16
|
+
node130513740453920:ref0 -> node130513740275104:table [style=solid]
|
|
17
|
+
node130513742307200 [label=<
|
|
18
|
+
<TABLE BORDER="0" CELLBORDER="3" CELLSPACING="0" CELLPADDING="0" BGCOLOR="dodgerblue1"><TR><TD PORT="table">
|
|
19
|
+
<TABLE BORDER="0" CELLBORDER="0" CELLSPACING="5" CELLPADDING="0">
|
|
20
|
+
<TR><TD BORDER="1" STYLE="ROUNDED"> tree </TD></TR>
|
|
21
|
+
<TR><TD BORDER="1" PORT="ref0"> </TD></TR>
|
|
22
|
+
</TABLE>
|
|
23
|
+
</TD></TR></TABLE>
|
|
24
|
+
> xlabel=dict]
|
|
25
|
+
node130513742307200:ref0 -> node130513740453920:table [style=solid]
|
|
26
|
+
}
|
|
Binary file
|
|
Binary file
|
|
Binary file
|
|
Binary file
|
|
Binary file
|
|
Binary file
|
|
@@ -9,7 +9,7 @@ files=$(ls -v $name*.png)
|
|
|
9
9
|
echo "creating gif with:"
|
|
10
10
|
echo "$files"
|
|
11
11
|
|
|
12
|
-
largest_size=$(identify -format "%Wx%H %f\n" $name*.png | sort -nr | head -n1)
|
|
12
|
+
largest_size=$(identify -format "%H %Wx%H %f\n" $name*.png | sort -nr | head -n1| awk '{print $2}')
|
|
13
13
|
echo "largest_size: $largest_size"
|
|
14
14
|
|
|
15
15
|
echo "resizing images"
|
|
Binary file
|
|
Binary file
|
|
Binary file
|
|
Binary file
|
|
Binary file
|
|
Binary file
|
|
Binary file
|
|
Binary file
|
|
Binary file
|
|
Binary file
|
|
Binary file
|
|
Binary file
|
|
Binary file
|
|
Binary file
|
|
Binary file
|
|
Binary file
|
|
Binary file
|
|
Binary file
|
|
Binary file
|
|
Binary file
|
|
Binary file
|
|
Binary file
|
|
Binary file
|
|
@@ -0,0 +1,20 @@
|
|
|
1
|
+
digraph memory_graph {
|
|
2
|
+
node [shape=plaintext]
|
|
3
|
+
node126810958314944 [label=<
|
|
4
|
+
<TABLE BORDER="0" CELLBORDER="1" CELLSPACING="0" CELLPADDING="0" BGCOLOR="lightcoral"><TR><TD PORT="table">
|
|
5
|
+
<TABLE BORDER="0" CELLBORDER="0" CELLSPACING="5" CELLPADDING="0">
|
|
6
|
+
<TR><TD><font color="#505050">0</font></TD><TD BORDER="1"> 0 </TD></TR>
|
|
7
|
+
<TR><TD><font color="#505050">1</font></TD><TD BORDER="1"> 1 </TD></TR>
|
|
8
|
+
</TABLE>
|
|
9
|
+
</TD></TR></TABLE>
|
|
10
|
+
> xlabel=list]
|
|
11
|
+
node126810936962048 [label=<
|
|
12
|
+
<TABLE BORDER="0" CELLBORDER="3" CELLSPACING="0" CELLPADDING="0" BGCOLOR="dodgerblue1"><TR><TD PORT="table">
|
|
13
|
+
<TABLE BORDER="0" CELLBORDER="0" CELLSPACING="5" CELLPADDING="0">
|
|
14
|
+
<TR><TD BORDER="1" STYLE="ROUNDED"> data </TD><TD BORDER="1" STYLE="ROUNDED"> i </TD></TR>
|
|
15
|
+
<TR><TD BORDER="1" PORT="ref0"> </TD><TD BORDER="1"> 1 </TD></TR>
|
|
16
|
+
</TABLE>
|
|
17
|
+
</TD></TR></TABLE>
|
|
18
|
+
> xlabel=dict]
|
|
19
|
+
node126810936962048:ref0 -> node126810958314944:table [style=solid]
|
|
20
|
+
}
|
|
Binary file
|
|
Binary file
|
|
Binary file
|
|
@@ -0,0 +1,35 @@
|
|
|
1
|
+
digraph memory_graph {
|
|
2
|
+
node [shape=plaintext]
|
|
3
|
+
node123611189233536 [label=<
|
|
4
|
+
<TABLE BORDER="0" CELLBORDER="1" CELLSPACING="0" CELLPADDING="0" BGCOLOR="lightcoral"><TR><TD PORT="table">
|
|
5
|
+
<TABLE BORDER="0" CELLBORDER="0" CELLSPACING="5" CELLPADDING="0">
|
|
6
|
+
<TR><TD><font color="#505050">0</font></TD><TD BORDER="1"> 1 </TD></TR>
|
|
7
|
+
<TR><TD><font color="#505050">1</font></TD><TD BORDER="1"> 2 </TD></TR>
|
|
8
|
+
<TR><TD><font color="#505050">2</font></TD><TD BORDER="1"> 3 </TD></TR>
|
|
9
|
+
<TR><TD><font color="#505050">3</font></TD><TD BORDER="1"> 0 </TD></TR>
|
|
10
|
+
<TR><TD><font color="#505050">4</font></TD><TD BORDER="1"> 1 </TD></TR>
|
|
11
|
+
<TR><TD><font color="#505050">5</font></TD><TD BORDER="1"> 4 </TD></TR>
|
|
12
|
+
<TR><TD><font color="#505050">6</font></TD><TD BORDER="1"> 9 </TD></TR>
|
|
13
|
+
<TR><TD><font color="#505050">7</font></TD><TD BORDER="1"> 16 </TD></TR>
|
|
14
|
+
</TABLE>
|
|
15
|
+
</TD></TR></TABLE>
|
|
16
|
+
> xlabel=list]
|
|
17
|
+
node123611188190208 [label=<
|
|
18
|
+
<TABLE BORDER="0" CELLBORDER="1" CELLSPACING="0" CELLPADDING="0" BGCOLOR="dodgerblue1"><TR><TD PORT="table">
|
|
19
|
+
<TABLE BORDER="0" CELLBORDER="0" CELLSPACING="5" CELLPADDING="0">
|
|
20
|
+
<TR><TD BORDER="1" STYLE="ROUNDED"> d </TD><TD BORDER="1" STYLE="ROUNDED"> i </TD></TR>
|
|
21
|
+
<TR><TD BORDER="1" PORT="ref0"> </TD><TD BORDER="1"> 4 </TD></TR>
|
|
22
|
+
</TABLE>
|
|
23
|
+
</TD></TR></TABLE>
|
|
24
|
+
> xlabel=dict]
|
|
25
|
+
node123611188190208:ref0 -> node123611189233536:table [style=solid]
|
|
26
|
+
node123611178012800 [label=<
|
|
27
|
+
<TABLE BORDER="0" CELLBORDER="1" CELLSPACING="0" CELLPADDING="0" BGCOLOR="dodgerblue1"><TR><TD PORT="table">
|
|
28
|
+
<TABLE BORDER="0" CELLBORDER="0" CELLSPACING="5" CELLPADDING="0">
|
|
29
|
+
<TR><TD BORDER="1" STYLE="ROUNDED"> 0: <module> </TD></TR>
|
|
30
|
+
<TR><TD BORDER="1" PORT="ref0"> </TD></TR>
|
|
31
|
+
</TABLE>
|
|
32
|
+
</TD></TR></TABLE>
|
|
33
|
+
> xlabel=dict]
|
|
34
|
+
node123611178012800:ref0 -> node123611188190208:table [style=solid]
|
|
35
|
+
}
|
|
Binary file
|