memory-graph 0.3.11__tar.gz → 0.3.13__tar.gz
This diff represents the content of publicly available package versions that have been released to one of the supported registries. The information contained in this diff is provided for informational purposes only and reflects changes between package versions as they appear in their respective public registries.
- {memory_graph-0.3.11/memory_graph.egg-info → memory_graph-0.3.13}/PKG-INFO +30 -9
- {memory_graph-0.3.11 → memory_graph-0.3.13}/README.md +29 -8
- {memory_graph-0.3.11 → memory_graph-0.3.13}/memory_graph/__init__.py +4 -2
- {memory_graph-0.3.11 → memory_graph-0.3.13}/memory_graph/html_table.py +26 -31
- memory_graph-0.3.13/memory_graph/t.py +6 -0
- {memory_graph-0.3.11 → memory_graph-0.3.13/memory_graph.egg-info}/PKG-INFO +30 -9
- {memory_graph-0.3.11 → memory_graph-0.3.13}/memory_graph.egg-info/SOURCES.txt +1 -0
- {memory_graph-0.3.11 → memory_graph-0.3.13}/setup.py +1 -1
- {memory_graph-0.3.11 → memory_graph-0.3.13}/LICENSE.txt +0 -0
- {memory_graph-0.3.11 → memory_graph-0.3.13}/MANIFEST.in +0 -0
- {memory_graph-0.3.11 → memory_graph-0.3.13}/memory_graph/config.py +0 -0
- {memory_graph-0.3.11 → memory_graph-0.3.13}/memory_graph/config_default.py +0 -0
- {memory_graph-0.3.11 → memory_graph-0.3.13}/memory_graph/config_helpers.py +0 -0
- {memory_graph-0.3.11 → memory_graph-0.3.13}/memory_graph/extension_numpy.py +0 -0
- {memory_graph-0.3.11 → memory_graph-0.3.13}/memory_graph/extension_pandas.py +0 -0
- {memory_graph-0.3.11 → memory_graph-0.3.13}/memory_graph/list_view.py +0 -0
- {memory_graph-0.3.11 → memory_graph-0.3.13}/memory_graph/memory_to_nodes.py +0 -0
- {memory_graph-0.3.11 → memory_graph-0.3.13}/memory_graph/node_base.py +0 -0
- {memory_graph-0.3.11 → memory_graph-0.3.13}/memory_graph/node_key_value.py +0 -0
- {memory_graph-0.3.11 → memory_graph-0.3.13}/memory_graph/node_linear.py +0 -0
- {memory_graph-0.3.11 → memory_graph-0.3.13}/memory_graph/node_table.py +0 -0
- {memory_graph-0.3.11 → memory_graph-0.3.13}/memory_graph/sequence.py +0 -0
- {memory_graph-0.3.11 → memory_graph-0.3.13}/memory_graph/slicer.py +0 -0
- {memory_graph-0.3.11 → memory_graph-0.3.13}/memory_graph/slices.py +0 -0
- {memory_graph-0.3.11 → memory_graph-0.3.13}/memory_graph/slices_iterator.py +0 -0
- {memory_graph-0.3.11 → memory_graph-0.3.13}/memory_graph/slices_table_iterator.py +0 -0
- {memory_graph-0.3.11 → memory_graph-0.3.13}/memory_graph/test.py +0 -0
- {memory_graph-0.3.11 → memory_graph-0.3.13}/memory_graph/test_max_graph_depth.py +0 -0
- {memory_graph-0.3.11 → memory_graph-0.3.13}/memory_graph/test_memory_graph.py +0 -0
- {memory_graph-0.3.11 → memory_graph-0.3.13}/memory_graph/test_memory_to_nodes.py +0 -0
- {memory_graph-0.3.11 → memory_graph-0.3.13}/memory_graph/test_sequence.py +0 -0
- {memory_graph-0.3.11 → memory_graph-0.3.13}/memory_graph/test_slicer.py +0 -0
- {memory_graph-0.3.11 → memory_graph-0.3.13}/memory_graph/test_slices.py +0 -0
- {memory_graph-0.3.11 → memory_graph-0.3.13}/memory_graph/test_slices_iterator.py +0 -0
- {memory_graph-0.3.11 → memory_graph-0.3.13}/memory_graph/utils.py +0 -0
- {memory_graph-0.3.11 → memory_graph-0.3.13}/memory_graph.egg-info/dependency_links.txt +0 -0
- {memory_graph-0.3.11 → memory_graph-0.3.13}/memory_graph.egg-info/requires.txt +0 -0
- {memory_graph-0.3.11 → memory_graph-0.3.13}/memory_graph.egg-info/top_level.txt +0 -0
- {memory_graph-0.3.11 → memory_graph-0.3.13}/setup.cfg +0 -0
|
@@ -1,6 +1,6 @@
|
|
|
1
1
|
Metadata-Version: 2.1
|
|
2
2
|
Name: memory_graph
|
|
3
|
-
Version: 0.3.
|
|
3
|
+
Version: 0.3.13
|
|
4
4
|
Summary: Draws a graph of your data to analyze its structure.
|
|
5
5
|
Home-page: https://github.com/bterwijn/memory_graph
|
|
6
6
|
Author: Bas Terwijn
|
|
@@ -156,7 +156,7 @@ mg.render(locals(), 'immutable2.png')
|
|
|
156
156
|
|
|
157
157
|
|
|
158
158
|
### Mutable Type ###
|
|
159
|
-
With mutable types the result is different. In the code below variable `a` and `b` both reference the same `list` value [4, 3, 2]. A `list` is a mutable type and therefore when we change variable `a` its value **can** be mutated in place and thus `a` and `b` both reference the same new value afterwards. Thus changing `a` also changes `b` and vice versa. Sometimes we want this but other times we don't and then we will have to make a copy so that `a` and `b` are independent.
|
|
159
|
+
With mutable types the result is different. In the code below variable `a` and `b` both reference the same `list` value [4, 3, 2]. A `list` is a mutable type and therefore when we change variable `a` its value **can** be mutated in place and thus `a` and `b` both reference the same new value afterwards. Thus changing `a` also changes `b` and vice versa. Sometimes we want this but other times we don't and then we will have to make a copy ourselfs so that `a` and `b` are independent.
|
|
160
160
|
|
|
161
161
|
```python
|
|
162
162
|
import memory_graph as mg
|
|
@@ -264,7 +264,7 @@ This function:
|
|
|
264
264
|
* then blocks execution until the <Enter> key is pressed
|
|
265
265
|
* finally returns the value of the `fun()` call
|
|
266
266
|
|
|
267
|
-
to change
|
|
267
|
+
to change its behavior:
|
|
268
268
|
* Set `mg.block_prints_location = False` to skip printing the source location.
|
|
269
269
|
* Set `mg.press_enter_message = None` to skip printing "Press <Enter> to continue...".
|
|
270
270
|
|
|
@@ -326,7 +326,7 @@ For the best debugging experience with memory_graph set for example expression:
|
|
|
326
326
|
```
|
|
327
327
|
mg.render(locals(), "my_graph.pdf")
|
|
328
328
|
```
|
|
329
|
-
as a *watch* in a debugger tool such as the integrated debugger in Visual Studio Code. Then open the "my_graph.pdf" output file to continuously see all the local variables while debugging. This avoids having to add any memory_graph `show()
|
|
329
|
+
as a *watch* in a debugger tool such as the integrated debugger in Visual Studio Code. Then open the "my_graph.pdf" output file to continuously see all the local variables while debugging. This avoids having to add any memory_graph `show()` or `render()` calls to your code.
|
|
330
330
|
|
|
331
331
|
### Call Stack in Watch Context ###
|
|
332
332
|
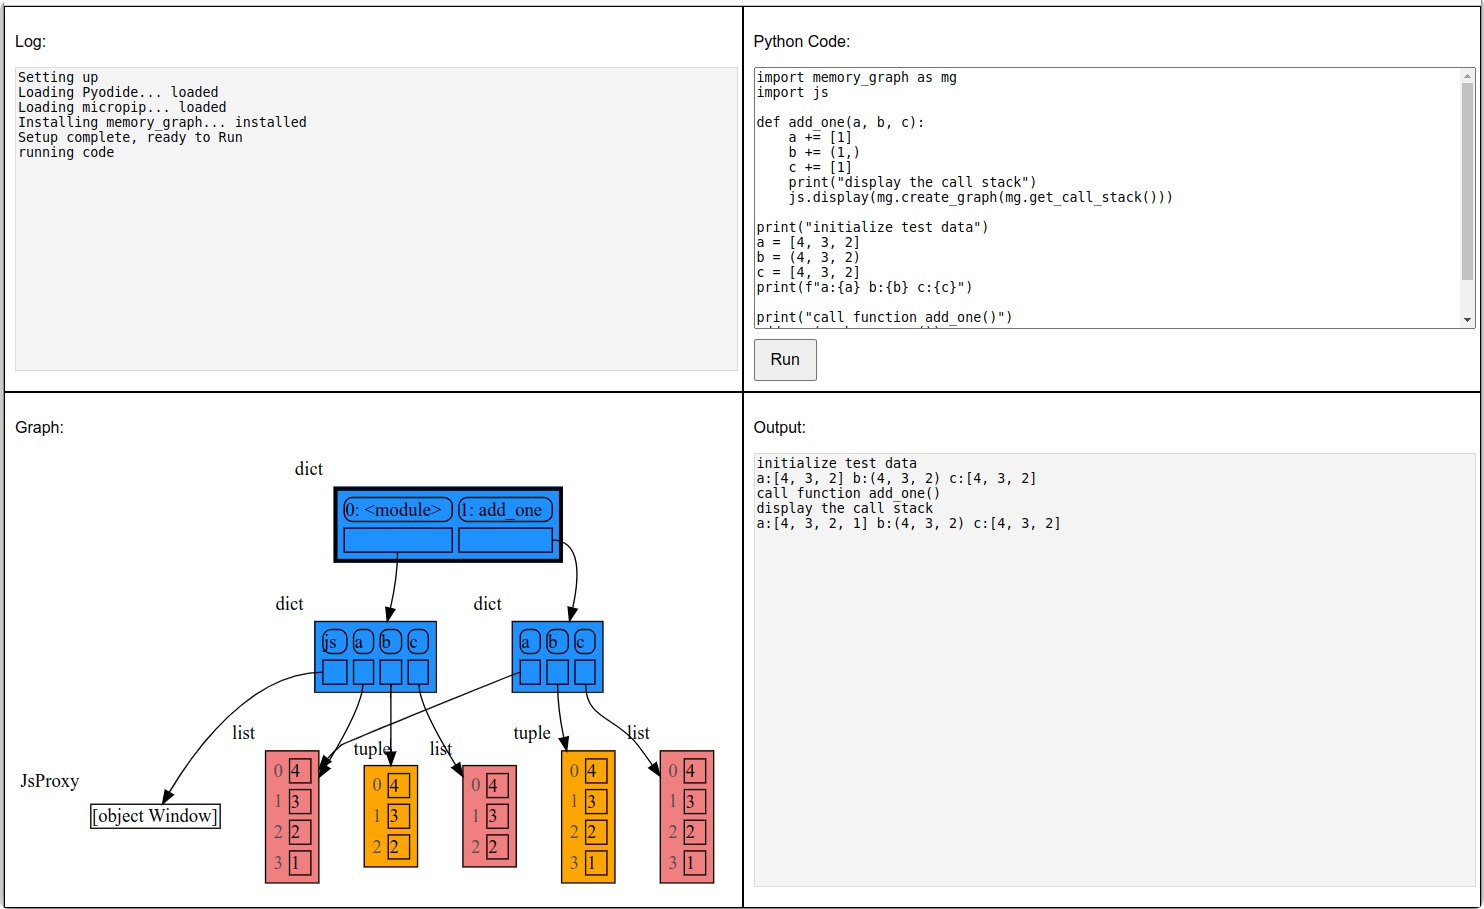
The ```mg.get_call_stack()``` doesn't work well in *watch* context in most debuggers because debuggers introduce additional stack frames that cause problems. Use these alternative functions for various debuggers to filter out these problematic stack frames:
|
|
@@ -511,7 +511,7 @@ for i in range(n):
|
|
|
511
511
|
Different aspects of memory_graph can be configured. The default configuration is reset by importing 'memory_graph.config_default'.
|
|
512
512
|
|
|
513
513
|
- ***mg.config.max_graph_depth*** : int
|
|
514
|
-
- The maxium depth of the graph with default value 12. A `✂` (scissor) symbol indicates where the graph is cut short.
|
|
514
|
+
- The maxium depth of the graph with default value 12. A `✂` (scissor) symbol indicates where the graph is cut short. Dashed references indicate that there are more references to a node than are shown.
|
|
515
515
|
|
|
516
516
|
- ***mg.config.max_string_length*** : int
|
|
517
517
|
- The maximum length of strings shown in the graph. Longer strings will be truncated.
|
|
@@ -534,8 +534,29 @@ Different aspects of memory_graph can be configured. The default configuration i
|
|
|
534
534
|
- ***mg.config.type_to_slicer*** : dict
|
|
535
535
|
- Maps each type to a Slicer. A slicer determines how many elements of a data type are shown in the graph to prevent the graph from getting too big. 'Slicer()' does no slicing, 'Slicer(1,2,3)' shows just 1 element at the beginning, 2 in the middle, and 3 at the end.
|
|
536
536
|
|
|
537
|
+
### Simplified Graph ###
|
|
538
|
+
Memory_graph simplifies the visualization (and the viewer's mental model) by **not** showing separate nodes for immutable types like `bool`, `int`, `float`, `complex`, and `str` by default. This simplification can sometimes be slightly misleading. As in the example below, after a shallow copy, lists `a` and `b` technically share their `int` values, but the graph makes it appear as though `a` and `b` each have their own copies. However, since `int` is immutable, this simplification will never lead to unexpected changes—changing `a` won’t effect `b`.
|
|
539
|
+
|
|
540
|
+
The simplification strikes a balance: it is slightly misleading but keeps the graph clean and easy to understand and focuses on the mutable types where unexpected changes can occur. This is why it is the default behavior. If you do want to show separate nodes for `int` values, such as for educational purposes, you can simply remove `int` from the `mg.config.not_node_types` set:
|
|
541
|
+
```python
|
|
542
|
+
import memory_graph as mg
|
|
543
|
+
|
|
544
|
+
a = [100, 200, 300]
|
|
545
|
+
b = a.copy()
|
|
546
|
+
mg.render(locals(), 'not_node_types1.png')
|
|
547
|
+
|
|
548
|
+
mg.config.not_node_types.remove(int) # now show separate nodes for int values
|
|
549
|
+
|
|
550
|
+
mg.render(locals(), 'not_node_types2.png')
|
|
551
|
+
```
|
|
552
|
+
|  |  |
|
|
553
|
+
|:-----------------------------------------------------------:|:-------------------------------------------------------------:|
|
|
554
|
+
| not_node_types1.png, simplified | not_node_types2.png, technically correct |
|
|
555
|
+
|
|
556
|
+
Additionally, the simplification hides the [reuse of small `int` values](https://docs.python.org/3/c-api/long.html#c.PyLong_FromLong) in the current CPython implementation, an optimization that might otherwise confuse beginner Python programmers. For instance, after executing `a[1]+=1; b[1]+=1`, the `201` value is, maybe surprisingly, still shared between `a` and `b`, whereas executing `a[2]+=1; b[2]+=1` does not result in sharing the `301` value.
|
|
557
|
+
|
|
537
558
|
### Temporary Configuration ###
|
|
538
|
-
In addition to the global configuration, a temporary configuration can be set for a single `show()
|
|
559
|
+
In addition to the global configuration, a temporary configuration can be set for a single `show()` or `render()` call to change the colors, orientation, and slicer. This example highlights a particular list element in red, gives it a horizontal orientation, and overwrites the default slicer for lists:
|
|
539
560
|
|
|
540
561
|
```python
|
|
541
562
|
import memory_graph as mg
|
|
@@ -545,7 +566,7 @@ data = [ list(range(20)) for i in range(1,5)]
|
|
|
545
566
|
highlight = data[2]
|
|
546
567
|
|
|
547
568
|
mg.show( locals(),
|
|
548
|
-
colors = {id(highlight): "red" }, # set color to
|
|
569
|
+
colors = {id(highlight): "red" }, # set color to red
|
|
549
570
|
vertical_orientations = {id(highlight): False }, # set horizontal orientation
|
|
550
571
|
slicers = {id(highlight): Slicer()} # set no slicing
|
|
551
572
|
)
|
|
@@ -736,7 +757,7 @@ display( mg.create_graph(mg.locals_jupyter()) ) # display the local variables in
|
|
|
736
757
|
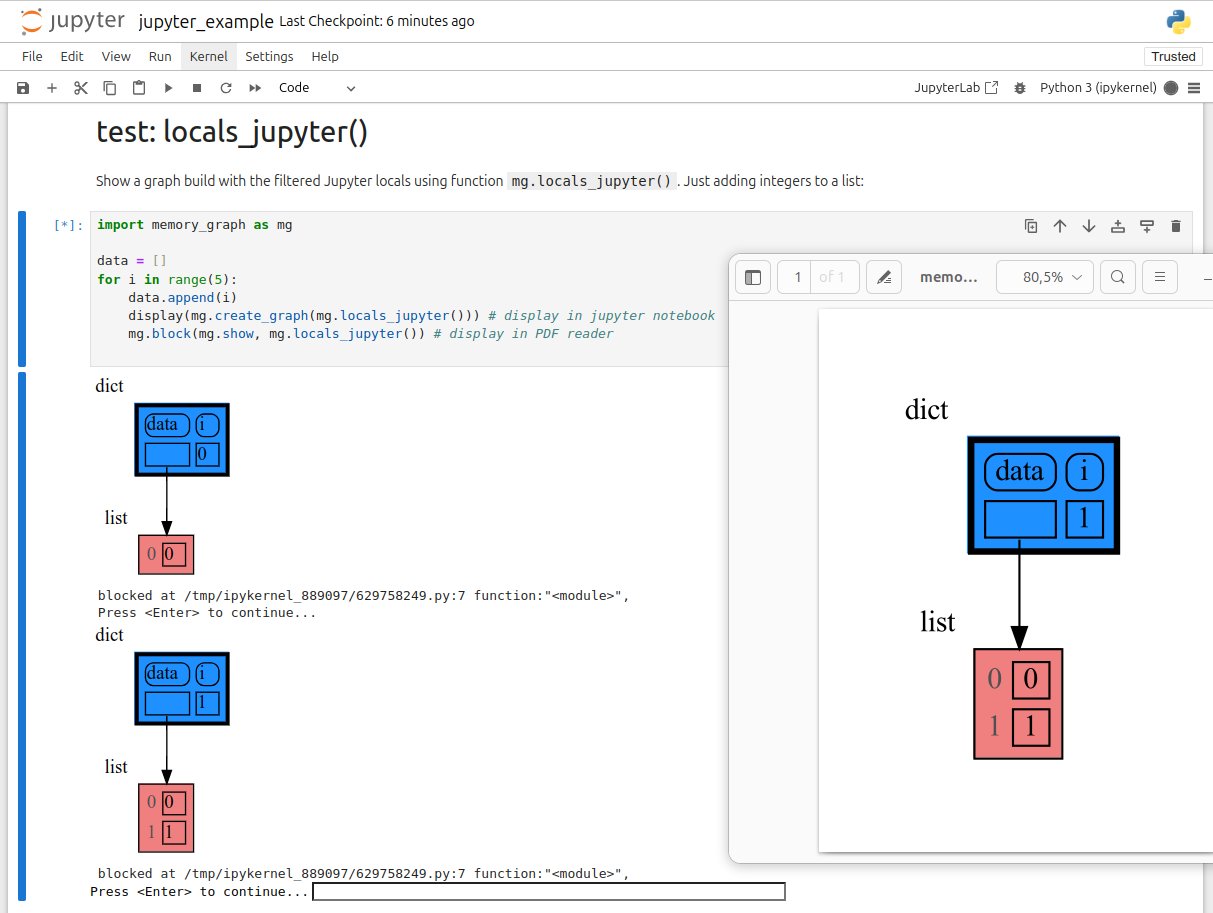
mg.block(display, mg.create_graph(mg.locals_jupyter()) ) # the same but blocked
|
|
737
758
|
```
|
|
738
759
|
|
|
739
|
-
See for example [jupyter_example.ipynb](https://raw.githubusercontent.com/bterwijn/memory_graph/main/
|
|
760
|
+
See for example [jupyter_example.ipynb](https://raw.githubusercontent.com/bterwijn/memory_graph/main/src/jupyter_example.ipynb).
|
|
740
761
|
|
|
741
762
|
|
|
742
763
|
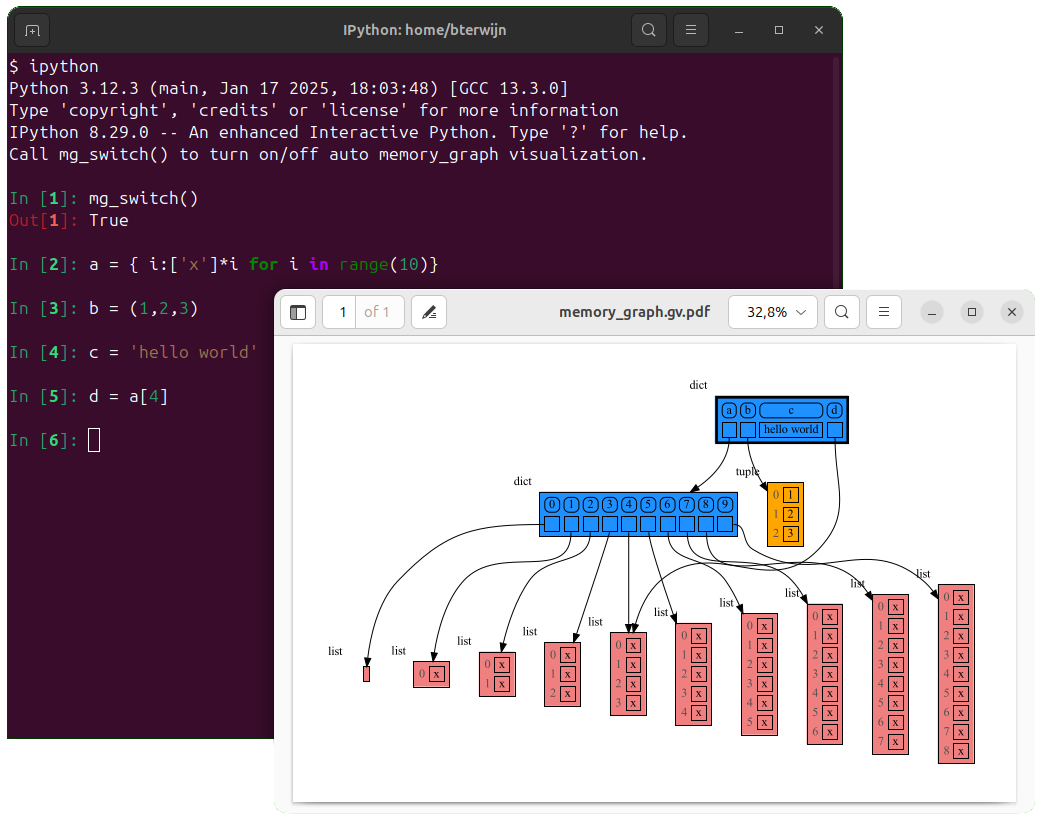
## ipython ##
|
|
@@ -750,7 +771,7 @@ Then after starting 'ipython' call function `mg_switch()` to turn on/off the aut
|
|
|
750
771
|
|
|
751
772
|
|
|
752
773
|
## In the Browser ##
|
|
753
|
-
We can run memory_graph in the browser: <a href="https://bterwijn.github.io/memory_graph/src/pyodide.html" target="_blank">Pyodide Example</a>
|
|
774
|
+
We can also run memory_graph in the browser: <a href="https://bterwijn.github.io/memory_graph/src/pyodide.html" target="_blank">Pyodide Example</a>
|
|
754
775
|
|
|
755
776
|
|
|
756
777
|
## Troubleshooting ##
|
|
@@ -137,7 +137,7 @@ mg.render(locals(), 'immutable2.png')
|
|
|
137
137
|
|
|
138
138
|
|
|
139
139
|
### Mutable Type ###
|
|
140
|
-
With mutable types the result is different. In the code below variable `a` and `b` both reference the same `list` value [4, 3, 2]. A `list` is a mutable type and therefore when we change variable `a` its value **can** be mutated in place and thus `a` and `b` both reference the same new value afterwards. Thus changing `a` also changes `b` and vice versa. Sometimes we want this but other times we don't and then we will have to make a copy so that `a` and `b` are independent.
|
|
140
|
+
With mutable types the result is different. In the code below variable `a` and `b` both reference the same `list` value [4, 3, 2]. A `list` is a mutable type and therefore when we change variable `a` its value **can** be mutated in place and thus `a` and `b` both reference the same new value afterwards. Thus changing `a` also changes `b` and vice versa. Sometimes we want this but other times we don't and then we will have to make a copy ourselfs so that `a` and `b` are independent.
|
|
141
141
|
|
|
142
142
|
```python
|
|
143
143
|
import memory_graph as mg
|
|
@@ -245,7 +245,7 @@ This function:
|
|
|
245
245
|
* then blocks execution until the <Enter> key is pressed
|
|
246
246
|
* finally returns the value of the `fun()` call
|
|
247
247
|
|
|
248
|
-
to change
|
|
248
|
+
to change its behavior:
|
|
249
249
|
* Set `mg.block_prints_location = False` to skip printing the source location.
|
|
250
250
|
* Set `mg.press_enter_message = None` to skip printing "Press <Enter> to continue...".
|
|
251
251
|
|
|
@@ -307,7 +307,7 @@ For the best debugging experience with memory_graph set for example expression:
|
|
|
307
307
|
```
|
|
308
308
|
mg.render(locals(), "my_graph.pdf")
|
|
309
309
|
```
|
|
310
|
-
as a *watch* in a debugger tool such as the integrated debugger in Visual Studio Code. Then open the "my_graph.pdf" output file to continuously see all the local variables while debugging. This avoids having to add any memory_graph `show()
|
|
310
|
+
as a *watch* in a debugger tool such as the integrated debugger in Visual Studio Code. Then open the "my_graph.pdf" output file to continuously see all the local variables while debugging. This avoids having to add any memory_graph `show()` or `render()` calls to your code.
|
|
311
311
|
|
|
312
312
|
### Call Stack in Watch Context ###
|
|
313
313
|
The ```mg.get_call_stack()``` doesn't work well in *watch* context in most debuggers because debuggers introduce additional stack frames that cause problems. Use these alternative functions for various debuggers to filter out these problematic stack frames:
|
|
@@ -492,7 +492,7 @@ for i in range(n):
|
|
|
492
492
|
Different aspects of memory_graph can be configured. The default configuration is reset by importing 'memory_graph.config_default'.
|
|
493
493
|
|
|
494
494
|
- ***mg.config.max_graph_depth*** : int
|
|
495
|
-
- The maxium depth of the graph with default value 12. A `✂` (scissor) symbol indicates where the graph is cut short.
|
|
495
|
+
- The maxium depth of the graph with default value 12. A `✂` (scissor) symbol indicates where the graph is cut short. Dashed references indicate that there are more references to a node than are shown.
|
|
496
496
|
|
|
497
497
|
- ***mg.config.max_string_length*** : int
|
|
498
498
|
- The maximum length of strings shown in the graph. Longer strings will be truncated.
|
|
@@ -515,8 +515,29 @@ Different aspects of memory_graph can be configured. The default configuration i
|
|
|
515
515
|
- ***mg.config.type_to_slicer*** : dict
|
|
516
516
|
- Maps each type to a Slicer. A slicer determines how many elements of a data type are shown in the graph to prevent the graph from getting too big. 'Slicer()' does no slicing, 'Slicer(1,2,3)' shows just 1 element at the beginning, 2 in the middle, and 3 at the end.
|
|
517
517
|
|
|
518
|
+
### Simplified Graph ###
|
|
519
|
+
Memory_graph simplifies the visualization (and the viewer's mental model) by **not** showing separate nodes for immutable types like `bool`, `int`, `float`, `complex`, and `str` by default. This simplification can sometimes be slightly misleading. As in the example below, after a shallow copy, lists `a` and `b` technically share their `int` values, but the graph makes it appear as though `a` and `b` each have their own copies. However, since `int` is immutable, this simplification will never lead to unexpected changes—changing `a` won’t effect `b`.
|
|
520
|
+
|
|
521
|
+
The simplification strikes a balance: it is slightly misleading but keeps the graph clean and easy to understand and focuses on the mutable types where unexpected changes can occur. This is why it is the default behavior. If you do want to show separate nodes for `int` values, such as for educational purposes, you can simply remove `int` from the `mg.config.not_node_types` set:
|
|
522
|
+
```python
|
|
523
|
+
import memory_graph as mg
|
|
524
|
+
|
|
525
|
+
a = [100, 200, 300]
|
|
526
|
+
b = a.copy()
|
|
527
|
+
mg.render(locals(), 'not_node_types1.png')
|
|
528
|
+
|
|
529
|
+
mg.config.not_node_types.remove(int) # now show separate nodes for int values
|
|
530
|
+
|
|
531
|
+
mg.render(locals(), 'not_node_types2.png')
|
|
532
|
+
```
|
|
533
|
+
|  |  |
|
|
534
|
+
|:-----------------------------------------------------------:|:-------------------------------------------------------------:|
|
|
535
|
+
| not_node_types1.png, simplified | not_node_types2.png, technically correct |
|
|
536
|
+
|
|
537
|
+
Additionally, the simplification hides the [reuse of small `int` values](https://docs.python.org/3/c-api/long.html#c.PyLong_FromLong) in the current CPython implementation, an optimization that might otherwise confuse beginner Python programmers. For instance, after executing `a[1]+=1; b[1]+=1`, the `201` value is, maybe surprisingly, still shared between `a` and `b`, whereas executing `a[2]+=1; b[2]+=1` does not result in sharing the `301` value.
|
|
538
|
+
|
|
518
539
|
### Temporary Configuration ###
|
|
519
|
-
In addition to the global configuration, a temporary configuration can be set for a single `show()
|
|
540
|
+
In addition to the global configuration, a temporary configuration can be set for a single `show()` or `render()` call to change the colors, orientation, and slicer. This example highlights a particular list element in red, gives it a horizontal orientation, and overwrites the default slicer for lists:
|
|
520
541
|
|
|
521
542
|
```python
|
|
522
543
|
import memory_graph as mg
|
|
@@ -526,7 +547,7 @@ data = [ list(range(20)) for i in range(1,5)]
|
|
|
526
547
|
highlight = data[2]
|
|
527
548
|
|
|
528
549
|
mg.show( locals(),
|
|
529
|
-
colors = {id(highlight): "red" }, # set color to
|
|
550
|
+
colors = {id(highlight): "red" }, # set color to red
|
|
530
551
|
vertical_orientations = {id(highlight): False }, # set horizontal orientation
|
|
531
552
|
slicers = {id(highlight): Slicer()} # set no slicing
|
|
532
553
|
)
|
|
@@ -717,7 +738,7 @@ display( mg.create_graph(mg.locals_jupyter()) ) # display the local variables in
|
|
|
717
738
|
mg.block(display, mg.create_graph(mg.locals_jupyter()) ) # the same but blocked
|
|
718
739
|
```
|
|
719
740
|
|
|
720
|
-
See for example [jupyter_example.ipynb](https://raw.githubusercontent.com/bterwijn/memory_graph/main/
|
|
741
|
+
See for example [jupyter_example.ipynb](https://raw.githubusercontent.com/bterwijn/memory_graph/main/src/jupyter_example.ipynb).
|
|
721
742
|

|
|
722
743
|
|
|
723
744
|
## ipython ##
|
|
@@ -731,7 +752,7 @@ Then after starting 'ipython' call function `mg_switch()` to turn on/off the aut
|
|
|
731
752
|

|
|
732
753
|
|
|
733
754
|
## In the Browser ##
|
|
734
|
-
We can run memory_graph in the browser: <a href="https://bterwijn.github.io/memory_graph/src/pyodide.html" target="_blank">Pyodide Example</a>
|
|
755
|
+
We can also run memory_graph in the browser: <a href="https://bterwijn.github.io/memory_graph/src/pyodide.html" target="_blank">Pyodide Example</a>
|
|
735
756
|

|
|
736
757
|
|
|
737
758
|
## Troubleshooting ##
|
|
@@ -13,7 +13,7 @@ import sys
|
|
|
13
13
|
|
|
14
14
|
import graphviz
|
|
15
15
|
|
|
16
|
-
__version__ = "0.3.
|
|
16
|
+
__version__ = "0.3.13"
|
|
17
17
|
__author__ = 'Bas Terwijn'
|
|
18
18
|
render_filename = 'memory_graph.pdf'
|
|
19
19
|
block_prints_location = True
|
|
@@ -167,7 +167,9 @@ def stack_frames_to_dict(frames):
|
|
|
167
167
|
""" Returns a dictionary representing the data on the call stack.
|
|
168
168
|
Each key is the stack level and function name, each value is the locals of the frame at that level.
|
|
169
169
|
"""
|
|
170
|
-
|
|
170
|
+
def to_dict(value): # fix by TerenceTux for Python 3.13
|
|
171
|
+
return {k: v for k, v in value.items()}
|
|
172
|
+
return {f"{level}: {frameInfo.function}" : to_dict(frameInfo.frame.f_locals)
|
|
171
173
|
for level, frameInfo in enumerate(frames)}
|
|
172
174
|
|
|
173
175
|
def get_call_stack(up_to_function="<module>",stack_index=0):
|
|
@@ -4,20 +4,13 @@
|
|
|
4
4
|
|
|
5
5
|
from memory_graph.node_base import Node_Base
|
|
6
6
|
import memory_graph.node_base
|
|
7
|
-
|
|
8
7
|
import memory_graph.config as config
|
|
9
|
-
|
|
10
8
|
import html
|
|
11
9
|
|
|
12
|
-
def
|
|
13
|
-
""" Helper function to add the
|
|
14
|
-
return (f'<\n<TABLE BORDER="
|
|
15
|
-
s + '
|
|
16
|
-
|
|
17
|
-
def inner_html_table(s):
|
|
18
|
-
""" Helper function to add the innner HTML table tags to the string s. """
|
|
19
|
-
return (' <TABLE BORDER="0" CELLBORDER="0" CELLSPACING="5" CELLPADDING="0">\n <TR>' +
|
|
20
|
-
s + '</TR>\n </TABLE>')
|
|
10
|
+
def html_table_frame(s, border, color, spacing=5):
|
|
11
|
+
""" Helper function to add the HTML table frame to the string s setting the 'border' and 'color'. """
|
|
12
|
+
return (f'<\n<TABLE BORDER="{border}" CELLBORDER="1" CELLSPACING="{spacing}" CELLPADDING="0" BGCOLOR="{color}" PORT="table">\n <TR>' +
|
|
13
|
+
s + '</TR>\n</TABLE>\n>')
|
|
21
14
|
|
|
22
15
|
def format_string(s):
|
|
23
16
|
""" Helper function to format the string s to be shown in the graph. Setting the max_string_length and escaping html characters. """
|
|
@@ -37,6 +30,7 @@ class HTML_Table:
|
|
|
37
30
|
"""
|
|
38
31
|
self.html = ''
|
|
39
32
|
self.add_new_line_flag = False
|
|
33
|
+
self.is_empty = True
|
|
40
34
|
self.col_count = 0
|
|
41
35
|
self.row_count = 0
|
|
42
36
|
self.ref_count = 0
|
|
@@ -61,18 +55,19 @@ class HTML_Table:
|
|
|
61
55
|
self.html += '</TR>\n <TR>'
|
|
62
56
|
self.add_new_line_flag = False
|
|
63
57
|
|
|
64
|
-
def add_string(self, s):
|
|
65
|
-
""" Add a string s to the
|
|
66
|
-
self.html += format_string(s)
|
|
58
|
+
def add_string(self, s, border=0):
|
|
59
|
+
""" Add a string s to the table. """
|
|
60
|
+
self.html += f'<TD BORDER="{border}">'+format_string(s)+'</TD>'
|
|
61
|
+
self.is_empty = False
|
|
67
62
|
|
|
68
63
|
def add_index(self, s):
|
|
69
|
-
""" Add an index s to the
|
|
64
|
+
""" Add an index s to the table. """
|
|
70
65
|
self.check_add_new_line()
|
|
71
|
-
self.html += f'<TD><font color="#505050">{str(s)}</font></TD>'
|
|
66
|
+
self.html += f'<TD BORDER="0"><font color="#505050">{str(s)}</font></TD>'
|
|
72
67
|
self.col_count += 1
|
|
73
68
|
|
|
74
69
|
def add_entry(self, node, nodes, child, id_to_slices, rounded=False, border=1, dashed=False):
|
|
75
|
-
""" Add child to the
|
|
70
|
+
""" Add child to the table either as reference if it is a Node_Base or as a value otherwise. """
|
|
76
71
|
#print('child:', child)
|
|
77
72
|
child_id = id(child)
|
|
78
73
|
if child_id in nodes:
|
|
@@ -85,14 +80,14 @@ class HTML_Table:
|
|
|
85
80
|
self.add_value(child, rounded, border)
|
|
86
81
|
|
|
87
82
|
def add_value(self, s, rounded=False, border=1):
|
|
88
|
-
""" Helper function to add a value s to the
|
|
83
|
+
""" Helper function to add a value s to the table. """
|
|
89
84
|
self.check_add_new_line()
|
|
90
85
|
r = ' STYLE="ROUNDED"' if rounded else ''
|
|
91
86
|
self.html += f'<TD BORDER="{border}"{r}> {format_string(s)} </TD>'
|
|
92
87
|
self.col_count += 1
|
|
93
88
|
|
|
94
89
|
def add_reference(self, node, child, rounded=False, border=1, dashed=False):
|
|
95
|
-
""" Helper function to add a reference to the
|
|
90
|
+
""" Helper function to add a reference to the table. """
|
|
96
91
|
self.check_add_new_line()
|
|
97
92
|
r = ' STYLE="ROUNDED"' if rounded else ''
|
|
98
93
|
self.html += f'<TD BORDER="{border}" PORT="ref{self.ref_count}"{r}> </TD>'
|
|
@@ -102,7 +97,7 @@ class HTML_Table:
|
|
|
102
97
|
self.col_count += 1
|
|
103
98
|
|
|
104
99
|
def add_dots(self, rounded=False, border=1):
|
|
105
|
-
""" Helper function to add dots to the
|
|
100
|
+
""" Helper function to add dots to the table. """
|
|
106
101
|
self.check_add_new_line()
|
|
107
102
|
r = 'STYLE="ROUNDED"' if rounded else ''
|
|
108
103
|
self.html += f'<TD BORDER="{border}" {r}>...</TD>'
|
|
@@ -110,26 +105,26 @@ class HTML_Table:
|
|
|
110
105
|
|
|
111
106
|
def to_string(self, border=1, color='white'):
|
|
112
107
|
""" Construct the HTML table string with the 'border' and 'color' settings. """
|
|
113
|
-
if self.col_count
|
|
114
|
-
|
|
115
|
-
|
|
116
|
-
self.html
|
|
117
|
-
return
|
|
108
|
+
if self.col_count == 0 and self.row_count == 0:
|
|
109
|
+
if self.is_empty:
|
|
110
|
+
self.add_string(' ')
|
|
111
|
+
return html_table_frame(self.html, border, color, spacing=0)
|
|
112
|
+
return html_table_frame(self.html, border, color)
|
|
118
113
|
|
|
119
114
|
def get_column(self):
|
|
120
|
-
""" Get the number of columns in the
|
|
115
|
+
""" Get the number of columns in the table. """
|
|
121
116
|
return self.col_count
|
|
122
117
|
|
|
123
118
|
def get_max_column(self):
|
|
124
|
-
""" Get the maximum value of the number of columns of rows in the
|
|
119
|
+
""" Get the maximum value of the number of columns of rows in the table. """
|
|
125
120
|
return self.max_col_count
|
|
126
121
|
|
|
127
122
|
def get_row(self):
|
|
128
|
-
""" Get the number of rows in the
|
|
123
|
+
""" Get the number of rows in the table. """
|
|
129
124
|
return self.row_count
|
|
130
125
|
|
|
131
126
|
def get_edges(self):
|
|
132
|
-
""" Get the edges that need to be
|
|
127
|
+
""" Get the edges that need to be added to connect the table to other tables in the graph. """
|
|
133
128
|
return self.edges
|
|
134
129
|
|
|
135
130
|
if __name__ == '__main__':
|
|
@@ -138,6 +133,6 @@ if __name__ == '__main__':
|
|
|
138
133
|
columns = 5
|
|
139
134
|
for r in range(rows):
|
|
140
135
|
for c in range(columns):
|
|
141
|
-
table.
|
|
136
|
+
table.add_value(f'{c},{r}')
|
|
142
137
|
table.add_new_line()
|
|
143
|
-
print(table)
|
|
138
|
+
print(table.to_string())
|
|
@@ -1,6 +1,6 @@
|
|
|
1
1
|
Metadata-Version: 2.1
|
|
2
2
|
Name: memory_graph
|
|
3
|
-
Version: 0.3.
|
|
3
|
+
Version: 0.3.13
|
|
4
4
|
Summary: Draws a graph of your data to analyze its structure.
|
|
5
5
|
Home-page: https://github.com/bterwijn/memory_graph
|
|
6
6
|
Author: Bas Terwijn
|
|
@@ -156,7 +156,7 @@ mg.render(locals(), 'immutable2.png')
|
|
|
156
156
|
|
|
157
157
|
|
|
158
158
|
### Mutable Type ###
|
|
159
|
-
With mutable types the result is different. In the code below variable `a` and `b` both reference the same `list` value [4, 3, 2]. A `list` is a mutable type and therefore when we change variable `a` its value **can** be mutated in place and thus `a` and `b` both reference the same new value afterwards. Thus changing `a` also changes `b` and vice versa. Sometimes we want this but other times we don't and then we will have to make a copy so that `a` and `b` are independent.
|
|
159
|
+
With mutable types the result is different. In the code below variable `a` and `b` both reference the same `list` value [4, 3, 2]. A `list` is a mutable type and therefore when we change variable `a` its value **can** be mutated in place and thus `a` and `b` both reference the same new value afterwards. Thus changing `a` also changes `b` and vice versa. Sometimes we want this but other times we don't and then we will have to make a copy ourselfs so that `a` and `b` are independent.
|
|
160
160
|
|
|
161
161
|
```python
|
|
162
162
|
import memory_graph as mg
|
|
@@ -264,7 +264,7 @@ This function:
|
|
|
264
264
|
* then blocks execution until the <Enter> key is pressed
|
|
265
265
|
* finally returns the value of the `fun()` call
|
|
266
266
|
|
|
267
|
-
to change
|
|
267
|
+
to change its behavior:
|
|
268
268
|
* Set `mg.block_prints_location = False` to skip printing the source location.
|
|
269
269
|
* Set `mg.press_enter_message = None` to skip printing "Press <Enter> to continue...".
|
|
270
270
|
|
|
@@ -326,7 +326,7 @@ For the best debugging experience with memory_graph set for example expression:
|
|
|
326
326
|
```
|
|
327
327
|
mg.render(locals(), "my_graph.pdf")
|
|
328
328
|
```
|
|
329
|
-
as a *watch* in a debugger tool such as the integrated debugger in Visual Studio Code. Then open the "my_graph.pdf" output file to continuously see all the local variables while debugging. This avoids having to add any memory_graph `show()
|
|
329
|
+
as a *watch* in a debugger tool such as the integrated debugger in Visual Studio Code. Then open the "my_graph.pdf" output file to continuously see all the local variables while debugging. This avoids having to add any memory_graph `show()` or `render()` calls to your code.
|
|
330
330
|
|
|
331
331
|
### Call Stack in Watch Context ###
|
|
332
332
|
The ```mg.get_call_stack()``` doesn't work well in *watch* context in most debuggers because debuggers introduce additional stack frames that cause problems. Use these alternative functions for various debuggers to filter out these problematic stack frames:
|
|
@@ -511,7 +511,7 @@ for i in range(n):
|
|
|
511
511
|
Different aspects of memory_graph can be configured. The default configuration is reset by importing 'memory_graph.config_default'.
|
|
512
512
|
|
|
513
513
|
- ***mg.config.max_graph_depth*** : int
|
|
514
|
-
- The maxium depth of the graph with default value 12. A `✂` (scissor) symbol indicates where the graph is cut short.
|
|
514
|
+
- The maxium depth of the graph with default value 12. A `✂` (scissor) symbol indicates where the graph is cut short. Dashed references indicate that there are more references to a node than are shown.
|
|
515
515
|
|
|
516
516
|
- ***mg.config.max_string_length*** : int
|
|
517
517
|
- The maximum length of strings shown in the graph. Longer strings will be truncated.
|
|
@@ -534,8 +534,29 @@ Different aspects of memory_graph can be configured. The default configuration i
|
|
|
534
534
|
- ***mg.config.type_to_slicer*** : dict
|
|
535
535
|
- Maps each type to a Slicer. A slicer determines how many elements of a data type are shown in the graph to prevent the graph from getting too big. 'Slicer()' does no slicing, 'Slicer(1,2,3)' shows just 1 element at the beginning, 2 in the middle, and 3 at the end.
|
|
536
536
|
|
|
537
|
+
### Simplified Graph ###
|
|
538
|
+
Memory_graph simplifies the visualization (and the viewer's mental model) by **not** showing separate nodes for immutable types like `bool`, `int`, `float`, `complex`, and `str` by default. This simplification can sometimes be slightly misleading. As in the example below, after a shallow copy, lists `a` and `b` technically share their `int` values, but the graph makes it appear as though `a` and `b` each have their own copies. However, since `int` is immutable, this simplification will never lead to unexpected changes—changing `a` won’t effect `b`.
|
|
539
|
+
|
|
540
|
+
The simplification strikes a balance: it is slightly misleading but keeps the graph clean and easy to understand and focuses on the mutable types where unexpected changes can occur. This is why it is the default behavior. If you do want to show separate nodes for `int` values, such as for educational purposes, you can simply remove `int` from the `mg.config.not_node_types` set:
|
|
541
|
+
```python
|
|
542
|
+
import memory_graph as mg
|
|
543
|
+
|
|
544
|
+
a = [100, 200, 300]
|
|
545
|
+
b = a.copy()
|
|
546
|
+
mg.render(locals(), 'not_node_types1.png')
|
|
547
|
+
|
|
548
|
+
mg.config.not_node_types.remove(int) # now show separate nodes for int values
|
|
549
|
+
|
|
550
|
+
mg.render(locals(), 'not_node_types2.png')
|
|
551
|
+
```
|
|
552
|
+
|  |  |
|
|
553
|
+
|:-----------------------------------------------------------:|:-------------------------------------------------------------:|
|
|
554
|
+
| not_node_types1.png, simplified | not_node_types2.png, technically correct |
|
|
555
|
+
|
|
556
|
+
Additionally, the simplification hides the [reuse of small `int` values](https://docs.python.org/3/c-api/long.html#c.PyLong_FromLong) in the current CPython implementation, an optimization that might otherwise confuse beginner Python programmers. For instance, after executing `a[1]+=1; b[1]+=1`, the `201` value is, maybe surprisingly, still shared between `a` and `b`, whereas executing `a[2]+=1; b[2]+=1` does not result in sharing the `301` value.
|
|
557
|
+
|
|
537
558
|
### Temporary Configuration ###
|
|
538
|
-
In addition to the global configuration, a temporary configuration can be set for a single `show()
|
|
559
|
+
In addition to the global configuration, a temporary configuration can be set for a single `show()` or `render()` call to change the colors, orientation, and slicer. This example highlights a particular list element in red, gives it a horizontal orientation, and overwrites the default slicer for lists:
|
|
539
560
|
|
|
540
561
|
```python
|
|
541
562
|
import memory_graph as mg
|
|
@@ -545,7 +566,7 @@ data = [ list(range(20)) for i in range(1,5)]
|
|
|
545
566
|
highlight = data[2]
|
|
546
567
|
|
|
547
568
|
mg.show( locals(),
|
|
548
|
-
colors = {id(highlight): "red" }, # set color to
|
|
569
|
+
colors = {id(highlight): "red" }, # set color to red
|
|
549
570
|
vertical_orientations = {id(highlight): False }, # set horizontal orientation
|
|
550
571
|
slicers = {id(highlight): Slicer()} # set no slicing
|
|
551
572
|
)
|
|
@@ -736,7 +757,7 @@ display( mg.create_graph(mg.locals_jupyter()) ) # display the local variables in
|
|
|
736
757
|
mg.block(display, mg.create_graph(mg.locals_jupyter()) ) # the same but blocked
|
|
737
758
|
```
|
|
738
759
|
|
|
739
|
-
See for example [jupyter_example.ipynb](https://raw.githubusercontent.com/bterwijn/memory_graph/main/
|
|
760
|
+
See for example [jupyter_example.ipynb](https://raw.githubusercontent.com/bterwijn/memory_graph/main/src/jupyter_example.ipynb).
|
|
740
761
|

|
|
741
762
|
|
|
742
763
|
## ipython ##
|
|
@@ -750,7 +771,7 @@ Then after starting 'ipython' call function `mg_switch()` to turn on/off the aut
|
|
|
750
771
|

|
|
751
772
|
|
|
752
773
|
## In the Browser ##
|
|
753
|
-
We can run memory_graph in the browser: <a href="https://bterwijn.github.io/memory_graph/src/pyodide.html" target="_blank">Pyodide Example</a>
|
|
774
|
+
We can also run memory_graph in the browser: <a href="https://bterwijn.github.io/memory_graph/src/pyodide.html" target="_blank">Pyodide Example</a>
|
|
754
775
|

|
|
755
776
|
|
|
756
777
|
## Troubleshooting ##
|
|
@@ -11,7 +11,7 @@ long_description_from_readme = (this_directory / "README.md").read_text()
|
|
|
11
11
|
|
|
12
12
|
setup(
|
|
13
13
|
name = 'memory_graph',
|
|
14
|
-
version = '0.3.
|
|
14
|
+
version = '0.3.13',
|
|
15
15
|
description = 'Draws a graph of your data to analyze its structure.',
|
|
16
16
|
long_description = long_description_from_readme,
|
|
17
17
|
long_description_content_type = 'text/markdown',
|
|
File without changes
|
|
File without changes
|
|
File without changes
|
|
File without changes
|
|
File without changes
|
|
File without changes
|
|
File without changes
|
|
File without changes
|
|
File without changes
|
|
File without changes
|
|
File without changes
|
|
File without changes
|
|
File without changes
|
|
File without changes
|
|
File without changes
|
|
File without changes
|
|
File without changes
|
|
File without changes
|
|
File without changes
|
|
File without changes
|
|
File without changes
|
|
File without changes
|
|
File without changes
|
|
File without changes
|
|
File without changes
|
|
File without changes
|
|
File without changes
|
|
File without changes
|
|
File without changes
|
|
File without changes
|
|
File without changes
|