memory-graph 0.2.2__tar.gz → 0.2.4__tar.gz
This diff represents the content of publicly available package versions that have been released to one of the supported registries. The information contained in this diff is provided for informational purposes only and reflects changes between package versions as they appear in their respective public registries.
- {memory_graph-0.2.2 → memory_graph-0.2.4}/PKG-INFO +31 -37
- {memory_graph-0.2.2 → memory_graph-0.2.4}/README.md +30 -36
- {memory_graph-0.2.2 → memory_graph-0.2.4}/memory_graph/Node.py +19 -19
- {memory_graph-0.2.2 → memory_graph-0.2.4}/memory_graph/Node_Key_Value.py +11 -1
- {memory_graph-0.2.2 → memory_graph-0.2.4}/memory_graph/Node_Linear.py +1 -1
- {memory_graph-0.2.2 → memory_graph-0.2.4}/memory_graph/Node_Table.py +7 -1
- {memory_graph-0.2.2 → memory_graph-0.2.4}/memory_graph/Sliced.py +4 -1
- {memory_graph-0.2.2 → memory_graph-0.2.4}/memory_graph/__init__.py +1 -1
- {memory_graph-0.2.2 → memory_graph-0.2.4}/memory_graph.egg-info/PKG-INFO +31 -37
- {memory_graph-0.2.2 → memory_graph-0.2.4}/setup.py +1 -1
- {memory_graph-0.2.2 → memory_graph-0.2.4}/LICENSE.txt +0 -0
- {memory_graph-0.2.2 → memory_graph-0.2.4}/MANIFEST.in +0 -0
- {memory_graph-0.2.2 → memory_graph-0.2.4}/memory_graph/HTML_Table.py +0 -0
- {memory_graph-0.2.2 → memory_graph-0.2.4}/memory_graph/Memory_Graph.py +0 -0
- {memory_graph-0.2.2 → memory_graph-0.2.4}/memory_graph/Memory_Visitor.py +0 -0
- {memory_graph-0.2.2 → memory_graph-0.2.4}/memory_graph/Node_Hidden.py +0 -0
- {memory_graph-0.2.2 → memory_graph-0.2.4}/memory_graph/Slicer.py +0 -0
- {memory_graph-0.2.2 → memory_graph-0.2.4}/memory_graph/config.py +0 -0
- {memory_graph-0.2.2 → memory_graph-0.2.4}/memory_graph/config_default.py +0 -0
- {memory_graph-0.2.2 → memory_graph-0.2.4}/memory_graph/config_helpers.py +0 -0
- {memory_graph-0.2.2 → memory_graph-0.2.4}/memory_graph/extension_numpy.py +0 -0
- {memory_graph-0.2.2 → memory_graph-0.2.4}/memory_graph/extension_pandas.py +0 -0
- {memory_graph-0.2.2 → memory_graph-0.2.4}/memory_graph/special_types.py +0 -0
- {memory_graph-0.2.2 → memory_graph-0.2.4}/memory_graph/test.py +0 -0
- {memory_graph-0.2.2 → memory_graph-0.2.4}/memory_graph/test_memory_graph.py +0 -0
- {memory_graph-0.2.2 → memory_graph-0.2.4}/memory_graph/test_memory_visitor.py +0 -0
- {memory_graph-0.2.2 → memory_graph-0.2.4}/memory_graph/utils.py +0 -0
- {memory_graph-0.2.2 → memory_graph-0.2.4}/memory_graph.egg-info/SOURCES.txt +0 -0
- {memory_graph-0.2.2 → memory_graph-0.2.4}/memory_graph.egg-info/dependency_links.txt +0 -0
- {memory_graph-0.2.2 → memory_graph-0.2.4}/memory_graph.egg-info/requires.txt +0 -0
- {memory_graph-0.2.2 → memory_graph-0.2.4}/memory_graph.egg-info/top_level.txt +0 -0
- {memory_graph-0.2.2 → memory_graph-0.2.4}/setup.cfg +0 -0
|
@@ -1,6 +1,6 @@
|
|
|
1
1
|
Metadata-Version: 2.1
|
|
2
2
|
Name: memory_graph
|
|
3
|
-
Version: 0.2.
|
|
3
|
+
Version: 0.2.4
|
|
4
4
|
Summary: Draws a graph of your data to analyze its structure.
|
|
5
5
|
Home-page: https://github.com/bterwijn/memory_graph
|
|
6
6
|
Author: Bas Terwijn
|
|
@@ -67,7 +67,7 @@ identical?: True
|
|
|
67
67
|
```
|
|
68
68
|
A better way to understand what data is shared is to draw a graph of the data using the [memory_graph](https://pypi.org/project/memory-graph/) package.
|
|
69
69
|
|
|
70
|
-
# Memory Graph
|
|
70
|
+
# Memory Graph #
|
|
71
71
|
The [memory_graph](https://pypi.org/project/memory-graph/) package can graph many different data types.
|
|
72
72
|
|
|
73
73
|
```python
|
|
@@ -222,24 +222,22 @@ memory_graph.show(locals(), block=True)
|
|
|
222
222
|
|
|
223
223
|
So much so that function `d()` is available as alias for this for easier debugging. Additionally it can optionally log the data by printing them. For example:
|
|
224
224
|
```python
|
|
225
|
-
|
|
225
|
+
import memory_graph
|
|
226
226
|
|
|
227
|
-
|
|
228
|
-
|
|
229
|
-
for i in range(
|
|
230
|
-
|
|
231
|
-
|
|
232
|
-
|
|
233
|
-
d(log=True)
|
|
227
|
+
squares = []
|
|
228
|
+
squares_collector = []
|
|
229
|
+
for i in range(1,6):
|
|
230
|
+
squares.append(i**2)
|
|
231
|
+
squares_collector.append(squares.copy())
|
|
232
|
+
memory_graph.d(log=True)
|
|
234
233
|
```
|
|
235
234
|
which after pressing ENTER a number of times results in:
|
|
236
235
|
|
|
237
|
-

|
|
238
237
|
```
|
|
239
|
-
|
|
240
|
-
|
|
241
|
-
i:
|
|
242
|
-
my_squares_copy: [0, 1, 4, 9, 16]
|
|
238
|
+
squares: [1, 4, 9, 16, 25]
|
|
239
|
+
squares_collector: [[1], [1, 4], [1, 4, 9], [1, 4, 9, 16], [1, 4, 9, 16, 25]]
|
|
240
|
+
i: 5
|
|
243
241
|
```
|
|
244
242
|
|
|
245
243
|
Function `d()` has these default arguments:
|
|
@@ -287,7 +285,7 @@ print(f"a:{a} b:{b} c:{c}")
|
|
|
287
285
|
|
|
288
286
|
As `a` is of immutable type 'int' and as we call the function with a copy of `c`, only `b` is shared so only `b` is changed in the calling stack frame as reflected in the printed output:
|
|
289
287
|
```
|
|
290
|
-
a:
|
|
288
|
+
a:10 b:[4, 3, 2, 1] c:[4, 3, 2]
|
|
291
289
|
```
|
|
292
290
|
|
|
293
291
|
### Recursion ###
|
|
@@ -306,12 +304,8 @@ def factorial(n):
|
|
|
306
304
|
|
|
307
305
|
factorial(3)
|
|
308
306
|
```
|
|
309
|
-
|
|
310
|
-
|
|
311
|
-
<div><img src="https://raw.githubusercontent.com/bterwijn/memory_graph/main/images/factorial3.png" /></div>
|
|
312
|
-
<div><img src="https://raw.githubusercontent.com/bterwijn/memory_graph/main/images/factorial4.png" /></div>
|
|
313
|
-
<div><img src="https://raw.githubusercontent.com/bterwijn/memory_graph/main/images/factorial5.png" /></div>
|
|
314
|
-
<div><img src="https://raw.githubusercontent.com/bterwijn/memory_graph/main/images/factorial6.png" /></div>
|
|
307
|
+
|
|
308
|
+
|
|
315
309
|
and the final result is: 1 x 2 x 3 = 6
|
|
316
310
|
|
|
317
311
|
### Call Stack in Watchpoint ###
|
|
@@ -339,7 +333,7 @@ Module memory_graph can be very useful in a course about datastructures, some ex
|
|
|
339
333
|
|
|
340
334
|
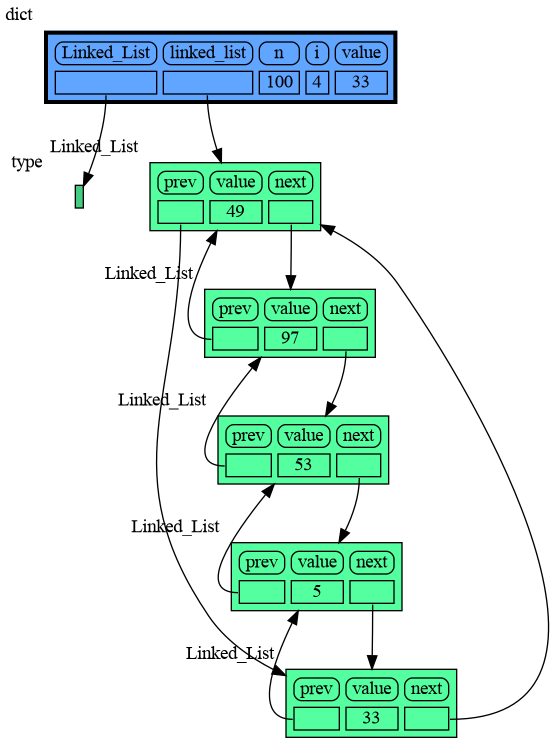
### Doubly Linked List ###
|
|
341
335
|
```python
|
|
342
|
-
|
|
336
|
+
import memory_graph
|
|
343
337
|
import random
|
|
344
338
|
random.seed(0) # use same random numbers each run
|
|
345
339
|
|
|
@@ -365,19 +359,19 @@ class LinkedList:
|
|
|
365
359
|
new_node.next = self.head
|
|
366
360
|
self.head.prev = new_node
|
|
367
361
|
self.head = new_node
|
|
362
|
+
memory_graph.d() # <--- draw graph
|
|
368
363
|
|
|
369
364
|
linked_list = LinkedList()
|
|
370
365
|
n = 100
|
|
371
366
|
for i in range(n):
|
|
372
367
|
new_value = random.randrange(n)
|
|
373
368
|
linked_list.add_front(new_value)
|
|
374
|
-
d() # <--- draw linked list
|
|
375
369
|
```
|
|
376
370
|
|
|
377
371
|
|
|
378
372
|
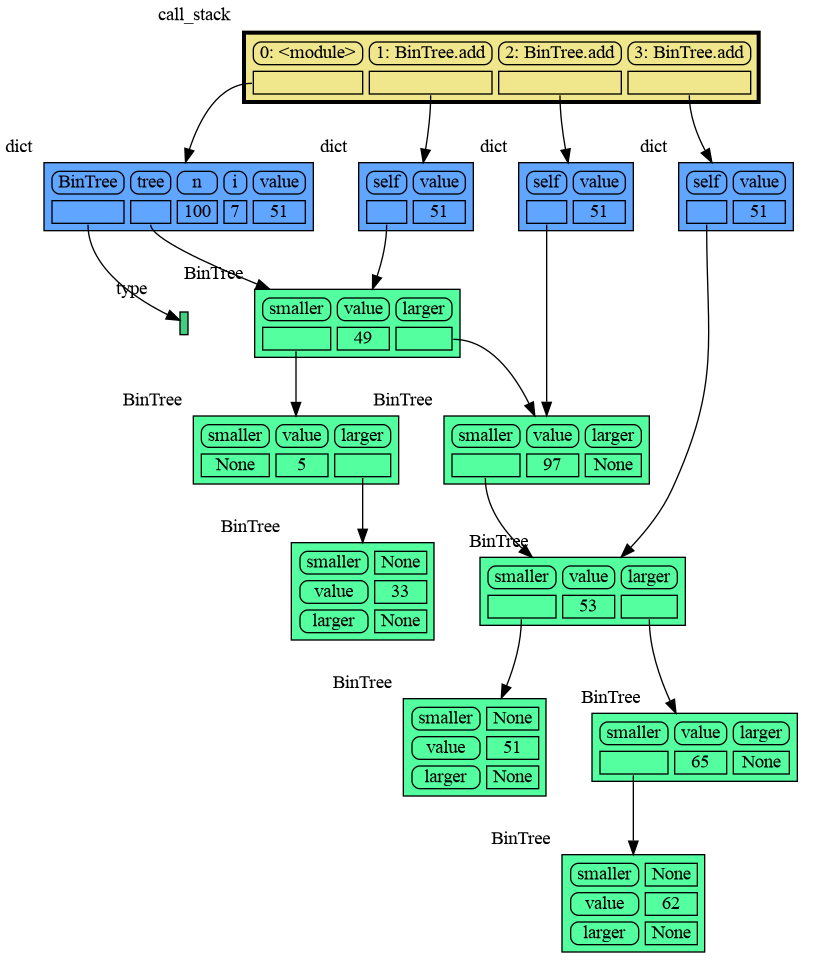
### Binary Tree ###
|
|
379
373
|
```python
|
|
380
|
-
|
|
374
|
+
import memory_graph
|
|
381
375
|
import random
|
|
382
376
|
random.seed(0) # use same random numbers each run
|
|
383
377
|
|
|
@@ -394,7 +388,6 @@ class BinTree:
|
|
|
394
388
|
self.root = None
|
|
395
389
|
|
|
396
390
|
def add_recursive(self, new_value, node):
|
|
397
|
-
d() # <--- draw tree when adding recursively
|
|
398
391
|
if new_value < node.value:
|
|
399
392
|
if node.smaller is None:
|
|
400
393
|
node.smaller = Node(new_value)
|
|
@@ -405,6 +398,7 @@ class BinTree:
|
|
|
405
398
|
node.larger = Node(new_value)
|
|
406
399
|
else:
|
|
407
400
|
self.add_recursive(new_value, node.larger)
|
|
401
|
+
memory_graph.d() # <--- draw graph
|
|
408
402
|
|
|
409
403
|
def add(self, value):
|
|
410
404
|
if self.root is None:
|
|
@@ -417,27 +411,27 @@ n = 100
|
|
|
417
411
|
for i in range(n):
|
|
418
412
|
new_value = random.randrange(100)
|
|
419
413
|
tree.add(new_value)
|
|
420
|
-
d() # <--- draw tree after adding
|
|
421
414
|
```
|
|
422
415
|
|
|
423
416
|
|
|
424
417
|
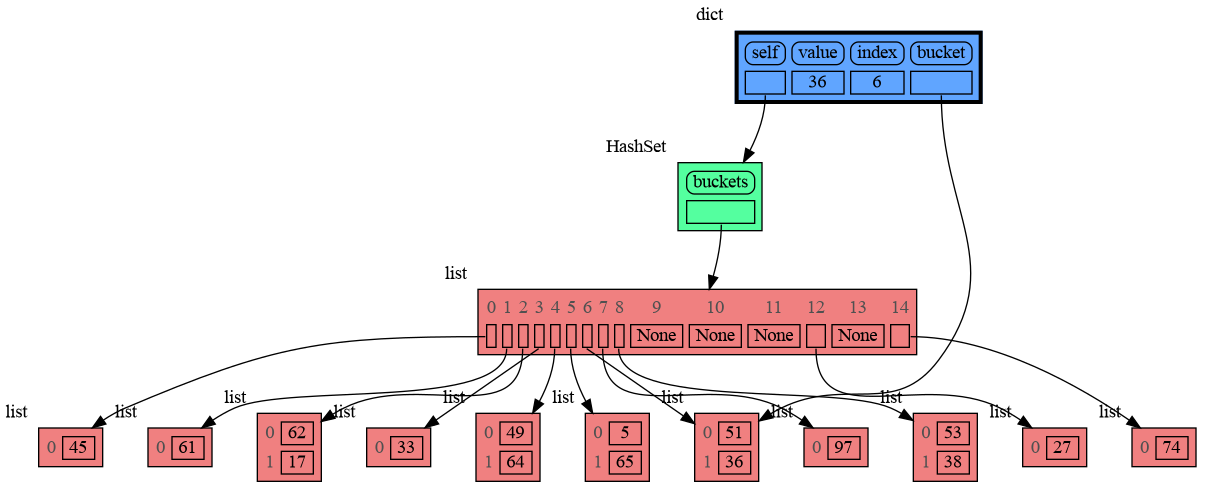
### Hash Set ###
|
|
425
418
|
```python
|
|
426
|
-
|
|
419
|
+
import memory_graph
|
|
427
420
|
import random
|
|
428
421
|
random.seed(0) # use same random numbers each run
|
|
429
422
|
|
|
430
423
|
class HashSet:
|
|
431
424
|
|
|
432
|
-
def __init__(self, capacity=
|
|
425
|
+
def __init__(self, capacity=15):
|
|
433
426
|
self.buckets = [None] * capacity
|
|
434
427
|
|
|
435
428
|
def add(self, value):
|
|
436
429
|
index = hash(value) % len(self.buckets)
|
|
437
430
|
if self.buckets[index] is None:
|
|
438
|
-
self.buckets[index] = [
|
|
439
|
-
|
|
440
|
-
|
|
431
|
+
self.buckets[index] = []
|
|
432
|
+
bucket = self.buckets[index]
|
|
433
|
+
bucket.append(value)
|
|
434
|
+
memory_graph.d() # <--- draw graph
|
|
441
435
|
|
|
442
436
|
def contains(self, value):
|
|
443
437
|
index = hash(value) % len(self.buckets)
|
|
@@ -455,7 +449,6 @@ n = 100
|
|
|
455
449
|
for i in range(n):
|
|
456
450
|
new_value = random.randrange(n)
|
|
457
451
|
hash_set.add(new_value)
|
|
458
|
-
d() # <--- draw hash set
|
|
459
452
|
```
|
|
460
453
|
|
|
461
454
|
|
|
@@ -512,14 +505,15 @@ Different extensions are available for types from other Python packages.
|
|
|
512
505
|
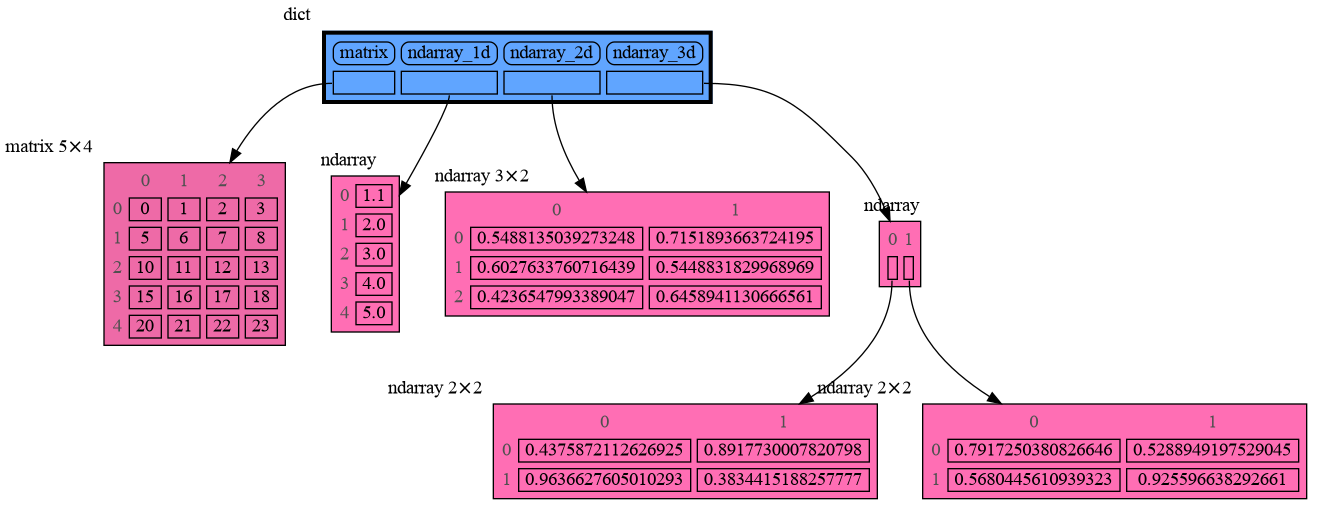
Numpy types `arrray` and `matrix` and `ndarray` can be graphed with the "memory_graph.extension_numpy" extension:
|
|
513
506
|
|
|
514
507
|
```python
|
|
515
|
-
|
|
508
|
+
import memory_graph
|
|
516
509
|
import numpy as np
|
|
517
510
|
import memory_graph.extension_numpy
|
|
511
|
+
np.random.seed(0) # use same random numbers each run
|
|
518
512
|
|
|
519
513
|
array = np.array([1.1, 2, 3, 4, 5])
|
|
520
514
|
matrix = np.matrix([[i*20+j for j in range(20)] for i in range(20)])
|
|
521
515
|
ndarray = np.random.rand(20,20)
|
|
522
|
-
d()
|
|
516
|
+
memory_graph.d()
|
|
523
517
|
```
|
|
524
518
|
|
|
525
519
|
|
|
@@ -527,7 +521,7 @@ d()
|
|
|
527
521
|
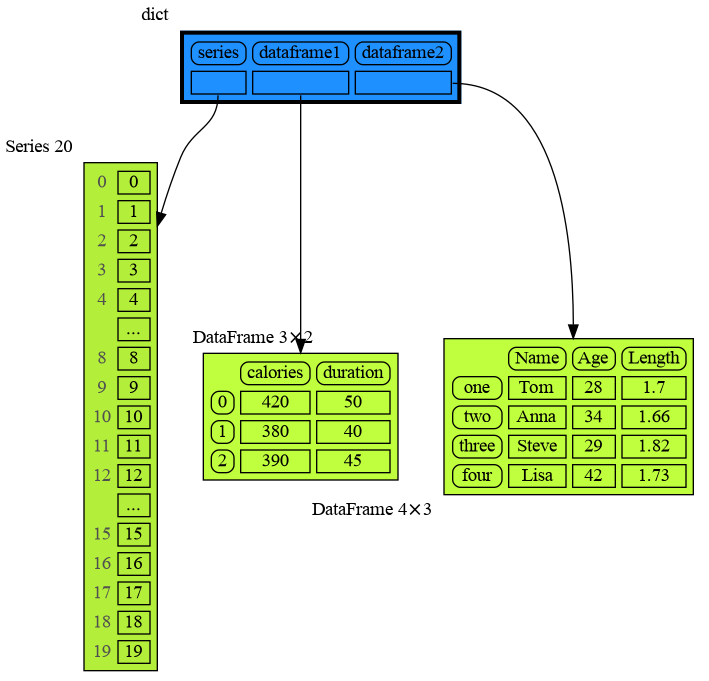
Pandas types `Series` and `DataFrame` can be graphed with the "memory_graph.extension_pandas" extension:
|
|
528
522
|
|
|
529
523
|
```python
|
|
530
|
-
|
|
524
|
+
import memory_graph
|
|
531
525
|
import pandas as pd
|
|
532
526
|
import memory_graph.extension_pandas
|
|
533
527
|
|
|
@@ -538,7 +532,7 @@ dataframe2 = pd.DataFrame({ 'Name' : [ 'Tom', 'Anna', 'Steve', 'Lisa'],
|
|
|
538
532
|
'Age' : [ 28, 34, 29, 42],
|
|
539
533
|
'Length' : [ 1.70, 1.66, 1.82, 1.73] },
|
|
540
534
|
index=['one', 'two', 'three', 'four']) # with row names
|
|
541
|
-
d()
|
|
535
|
+
memory_graph.d()
|
|
542
536
|
```
|
|
543
537
|
|
|
544
538
|
|
|
@@ -48,7 +48,7 @@ identical?: True
|
|
|
48
48
|
```
|
|
49
49
|
A better way to understand what data is shared is to draw a graph of the data using the [memory_graph](https://pypi.org/project/memory-graph/) package.
|
|
50
50
|
|
|
51
|
-
# Memory Graph
|
|
51
|
+
# Memory Graph #
|
|
52
52
|
The [memory_graph](https://pypi.org/project/memory-graph/) package can graph many different data types.
|
|
53
53
|
|
|
54
54
|
```python
|
|
@@ -203,24 +203,22 @@ memory_graph.show(locals(), block=True)
|
|
|
203
203
|
|
|
204
204
|
So much so that function `d()` is available as alias for this for easier debugging. Additionally it can optionally log the data by printing them. For example:
|
|
205
205
|
```python
|
|
206
|
-
|
|
206
|
+
import memory_graph
|
|
207
207
|
|
|
208
|
-
|
|
209
|
-
|
|
210
|
-
for i in range(
|
|
211
|
-
|
|
212
|
-
|
|
213
|
-
|
|
214
|
-
d(log=True)
|
|
208
|
+
squares = []
|
|
209
|
+
squares_collector = []
|
|
210
|
+
for i in range(1,6):
|
|
211
|
+
squares.append(i**2)
|
|
212
|
+
squares_collector.append(squares.copy())
|
|
213
|
+
memory_graph.d(log=True)
|
|
215
214
|
```
|
|
216
215
|
which after pressing ENTER a number of times results in:
|
|
217
216
|
|
|
218
|
-

|
|
219
218
|
```
|
|
220
|
-
|
|
221
|
-
|
|
222
|
-
i:
|
|
223
|
-
my_squares_copy: [0, 1, 4, 9, 16]
|
|
219
|
+
squares: [1, 4, 9, 16, 25]
|
|
220
|
+
squares_collector: [[1], [1, 4], [1, 4, 9], [1, 4, 9, 16], [1, 4, 9, 16, 25]]
|
|
221
|
+
i: 5
|
|
224
222
|
```
|
|
225
223
|
|
|
226
224
|
Function `d()` has these default arguments:
|
|
@@ -268,7 +266,7 @@ print(f"a:{a} b:{b} c:{c}")
|
|
|
268
266
|
|
|
269
267
|
As `a` is of immutable type 'int' and as we call the function with a copy of `c`, only `b` is shared so only `b` is changed in the calling stack frame as reflected in the printed output:
|
|
270
268
|
```
|
|
271
|
-
a:
|
|
269
|
+
a:10 b:[4, 3, 2, 1] c:[4, 3, 2]
|
|
272
270
|
```
|
|
273
271
|
|
|
274
272
|
### Recursion ###
|
|
@@ -287,12 +285,8 @@ def factorial(n):
|
|
|
287
285
|
|
|
288
286
|
factorial(3)
|
|
289
287
|
```
|
|
290
|
-
|
|
291
|
-
|
|
292
|
-
<div><img src="https://raw.githubusercontent.com/bterwijn/memory_graph/main/images/factorial3.png" /></div>
|
|
293
|
-
<div><img src="https://raw.githubusercontent.com/bterwijn/memory_graph/main/images/factorial4.png" /></div>
|
|
294
|
-
<div><img src="https://raw.githubusercontent.com/bterwijn/memory_graph/main/images/factorial5.png" /></div>
|
|
295
|
-
<div><img src="https://raw.githubusercontent.com/bterwijn/memory_graph/main/images/factorial6.png" /></div>
|
|
288
|
+

|
|
289
|
+
|
|
296
290
|
and the final result is: 1 x 2 x 3 = 6
|
|
297
291
|
|
|
298
292
|
### Call Stack in Watchpoint ###
|
|
@@ -320,7 +314,7 @@ Module memory_graph can be very useful in a course about datastructures, some ex
|
|
|
320
314
|
|
|
321
315
|
### Doubly Linked List ###
|
|
322
316
|
```python
|
|
323
|
-
|
|
317
|
+
import memory_graph
|
|
324
318
|
import random
|
|
325
319
|
random.seed(0) # use same random numbers each run
|
|
326
320
|
|
|
@@ -346,19 +340,19 @@ class LinkedList:
|
|
|
346
340
|
new_node.next = self.head
|
|
347
341
|
self.head.prev = new_node
|
|
348
342
|
self.head = new_node
|
|
343
|
+
memory_graph.d() # <--- draw graph
|
|
349
344
|
|
|
350
345
|
linked_list = LinkedList()
|
|
351
346
|
n = 100
|
|
352
347
|
for i in range(n):
|
|
353
348
|
new_value = random.randrange(n)
|
|
354
349
|
linked_list.add_front(new_value)
|
|
355
|
-
d() # <--- draw linked list
|
|
356
350
|
```
|
|
357
351
|

|
|
358
352
|
|
|
359
353
|
### Binary Tree ###
|
|
360
354
|
```python
|
|
361
|
-
|
|
355
|
+
import memory_graph
|
|
362
356
|
import random
|
|
363
357
|
random.seed(0) # use same random numbers each run
|
|
364
358
|
|
|
@@ -375,7 +369,6 @@ class BinTree:
|
|
|
375
369
|
self.root = None
|
|
376
370
|
|
|
377
371
|
def add_recursive(self, new_value, node):
|
|
378
|
-
d() # <--- draw tree when adding recursively
|
|
379
372
|
if new_value < node.value:
|
|
380
373
|
if node.smaller is None:
|
|
381
374
|
node.smaller = Node(new_value)
|
|
@@ -386,6 +379,7 @@ class BinTree:
|
|
|
386
379
|
node.larger = Node(new_value)
|
|
387
380
|
else:
|
|
388
381
|
self.add_recursive(new_value, node.larger)
|
|
382
|
+
memory_graph.d() # <--- draw graph
|
|
389
383
|
|
|
390
384
|
def add(self, value):
|
|
391
385
|
if self.root is None:
|
|
@@ -398,27 +392,27 @@ n = 100
|
|
|
398
392
|
for i in range(n):
|
|
399
393
|
new_value = random.randrange(100)
|
|
400
394
|
tree.add(new_value)
|
|
401
|
-
d() # <--- draw tree after adding
|
|
402
395
|
```
|
|
403
396
|

|
|
404
397
|
|
|
405
398
|
### Hash Set ###
|
|
406
399
|
```python
|
|
407
|
-
|
|
400
|
+
import memory_graph
|
|
408
401
|
import random
|
|
409
402
|
random.seed(0) # use same random numbers each run
|
|
410
403
|
|
|
411
404
|
class HashSet:
|
|
412
405
|
|
|
413
|
-
def __init__(self, capacity=
|
|
406
|
+
def __init__(self, capacity=15):
|
|
414
407
|
self.buckets = [None] * capacity
|
|
415
408
|
|
|
416
409
|
def add(self, value):
|
|
417
410
|
index = hash(value) % len(self.buckets)
|
|
418
411
|
if self.buckets[index] is None:
|
|
419
|
-
self.buckets[index] = [
|
|
420
|
-
|
|
421
|
-
|
|
412
|
+
self.buckets[index] = []
|
|
413
|
+
bucket = self.buckets[index]
|
|
414
|
+
bucket.append(value)
|
|
415
|
+
memory_graph.d() # <--- draw graph
|
|
422
416
|
|
|
423
417
|
def contains(self, value):
|
|
424
418
|
index = hash(value) % len(self.buckets)
|
|
@@ -436,7 +430,6 @@ n = 100
|
|
|
436
430
|
for i in range(n):
|
|
437
431
|
new_value = random.randrange(n)
|
|
438
432
|
hash_set.add(new_value)
|
|
439
|
-
d() # <--- draw hash set
|
|
440
433
|
```
|
|
441
434
|

|
|
442
435
|
|
|
@@ -493,14 +486,15 @@ Different extensions are available for types from other Python packages.
|
|
|
493
486
|
Numpy types `arrray` and `matrix` and `ndarray` can be graphed with the "memory_graph.extension_numpy" extension:
|
|
494
487
|
|
|
495
488
|
```python
|
|
496
|
-
|
|
489
|
+
import memory_graph
|
|
497
490
|
import numpy as np
|
|
498
491
|
import memory_graph.extension_numpy
|
|
492
|
+
np.random.seed(0) # use same random numbers each run
|
|
499
493
|
|
|
500
494
|
array = np.array([1.1, 2, 3, 4, 5])
|
|
501
495
|
matrix = np.matrix([[i*20+j for j in range(20)] for i in range(20)])
|
|
502
496
|
ndarray = np.random.rand(20,20)
|
|
503
|
-
d()
|
|
497
|
+
memory_graph.d()
|
|
504
498
|
```
|
|
505
499
|

|
|
506
500
|
|
|
@@ -508,7 +502,7 @@ d()
|
|
|
508
502
|
Pandas types `Series` and `DataFrame` can be graphed with the "memory_graph.extension_pandas" extension:
|
|
509
503
|
|
|
510
504
|
```python
|
|
511
|
-
|
|
505
|
+
import memory_graph
|
|
512
506
|
import pandas as pd
|
|
513
507
|
import memory_graph.extension_pandas
|
|
514
508
|
|
|
@@ -519,7 +513,7 @@ dataframe2 = pd.DataFrame({ 'Name' : [ 'Tom', 'Anna', 'Steve', 'Lisa'],
|
|
|
519
513
|
'Age' : [ 28, 34, 29, 42],
|
|
520
514
|
'Length' : [ 1.70, 1.66, 1.82, 1.73] },
|
|
521
515
|
index=['one', 'two', 'three', 'four']) # with row names
|
|
522
|
-
d()
|
|
516
|
+
memory_graph.d()
|
|
523
517
|
```
|
|
524
518
|

|
|
525
519
|
|
|
@@ -15,11 +15,10 @@ class Node:
|
|
|
15
15
|
children (list): The children of the node.
|
|
16
16
|
size (string): The size of the node to be shown in the graph.
|
|
17
17
|
"""
|
|
18
|
-
def __init__(self, data, children=None
|
|
18
|
+
def __init__(self, data, children=None):
|
|
19
19
|
self.node_id = Node.node_id
|
|
20
20
|
Node.node_id += 1
|
|
21
21
|
self.data = data
|
|
22
|
-
self.size = size
|
|
23
22
|
self.parent = None
|
|
24
23
|
self.children = children
|
|
25
24
|
|
|
@@ -34,6 +33,18 @@ class Node:
|
|
|
34
33
|
Return the original data represented by the node.
|
|
35
34
|
"""
|
|
36
35
|
return self.data
|
|
36
|
+
|
|
37
|
+
def get_type(self):
|
|
38
|
+
"""
|
|
39
|
+
Return the type of the data represented by the node.
|
|
40
|
+
"""
|
|
41
|
+
return type(self.data)
|
|
42
|
+
|
|
43
|
+
def get_type_name(self):
|
|
44
|
+
"""
|
|
45
|
+
Return the name of the type of the data represented by the node.
|
|
46
|
+
"""
|
|
47
|
+
return utils.get_type_name(self.data)
|
|
37
48
|
|
|
38
49
|
def set_parent(self, parent):
|
|
39
50
|
"""
|
|
@@ -47,12 +58,6 @@ class Node:
|
|
|
47
58
|
"""
|
|
48
59
|
return self.parent
|
|
49
60
|
|
|
50
|
-
def get_size(self):
|
|
51
|
-
"""
|
|
52
|
-
Return the size of the node to be shown in the graph.
|
|
53
|
-
"""
|
|
54
|
-
return self.size
|
|
55
|
-
|
|
56
61
|
def get_children(self):
|
|
57
62
|
"""
|
|
58
63
|
Return the children of the node. Initially the children are raw data, but
|
|
@@ -78,17 +83,6 @@ class Node:
|
|
|
78
83
|
self.fill_html_table(html_table)
|
|
79
84
|
return html_table
|
|
80
85
|
|
|
81
|
-
def get_label(self):
|
|
82
|
-
"""
|
|
83
|
-
Return a label for the node to be shown in the graph next to the HTML table, the size
|
|
84
|
-
is included in the label if available.
|
|
85
|
-
"""
|
|
86
|
-
label = utils.get_type_name(self.data)
|
|
87
|
-
size = self.get_size()
|
|
88
|
-
if not size is None:
|
|
89
|
-
label +=f' ({size})'
|
|
90
|
-
return label
|
|
91
|
-
|
|
92
86
|
# -------------------- Node interface, overriden by subclasses --------------------
|
|
93
87
|
|
|
94
88
|
def do_backtrack_callback(self):
|
|
@@ -109,3 +103,9 @@ class Node:
|
|
|
109
103
|
Fill the HTML_Table object with each child of the node.
|
|
110
104
|
"""
|
|
111
105
|
pass
|
|
106
|
+
|
|
107
|
+
def get_label(self):
|
|
108
|
+
"""
|
|
109
|
+
Return a label for the node to be shown in the graph next to the HTML table.
|
|
110
|
+
"""
|
|
111
|
+
return self.get_type_name()
|
|
@@ -37,9 +37,10 @@ class Node_Key_Value(Node):
|
|
|
37
37
|
"""
|
|
38
38
|
#print('Node_Key_Value children:', children)
|
|
39
39
|
hidden_children = [ Node_Hidden(i,list(i)) for i in children ]
|
|
40
|
+
self.size = len(hidden_children)
|
|
40
41
|
slicer = config_helpers.get_slicer_1d(self, data)
|
|
41
42
|
sliced_children = slicer.slice(hidden_children)
|
|
42
|
-
super().__init__(data, sliced_children
|
|
43
|
+
super().__init__(data, sliced_children)
|
|
43
44
|
|
|
44
45
|
def transform(self, fun):
|
|
45
46
|
"""
|
|
@@ -91,3 +92,12 @@ class Node_Key_Value(Node):
|
|
|
91
92
|
if value is not None:
|
|
92
93
|
key_value = value.get_children() # add the key-value pair of Hidden_Node, not the tuple
|
|
93
94
|
html_table.add_entry(self, key_value[1])
|
|
95
|
+
|
|
96
|
+
def get_label(self):
|
|
97
|
+
"""
|
|
98
|
+
Return a label for the node to be shown in the graph next to the HTML table.
|
|
99
|
+
"""
|
|
100
|
+
if self.get_children().has_all_data():
|
|
101
|
+
return f'{self.get_type_name()}'
|
|
102
|
+
return f'{self.get_type_name()} {self.size}'
|
|
103
|
+
|
|
@@ -16,7 +16,7 @@ class Node_Linear(Node):
|
|
|
16
16
|
"""
|
|
17
17
|
slicer = config_helpers.get_slicer_1d(self, data)
|
|
18
18
|
sliced_children = slicer.slice(children)
|
|
19
|
-
super().__init__(data, sliced_children
|
|
19
|
+
super().__init__(data, sliced_children)
|
|
20
20
|
|
|
21
21
|
def transform(self, fun):
|
|
22
22
|
"""
|
|
@@ -38,7 +38,7 @@ class Node_Table(Node):
|
|
|
38
38
|
|
|
39
39
|
self.row_names = row_names
|
|
40
40
|
self.column_names = column_names
|
|
41
|
-
super().__init__(data, sliced_children
|
|
41
|
+
super().__init__(data, sliced_children)
|
|
42
42
|
|
|
43
43
|
def transform(self, fun):
|
|
44
44
|
"""
|
|
@@ -82,3 +82,9 @@ class Node_Table(Node):
|
|
|
82
82
|
html_table.add_entry(self, value)
|
|
83
83
|
html_table.add_new_line()
|
|
84
84
|
|
|
85
|
+
def get_label(self):
|
|
86
|
+
"""
|
|
87
|
+
Return a label for the node to be shown in the graph next to the HTML table.
|
|
88
|
+
"""
|
|
89
|
+
return f'{self.get_type_name()} {self.data_height}⨯{self.data_width}'
|
|
90
|
+
|
|
@@ -108,4 +108,7 @@ class Sliced:
|
|
|
108
108
|
def last_slice_empty(self):
|
|
109
109
|
""" Return True if the last slice of the Sliced object is empty. """
|
|
110
110
|
return len(self.slices) > 0 and len(self.slices[-1].data) == 0
|
|
111
|
-
|
|
111
|
+
|
|
112
|
+
def has_all_data(self):
|
|
113
|
+
""" Return True if the Sliced object has all the data. """
|
|
114
|
+
return len(self.slices) == 1 and len(self.slices[0].data) == self.original_length
|
|
@@ -1,6 +1,6 @@
|
|
|
1
1
|
Metadata-Version: 2.1
|
|
2
2
|
Name: memory-graph
|
|
3
|
-
Version: 0.2.
|
|
3
|
+
Version: 0.2.4
|
|
4
4
|
Summary: Draws a graph of your data to analyze its structure.
|
|
5
5
|
Home-page: https://github.com/bterwijn/memory_graph
|
|
6
6
|
Author: Bas Terwijn
|
|
@@ -67,7 +67,7 @@ identical?: True
|
|
|
67
67
|
```
|
|
68
68
|
A better way to understand what data is shared is to draw a graph of the data using the [memory_graph](https://pypi.org/project/memory-graph/) package.
|
|
69
69
|
|
|
70
|
-
# Memory Graph
|
|
70
|
+
# Memory Graph #
|
|
71
71
|
The [memory_graph](https://pypi.org/project/memory-graph/) package can graph many different data types.
|
|
72
72
|
|
|
73
73
|
```python
|
|
@@ -222,24 +222,22 @@ memory_graph.show(locals(), block=True)
|
|
|
222
222
|
|
|
223
223
|
So much so that function `d()` is available as alias for this for easier debugging. Additionally it can optionally log the data by printing them. For example:
|
|
224
224
|
```python
|
|
225
|
-
|
|
225
|
+
import memory_graph
|
|
226
226
|
|
|
227
|
-
|
|
228
|
-
|
|
229
|
-
for i in range(
|
|
230
|
-
|
|
231
|
-
|
|
232
|
-
|
|
233
|
-
d(log=True)
|
|
227
|
+
squares = []
|
|
228
|
+
squares_collector = []
|
|
229
|
+
for i in range(1,6):
|
|
230
|
+
squares.append(i**2)
|
|
231
|
+
squares_collector.append(squares.copy())
|
|
232
|
+
memory_graph.d(log=True)
|
|
234
233
|
```
|
|
235
234
|
which after pressing ENTER a number of times results in:
|
|
236
235
|
|
|
237
|
-

|
|
238
237
|
```
|
|
239
|
-
|
|
240
|
-
|
|
241
|
-
i:
|
|
242
|
-
my_squares_copy: [0, 1, 4, 9, 16]
|
|
238
|
+
squares: [1, 4, 9, 16, 25]
|
|
239
|
+
squares_collector: [[1], [1, 4], [1, 4, 9], [1, 4, 9, 16], [1, 4, 9, 16, 25]]
|
|
240
|
+
i: 5
|
|
243
241
|
```
|
|
244
242
|
|
|
245
243
|
Function `d()` has these default arguments:
|
|
@@ -287,7 +285,7 @@ print(f"a:{a} b:{b} c:{c}")
|
|
|
287
285
|
|
|
288
286
|
As `a` is of immutable type 'int' and as we call the function with a copy of `c`, only `b` is shared so only `b` is changed in the calling stack frame as reflected in the printed output:
|
|
289
287
|
```
|
|
290
|
-
a:
|
|
288
|
+
a:10 b:[4, 3, 2, 1] c:[4, 3, 2]
|
|
291
289
|
```
|
|
292
290
|
|
|
293
291
|
### Recursion ###
|
|
@@ -306,12 +304,8 @@ def factorial(n):
|
|
|
306
304
|
|
|
307
305
|
factorial(3)
|
|
308
306
|
```
|
|
309
|
-
|
|
310
|
-
|
|
311
|
-
<div><img src="https://raw.githubusercontent.com/bterwijn/memory_graph/main/images/factorial3.png" /></div>
|
|
312
|
-
<div><img src="https://raw.githubusercontent.com/bterwijn/memory_graph/main/images/factorial4.png" /></div>
|
|
313
|
-
<div><img src="https://raw.githubusercontent.com/bterwijn/memory_graph/main/images/factorial5.png" /></div>
|
|
314
|
-
<div><img src="https://raw.githubusercontent.com/bterwijn/memory_graph/main/images/factorial6.png" /></div>
|
|
307
|
+

|
|
308
|
+
|
|
315
309
|
and the final result is: 1 x 2 x 3 = 6
|
|
316
310
|
|
|
317
311
|
### Call Stack in Watchpoint ###
|
|
@@ -339,7 +333,7 @@ Module memory_graph can be very useful in a course about datastructures, some ex
|
|
|
339
333
|
|
|
340
334
|
### Doubly Linked List ###
|
|
341
335
|
```python
|
|
342
|
-
|
|
336
|
+
import memory_graph
|
|
343
337
|
import random
|
|
344
338
|
random.seed(0) # use same random numbers each run
|
|
345
339
|
|
|
@@ -365,19 +359,19 @@ class LinkedList:
|
|
|
365
359
|
new_node.next = self.head
|
|
366
360
|
self.head.prev = new_node
|
|
367
361
|
self.head = new_node
|
|
362
|
+
memory_graph.d() # <--- draw graph
|
|
368
363
|
|
|
369
364
|
linked_list = LinkedList()
|
|
370
365
|
n = 100
|
|
371
366
|
for i in range(n):
|
|
372
367
|
new_value = random.randrange(n)
|
|
373
368
|
linked_list.add_front(new_value)
|
|
374
|
-
d() # <--- draw linked list
|
|
375
369
|
```
|
|
376
370
|

|
|
377
371
|
|
|
378
372
|
### Binary Tree ###
|
|
379
373
|
```python
|
|
380
|
-
|
|
374
|
+
import memory_graph
|
|
381
375
|
import random
|
|
382
376
|
random.seed(0) # use same random numbers each run
|
|
383
377
|
|
|
@@ -394,7 +388,6 @@ class BinTree:
|
|
|
394
388
|
self.root = None
|
|
395
389
|
|
|
396
390
|
def add_recursive(self, new_value, node):
|
|
397
|
-
d() # <--- draw tree when adding recursively
|
|
398
391
|
if new_value < node.value:
|
|
399
392
|
if node.smaller is None:
|
|
400
393
|
node.smaller = Node(new_value)
|
|
@@ -405,6 +398,7 @@ class BinTree:
|
|
|
405
398
|
node.larger = Node(new_value)
|
|
406
399
|
else:
|
|
407
400
|
self.add_recursive(new_value, node.larger)
|
|
401
|
+
memory_graph.d() # <--- draw graph
|
|
408
402
|
|
|
409
403
|
def add(self, value):
|
|
410
404
|
if self.root is None:
|
|
@@ -417,27 +411,27 @@ n = 100
|
|
|
417
411
|
for i in range(n):
|
|
418
412
|
new_value = random.randrange(100)
|
|
419
413
|
tree.add(new_value)
|
|
420
|
-
d() # <--- draw tree after adding
|
|
421
414
|
```
|
|
422
415
|

|
|
423
416
|
|
|
424
417
|
### Hash Set ###
|
|
425
418
|
```python
|
|
426
|
-
|
|
419
|
+
import memory_graph
|
|
427
420
|
import random
|
|
428
421
|
random.seed(0) # use same random numbers each run
|
|
429
422
|
|
|
430
423
|
class HashSet:
|
|
431
424
|
|
|
432
|
-
def __init__(self, capacity=
|
|
425
|
+
def __init__(self, capacity=15):
|
|
433
426
|
self.buckets = [None] * capacity
|
|
434
427
|
|
|
435
428
|
def add(self, value):
|
|
436
429
|
index = hash(value) % len(self.buckets)
|
|
437
430
|
if self.buckets[index] is None:
|
|
438
|
-
self.buckets[index] = [
|
|
439
|
-
|
|
440
|
-
|
|
431
|
+
self.buckets[index] = []
|
|
432
|
+
bucket = self.buckets[index]
|
|
433
|
+
bucket.append(value)
|
|
434
|
+
memory_graph.d() # <--- draw graph
|
|
441
435
|
|
|
442
436
|
def contains(self, value):
|
|
443
437
|
index = hash(value) % len(self.buckets)
|
|
@@ -455,7 +449,6 @@ n = 100
|
|
|
455
449
|
for i in range(n):
|
|
456
450
|
new_value = random.randrange(n)
|
|
457
451
|
hash_set.add(new_value)
|
|
458
|
-
d() # <--- draw hash set
|
|
459
452
|
```
|
|
460
453
|

|
|
461
454
|
|
|
@@ -512,14 +505,15 @@ Different extensions are available for types from other Python packages.
|
|
|
512
505
|
Numpy types `arrray` and `matrix` and `ndarray` can be graphed with the "memory_graph.extension_numpy" extension:
|
|
513
506
|
|
|
514
507
|
```python
|
|
515
|
-
|
|
508
|
+
import memory_graph
|
|
516
509
|
import numpy as np
|
|
517
510
|
import memory_graph.extension_numpy
|
|
511
|
+
np.random.seed(0) # use same random numbers each run
|
|
518
512
|
|
|
519
513
|
array = np.array([1.1, 2, 3, 4, 5])
|
|
520
514
|
matrix = np.matrix([[i*20+j for j in range(20)] for i in range(20)])
|
|
521
515
|
ndarray = np.random.rand(20,20)
|
|
522
|
-
d()
|
|
516
|
+
memory_graph.d()
|
|
523
517
|
```
|
|
524
518
|

|
|
525
519
|
|
|
@@ -527,7 +521,7 @@ d()
|
|
|
527
521
|
Pandas types `Series` and `DataFrame` can be graphed with the "memory_graph.extension_pandas" extension:
|
|
528
522
|
|
|
529
523
|
```python
|
|
530
|
-
|
|
524
|
+
import memory_graph
|
|
531
525
|
import pandas as pd
|
|
532
526
|
import memory_graph.extension_pandas
|
|
533
527
|
|
|
@@ -538,7 +532,7 @@ dataframe2 = pd.DataFrame({ 'Name' : [ 'Tom', 'Anna', 'Steve', 'Lisa'],
|
|
|
538
532
|
'Age' : [ 28, 34, 29, 42],
|
|
539
533
|
'Length' : [ 1.70, 1.66, 1.82, 1.73] },
|
|
540
534
|
index=['one', 'two', 'three', 'four']) # with row names
|
|
541
|
-
d()
|
|
535
|
+
memory_graph.d()
|
|
542
536
|
```
|
|
543
537
|

|
|
544
538
|
|
|
@@ -7,7 +7,7 @@ long_description_from_readme = (this_directory / "README.md").read_text()
|
|
|
7
7
|
|
|
8
8
|
setup(
|
|
9
9
|
name = 'memory_graph',
|
|
10
|
-
version = '0.2.
|
|
10
|
+
version = '0.2.04',
|
|
11
11
|
description = 'Draws a graph of your data to analyze its structure.',
|
|
12
12
|
long_description = long_description_from_readme,
|
|
13
13
|
long_description_content_type = 'text/markdown',
|
|
File without changes
|
|
File without changes
|
|
File without changes
|
|
File without changes
|
|
File without changes
|
|
File without changes
|
|
File without changes
|
|
File without changes
|
|
File without changes
|
|
File without changes
|
|
File without changes
|
|
File without changes
|
|
File without changes
|
|
File without changes
|
|
File without changes
|
|
File without changes
|
|
File without changes
|
|
File without changes
|
|
File without changes
|
|
File without changes
|
|
File without changes
|
|
File without changes
|