memory-graph 0.2.1__tar.gz → 0.2.3__tar.gz
This diff represents the content of publicly available package versions that have been released to one of the supported registries. The information contained in this diff is provided for informational purposes only and reflects changes between package versions as they appear in their respective public registries.
- {memory_graph-0.2.1 → memory_graph-0.2.3}/PKG-INFO +7 -6
- {memory_graph-0.2.1 → memory_graph-0.2.3}/README.md +6 -5
- {memory_graph-0.2.1 → memory_graph-0.2.3}/memory_graph/Node.py +19 -19
- {memory_graph-0.2.1 → memory_graph-0.2.3}/memory_graph/Node_Key_Value.py +11 -1
- {memory_graph-0.2.1 → memory_graph-0.2.3}/memory_graph/Node_Linear.py +1 -1
- {memory_graph-0.2.1 → memory_graph-0.2.3}/memory_graph/Node_Table.py +7 -1
- {memory_graph-0.2.1 → memory_graph-0.2.3}/memory_graph/Sliced.py +4 -1
- {memory_graph-0.2.1 → memory_graph-0.2.3}/memory_graph/__init__.py +1 -1
- {memory_graph-0.2.1 → memory_graph-0.2.3}/memory_graph.egg-info/PKG-INFO +7 -6
- {memory_graph-0.2.1 → memory_graph-0.2.3}/setup.py +1 -1
- {memory_graph-0.2.1 → memory_graph-0.2.3}/LICENSE.txt +0 -0
- {memory_graph-0.2.1 → memory_graph-0.2.3}/MANIFEST.in +0 -0
- {memory_graph-0.2.1 → memory_graph-0.2.3}/memory_graph/HTML_Table.py +0 -0
- {memory_graph-0.2.1 → memory_graph-0.2.3}/memory_graph/Memory_Graph.py +0 -0
- {memory_graph-0.2.1 → memory_graph-0.2.3}/memory_graph/Memory_Visitor.py +0 -0
- {memory_graph-0.2.1 → memory_graph-0.2.3}/memory_graph/Node_Hidden.py +0 -0
- {memory_graph-0.2.1 → memory_graph-0.2.3}/memory_graph/Slicer.py +0 -0
- {memory_graph-0.2.1 → memory_graph-0.2.3}/memory_graph/config.py +0 -0
- {memory_graph-0.2.1 → memory_graph-0.2.3}/memory_graph/config_default.py +0 -0
- {memory_graph-0.2.1 → memory_graph-0.2.3}/memory_graph/config_helpers.py +0 -0
- {memory_graph-0.2.1 → memory_graph-0.2.3}/memory_graph/extension_numpy.py +0 -0
- {memory_graph-0.2.1 → memory_graph-0.2.3}/memory_graph/extension_pandas.py +0 -0
- {memory_graph-0.2.1 → memory_graph-0.2.3}/memory_graph/special_types.py +0 -0
- {memory_graph-0.2.1 → memory_graph-0.2.3}/memory_graph/test.py +0 -0
- {memory_graph-0.2.1 → memory_graph-0.2.3}/memory_graph/test_memory_graph.py +0 -0
- {memory_graph-0.2.1 → memory_graph-0.2.3}/memory_graph/test_memory_visitor.py +0 -0
- {memory_graph-0.2.1 → memory_graph-0.2.3}/memory_graph/utils.py +0 -0
- {memory_graph-0.2.1 → memory_graph-0.2.3}/memory_graph.egg-info/SOURCES.txt +0 -0
- {memory_graph-0.2.1 → memory_graph-0.2.3}/memory_graph.egg-info/dependency_links.txt +0 -0
- {memory_graph-0.2.1 → memory_graph-0.2.3}/memory_graph.egg-info/requires.txt +0 -0
- {memory_graph-0.2.1 → memory_graph-0.2.3}/memory_graph.egg-info/top_level.txt +0 -0
- {memory_graph-0.2.1 → memory_graph-0.2.3}/setup.cfg +0 -0
|
@@ -1,6 +1,6 @@
|
|
|
1
1
|
Metadata-Version: 2.1
|
|
2
2
|
Name: memory_graph
|
|
3
|
-
Version: 0.2.
|
|
3
|
+
Version: 0.2.3
|
|
4
4
|
Summary: Draws a graph of your data to analyze its structure.
|
|
5
5
|
Home-page: https://github.com/bterwijn/memory_graph
|
|
6
6
|
Author: Bas Terwijn
|
|
@@ -67,7 +67,7 @@ identical?: True
|
|
|
67
67
|
```
|
|
68
68
|
A better way to understand what data is shared is to draw a graph of the data using the [memory_graph](https://pypi.org/project/memory-graph/) package.
|
|
69
69
|
|
|
70
|
-
# Memory Graph
|
|
70
|
+
# Memory Graph #
|
|
71
71
|
The [memory_graph](https://pypi.org/project/memory-graph/) package can graph many different data types.
|
|
72
72
|
|
|
73
73
|
```python
|
|
@@ -131,7 +131,7 @@ The [Python Data Model](https://docs.python.org/3/reference/datamodel.html) make
|
|
|
131
131
|
In the code below variable `a` and `b` both reference the same `int` value 10. An `int` is an immutable type and therefore when we change variable `a` its value can **not** be mutated in place, and thus a copy is made and `a` and `b` reference a different value afterwards.
|
|
132
132
|
```python
|
|
133
133
|
import memory_graph
|
|
134
|
-
memory_graph.
|
|
134
|
+
memory_graph.config.no_reference_types.pop(int, None) # show references to ints
|
|
135
135
|
|
|
136
136
|
a = 10
|
|
137
137
|
b = a
|
|
@@ -287,7 +287,7 @@ print(f"a:{a} b:{b} c:{c}")
|
|
|
287
287
|
|
|
288
288
|
As `a` is of immutable type 'int' and as we call the function with a copy of `c`, only `b` is shared so only `b` is changed in the calling stack frame as reflected in the printed output:
|
|
289
289
|
```
|
|
290
|
-
a:
|
|
290
|
+
a:10 b:[4, 3, 2, 1] c:[4, 3, 2]
|
|
291
291
|
```
|
|
292
292
|
|
|
293
293
|
### Recursion ###
|
|
@@ -488,7 +488,7 @@ Different aspects of memory_graph can be configured. The default configuration i
|
|
|
488
488
|
- Maps each type to a Slicer. A slicer determines how many elements of a data type are shown in the graph to prevent the graph from getting too big. 'Slicer()' does no slicing, 'Slicer(1,2,3)' shows just 1 element at the beginning, 2 in the middle, and 3 at the end.
|
|
489
489
|
|
|
490
490
|
### Temporary Configuration ###
|
|
491
|
-
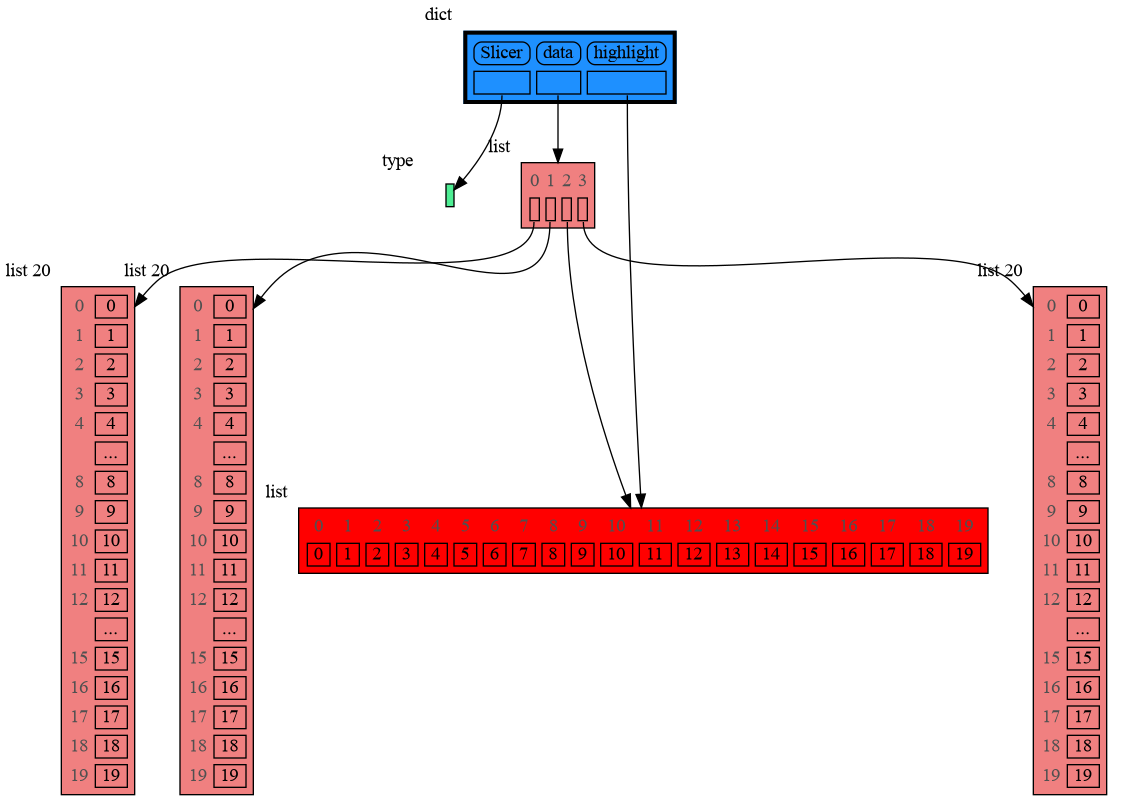
In addition to the global configuration, a temporary configuration can be set for a single `show()`, `render()`, or `d()` call to change the colors, orientation, and slicer. This example highlights a particular list element in red, gives it a horizontal
|
|
491
|
+
In addition to the global configuration, a temporary configuration can be set for a single `show()`, `render()`, or `d()` call to change the colors, orientation, and slicer. This example highlights a particular list element in red, gives it a horizontal orientation, and overwrites the default slicer for lists:
|
|
492
492
|
|
|
493
493
|
```python
|
|
494
494
|
import memory_graph
|
|
@@ -506,7 +506,7 @@ memory_graph.show( locals(),
|
|
|
506
506
|
|
|
507
507
|
|
|
508
508
|
## 6. Extensions ##
|
|
509
|
-
Different
|
|
509
|
+
Different extensions are available for types from other Python packages.
|
|
510
510
|
|
|
511
511
|
### Numpy ###
|
|
512
512
|
Numpy types `arrray` and `matrix` and `ndarray` can be graphed with the "memory_graph.extension_numpy" extension:
|
|
@@ -515,6 +515,7 @@ Numpy types `arrray` and `matrix` and `ndarray` can be graphed with the "memory_
|
|
|
515
515
|
from memory_graph import d
|
|
516
516
|
import numpy as np
|
|
517
517
|
import memory_graph.extension_numpy
|
|
518
|
+
np.random.seed(0) # use same random numbers each run
|
|
518
519
|
|
|
519
520
|
array = np.array([1.1, 2, 3, 4, 5])
|
|
520
521
|
matrix = np.matrix([[i*20+j for j in range(20)] for i in range(20)])
|
|
@@ -48,7 +48,7 @@ identical?: True
|
|
|
48
48
|
```
|
|
49
49
|
A better way to understand what data is shared is to draw a graph of the data using the [memory_graph](https://pypi.org/project/memory-graph/) package.
|
|
50
50
|
|
|
51
|
-
# Memory Graph
|
|
51
|
+
# Memory Graph #
|
|
52
52
|
The [memory_graph](https://pypi.org/project/memory-graph/) package can graph many different data types.
|
|
53
53
|
|
|
54
54
|
```python
|
|
@@ -112,7 +112,7 @@ The [Python Data Model](https://docs.python.org/3/reference/datamodel.html) make
|
|
|
112
112
|
In the code below variable `a` and `b` both reference the same `int` value 10. An `int` is an immutable type and therefore when we change variable `a` its value can **not** be mutated in place, and thus a copy is made and `a` and `b` reference a different value afterwards.
|
|
113
113
|
```python
|
|
114
114
|
import memory_graph
|
|
115
|
-
memory_graph.
|
|
115
|
+
memory_graph.config.no_reference_types.pop(int, None) # show references to ints
|
|
116
116
|
|
|
117
117
|
a = 10
|
|
118
118
|
b = a
|
|
@@ -268,7 +268,7 @@ print(f"a:{a} b:{b} c:{c}")
|
|
|
268
268
|
|
|
269
269
|
As `a` is of immutable type 'int' and as we call the function with a copy of `c`, only `b` is shared so only `b` is changed in the calling stack frame as reflected in the printed output:
|
|
270
270
|
```
|
|
271
|
-
a:
|
|
271
|
+
a:10 b:[4, 3, 2, 1] c:[4, 3, 2]
|
|
272
272
|
```
|
|
273
273
|
|
|
274
274
|
### Recursion ###
|
|
@@ -469,7 +469,7 @@ Different aspects of memory_graph can be configured. The default configuration i
|
|
|
469
469
|
- Maps each type to a Slicer. A slicer determines how many elements of a data type are shown in the graph to prevent the graph from getting too big. 'Slicer()' does no slicing, 'Slicer(1,2,3)' shows just 1 element at the beginning, 2 in the middle, and 3 at the end.
|
|
470
470
|
|
|
471
471
|
### Temporary Configuration ###
|
|
472
|
-
In addition to the global configuration, a temporary configuration can be set for a single `show()`, `render()`, or `d()` call to change the colors, orientation, and slicer. This example highlights a particular list element in red, gives it a horizontal
|
|
472
|
+
In addition to the global configuration, a temporary configuration can be set for a single `show()`, `render()`, or `d()` call to change the colors, orientation, and slicer. This example highlights a particular list element in red, gives it a horizontal orientation, and overwrites the default slicer for lists:
|
|
473
473
|
|
|
474
474
|
```python
|
|
475
475
|
import memory_graph
|
|
@@ -487,7 +487,7 @@ memory_graph.show( locals(),
|
|
|
487
487
|

|
|
488
488
|
|
|
489
489
|
## 6. Extensions ##
|
|
490
|
-
Different
|
|
490
|
+
Different extensions are available for types from other Python packages.
|
|
491
491
|
|
|
492
492
|
### Numpy ###
|
|
493
493
|
Numpy types `arrray` and `matrix` and `ndarray` can be graphed with the "memory_graph.extension_numpy" extension:
|
|
@@ -496,6 +496,7 @@ Numpy types `arrray` and `matrix` and `ndarray` can be graphed with the "memory_
|
|
|
496
496
|
from memory_graph import d
|
|
497
497
|
import numpy as np
|
|
498
498
|
import memory_graph.extension_numpy
|
|
499
|
+
np.random.seed(0) # use same random numbers each run
|
|
499
500
|
|
|
500
501
|
array = np.array([1.1, 2, 3, 4, 5])
|
|
501
502
|
matrix = np.matrix([[i*20+j for j in range(20)] for i in range(20)])
|
|
@@ -15,11 +15,10 @@ class Node:
|
|
|
15
15
|
children (list): The children of the node.
|
|
16
16
|
size (string): The size of the node to be shown in the graph.
|
|
17
17
|
"""
|
|
18
|
-
def __init__(self, data, children=None
|
|
18
|
+
def __init__(self, data, children=None):
|
|
19
19
|
self.node_id = Node.node_id
|
|
20
20
|
Node.node_id += 1
|
|
21
21
|
self.data = data
|
|
22
|
-
self.size = size
|
|
23
22
|
self.parent = None
|
|
24
23
|
self.children = children
|
|
25
24
|
|
|
@@ -34,6 +33,18 @@ class Node:
|
|
|
34
33
|
Return the original data represented by the node.
|
|
35
34
|
"""
|
|
36
35
|
return self.data
|
|
36
|
+
|
|
37
|
+
def get_type(self):
|
|
38
|
+
"""
|
|
39
|
+
Return the type of the data represented by the node.
|
|
40
|
+
"""
|
|
41
|
+
return type(self.data)
|
|
42
|
+
|
|
43
|
+
def get_type_name(self):
|
|
44
|
+
"""
|
|
45
|
+
Return the name of the type of the data represented by the node.
|
|
46
|
+
"""
|
|
47
|
+
return utils.get_type_name(self.data)
|
|
37
48
|
|
|
38
49
|
def set_parent(self, parent):
|
|
39
50
|
"""
|
|
@@ -47,12 +58,6 @@ class Node:
|
|
|
47
58
|
"""
|
|
48
59
|
return self.parent
|
|
49
60
|
|
|
50
|
-
def get_size(self):
|
|
51
|
-
"""
|
|
52
|
-
Return the size of the node to be shown in the graph.
|
|
53
|
-
"""
|
|
54
|
-
return self.size
|
|
55
|
-
|
|
56
61
|
def get_children(self):
|
|
57
62
|
"""
|
|
58
63
|
Return the children of the node. Initially the children are raw data, but
|
|
@@ -78,17 +83,6 @@ class Node:
|
|
|
78
83
|
self.fill_html_table(html_table)
|
|
79
84
|
return html_table
|
|
80
85
|
|
|
81
|
-
def get_label(self):
|
|
82
|
-
"""
|
|
83
|
-
Return a label for the node to be shown in the graph next to the HTML table, the size
|
|
84
|
-
is included in the label if available.
|
|
85
|
-
"""
|
|
86
|
-
label = utils.get_type_name(self.data)
|
|
87
|
-
size = self.get_size()
|
|
88
|
-
if not size is None:
|
|
89
|
-
label +=f' ({size})'
|
|
90
|
-
return label
|
|
91
|
-
|
|
92
86
|
# -------------------- Node interface, overriden by subclasses --------------------
|
|
93
87
|
|
|
94
88
|
def do_backtrack_callback(self):
|
|
@@ -109,3 +103,9 @@ class Node:
|
|
|
109
103
|
Fill the HTML_Table object with each child of the node.
|
|
110
104
|
"""
|
|
111
105
|
pass
|
|
106
|
+
|
|
107
|
+
def get_label(self):
|
|
108
|
+
"""
|
|
109
|
+
Return a label for the node to be shown in the graph next to the HTML table.
|
|
110
|
+
"""
|
|
111
|
+
return self.get_type_name()
|
|
@@ -37,9 +37,10 @@ class Node_Key_Value(Node):
|
|
|
37
37
|
"""
|
|
38
38
|
#print('Node_Key_Value children:', children)
|
|
39
39
|
hidden_children = [ Node_Hidden(i,list(i)) for i in children ]
|
|
40
|
+
self.size = len(hidden_children)
|
|
40
41
|
slicer = config_helpers.get_slicer_1d(self, data)
|
|
41
42
|
sliced_children = slicer.slice(hidden_children)
|
|
42
|
-
super().__init__(data, sliced_children
|
|
43
|
+
super().__init__(data, sliced_children)
|
|
43
44
|
|
|
44
45
|
def transform(self, fun):
|
|
45
46
|
"""
|
|
@@ -91,3 +92,12 @@ class Node_Key_Value(Node):
|
|
|
91
92
|
if value is not None:
|
|
92
93
|
key_value = value.get_children() # add the key-value pair of Hidden_Node, not the tuple
|
|
93
94
|
html_table.add_entry(self, key_value[1])
|
|
95
|
+
|
|
96
|
+
def get_label(self):
|
|
97
|
+
"""
|
|
98
|
+
Return a label for the node to be shown in the graph next to the HTML table.
|
|
99
|
+
"""
|
|
100
|
+
if self.get_children().has_all_data():
|
|
101
|
+
return f'{self.get_type_name()}'
|
|
102
|
+
return f'{self.get_type_name()} {self.size}'
|
|
103
|
+
|
|
@@ -16,7 +16,7 @@ class Node_Linear(Node):
|
|
|
16
16
|
"""
|
|
17
17
|
slicer = config_helpers.get_slicer_1d(self, data)
|
|
18
18
|
sliced_children = slicer.slice(children)
|
|
19
|
-
super().__init__(data, sliced_children
|
|
19
|
+
super().__init__(data, sliced_children)
|
|
20
20
|
|
|
21
21
|
def transform(self, fun):
|
|
22
22
|
"""
|
|
@@ -38,7 +38,7 @@ class Node_Table(Node):
|
|
|
38
38
|
|
|
39
39
|
self.row_names = row_names
|
|
40
40
|
self.column_names = column_names
|
|
41
|
-
super().__init__(data, sliced_children
|
|
41
|
+
super().__init__(data, sliced_children)
|
|
42
42
|
|
|
43
43
|
def transform(self, fun):
|
|
44
44
|
"""
|
|
@@ -82,3 +82,9 @@ class Node_Table(Node):
|
|
|
82
82
|
html_table.add_entry(self, value)
|
|
83
83
|
html_table.add_new_line()
|
|
84
84
|
|
|
85
|
+
def get_label(self):
|
|
86
|
+
"""
|
|
87
|
+
Return a label for the node to be shown in the graph next to the HTML table.
|
|
88
|
+
"""
|
|
89
|
+
return f'{self.get_type_name()} {self.data_height}⨯{self.data_width}'
|
|
90
|
+
|
|
@@ -108,4 +108,7 @@ class Sliced:
|
|
|
108
108
|
def last_slice_empty(self):
|
|
109
109
|
""" Return True if the last slice of the Sliced object is empty. """
|
|
110
110
|
return len(self.slices) > 0 and len(self.slices[-1].data) == 0
|
|
111
|
-
|
|
111
|
+
|
|
112
|
+
def has_all_data(self):
|
|
113
|
+
""" Return True if the Sliced object has all the data. """
|
|
114
|
+
return len(self.slices) == 1 and len(self.slices[0].data) == self.original_length
|
|
@@ -1,6 +1,6 @@
|
|
|
1
1
|
Metadata-Version: 2.1
|
|
2
2
|
Name: memory-graph
|
|
3
|
-
Version: 0.2.
|
|
3
|
+
Version: 0.2.3
|
|
4
4
|
Summary: Draws a graph of your data to analyze its structure.
|
|
5
5
|
Home-page: https://github.com/bterwijn/memory_graph
|
|
6
6
|
Author: Bas Terwijn
|
|
@@ -67,7 +67,7 @@ identical?: True
|
|
|
67
67
|
```
|
|
68
68
|
A better way to understand what data is shared is to draw a graph of the data using the [memory_graph](https://pypi.org/project/memory-graph/) package.
|
|
69
69
|
|
|
70
|
-
# Memory Graph
|
|
70
|
+
# Memory Graph #
|
|
71
71
|
The [memory_graph](https://pypi.org/project/memory-graph/) package can graph many different data types.
|
|
72
72
|
|
|
73
73
|
```python
|
|
@@ -131,7 +131,7 @@ The [Python Data Model](https://docs.python.org/3/reference/datamodel.html) make
|
|
|
131
131
|
In the code below variable `a` and `b` both reference the same `int` value 10. An `int` is an immutable type and therefore when we change variable `a` its value can **not** be mutated in place, and thus a copy is made and `a` and `b` reference a different value afterwards.
|
|
132
132
|
```python
|
|
133
133
|
import memory_graph
|
|
134
|
-
memory_graph.
|
|
134
|
+
memory_graph.config.no_reference_types.pop(int, None) # show references to ints
|
|
135
135
|
|
|
136
136
|
a = 10
|
|
137
137
|
b = a
|
|
@@ -287,7 +287,7 @@ print(f"a:{a} b:{b} c:{c}")
|
|
|
287
287
|
|
|
288
288
|
As `a` is of immutable type 'int' and as we call the function with a copy of `c`, only `b` is shared so only `b` is changed in the calling stack frame as reflected in the printed output:
|
|
289
289
|
```
|
|
290
|
-
a:
|
|
290
|
+
a:10 b:[4, 3, 2, 1] c:[4, 3, 2]
|
|
291
291
|
```
|
|
292
292
|
|
|
293
293
|
### Recursion ###
|
|
@@ -488,7 +488,7 @@ Different aspects of memory_graph can be configured. The default configuration i
|
|
|
488
488
|
- Maps each type to a Slicer. A slicer determines how many elements of a data type are shown in the graph to prevent the graph from getting too big. 'Slicer()' does no slicing, 'Slicer(1,2,3)' shows just 1 element at the beginning, 2 in the middle, and 3 at the end.
|
|
489
489
|
|
|
490
490
|
### Temporary Configuration ###
|
|
491
|
-
In addition to the global configuration, a temporary configuration can be set for a single `show()`, `render()`, or `d()` call to change the colors, orientation, and slicer. This example highlights a particular list element in red, gives it a horizontal
|
|
491
|
+
In addition to the global configuration, a temporary configuration can be set for a single `show()`, `render()`, or `d()` call to change the colors, orientation, and slicer. This example highlights a particular list element in red, gives it a horizontal orientation, and overwrites the default slicer for lists:
|
|
492
492
|
|
|
493
493
|
```python
|
|
494
494
|
import memory_graph
|
|
@@ -506,7 +506,7 @@ memory_graph.show( locals(),
|
|
|
506
506
|

|
|
507
507
|
|
|
508
508
|
## 6. Extensions ##
|
|
509
|
-
Different
|
|
509
|
+
Different extensions are available for types from other Python packages.
|
|
510
510
|
|
|
511
511
|
### Numpy ###
|
|
512
512
|
Numpy types `arrray` and `matrix` and `ndarray` can be graphed with the "memory_graph.extension_numpy" extension:
|
|
@@ -515,6 +515,7 @@ Numpy types `arrray` and `matrix` and `ndarray` can be graphed with the "memory_
|
|
|
515
515
|
from memory_graph import d
|
|
516
516
|
import numpy as np
|
|
517
517
|
import memory_graph.extension_numpy
|
|
518
|
+
np.random.seed(0) # use same random numbers each run
|
|
518
519
|
|
|
519
520
|
array = np.array([1.1, 2, 3, 4, 5])
|
|
520
521
|
matrix = np.matrix([[i*20+j for j in range(20)] for i in range(20)])
|
|
@@ -7,7 +7,7 @@ long_description_from_readme = (this_directory / "README.md").read_text()
|
|
|
7
7
|
|
|
8
8
|
setup(
|
|
9
9
|
name = 'memory_graph',
|
|
10
|
-
version = '0.2.
|
|
10
|
+
version = '0.2.03',
|
|
11
11
|
description = 'Draws a graph of your data to analyze its structure.',
|
|
12
12
|
long_description = long_description_from_readme,
|
|
13
13
|
long_description_content_type = 'text/markdown',
|
|
File without changes
|
|
File without changes
|
|
File without changes
|
|
File without changes
|
|
File without changes
|
|
File without changes
|
|
File without changes
|
|
File without changes
|
|
File without changes
|
|
File without changes
|
|
File without changes
|
|
File without changes
|
|
File without changes
|
|
File without changes
|
|
File without changes
|
|
File without changes
|
|
File without changes
|
|
File without changes
|
|
File without changes
|
|
File without changes
|
|
File without changes
|
|
File without changes
|