memory-graph 0.2.0__tar.gz → 0.2.1__tar.gz
This diff represents the content of publicly available package versions that have been released to one of the supported registries. The information contained in this diff is provided for informational purposes only and reflects changes between package versions as they appear in their respective public registries.
- {memory_graph-0.2.0 → memory_graph-0.2.1}/PKG-INFO +23 -18
- {memory_graph-0.2.0 → memory_graph-0.2.1}/README.md +21 -16
- {memory_graph-0.2.0 → memory_graph-0.2.1}/memory_graph/Memory_Visitor.py +3 -4
- {memory_graph-0.2.0 → memory_graph-0.2.1}/memory_graph/__init__.py +1 -1
- {memory_graph-0.2.0 → memory_graph-0.2.1}/memory_graph/config.py +3 -3
- {memory_graph-0.2.0 → memory_graph-0.2.1}/memory_graph/config_default.py +6 -3
- memory_graph-0.2.1/memory_graph/special_types.py +4 -0
- {memory_graph-0.2.0 → memory_graph-0.2.1}/memory_graph/test.py +1 -1
- {memory_graph-0.2.0 → memory_graph-0.2.1}/memory_graph/test_memory_graph.py +0 -1
- {memory_graph-0.2.0 → memory_graph-0.2.1}/memory_graph.egg-info/PKG-INFO +23 -18
- {memory_graph-0.2.0 → memory_graph-0.2.1}/memory_graph.egg-info/SOURCES.txt +1 -0
- {memory_graph-0.2.0 → memory_graph-0.2.1}/setup.py +2 -2
- {memory_graph-0.2.0 → memory_graph-0.2.1}/LICENSE.txt +0 -0
- {memory_graph-0.2.0 → memory_graph-0.2.1}/MANIFEST.in +0 -0
- {memory_graph-0.2.0 → memory_graph-0.2.1}/memory_graph/HTML_Table.py +0 -0
- {memory_graph-0.2.0 → memory_graph-0.2.1}/memory_graph/Memory_Graph.py +0 -0
- {memory_graph-0.2.0 → memory_graph-0.2.1}/memory_graph/Node.py +0 -0
- {memory_graph-0.2.0 → memory_graph-0.2.1}/memory_graph/Node_Hidden.py +0 -0
- {memory_graph-0.2.0 → memory_graph-0.2.1}/memory_graph/Node_Key_Value.py +0 -0
- {memory_graph-0.2.0 → memory_graph-0.2.1}/memory_graph/Node_Linear.py +0 -0
- {memory_graph-0.2.0 → memory_graph-0.2.1}/memory_graph/Node_Table.py +0 -0
- {memory_graph-0.2.0 → memory_graph-0.2.1}/memory_graph/Sliced.py +0 -0
- {memory_graph-0.2.0 → memory_graph-0.2.1}/memory_graph/Slicer.py +0 -0
- {memory_graph-0.2.0 → memory_graph-0.2.1}/memory_graph/config_helpers.py +0 -0
- {memory_graph-0.2.0 → memory_graph-0.2.1}/memory_graph/extension_numpy.py +0 -0
- {memory_graph-0.2.0 → memory_graph-0.2.1}/memory_graph/extension_pandas.py +0 -0
- {memory_graph-0.2.0 → memory_graph-0.2.1}/memory_graph/test_memory_visitor.py +0 -0
- {memory_graph-0.2.0 → memory_graph-0.2.1}/memory_graph/utils.py +0 -0
- {memory_graph-0.2.0 → memory_graph-0.2.1}/memory_graph.egg-info/dependency_links.txt +0 -0
- {memory_graph-0.2.0 → memory_graph-0.2.1}/memory_graph.egg-info/requires.txt +0 -0
- {memory_graph-0.2.0 → memory_graph-0.2.1}/memory_graph.egg-info/top_level.txt +0 -0
- {memory_graph-0.2.0 → memory_graph-0.2.1}/setup.cfg +0 -0
|
@@ -1,7 +1,7 @@
|
|
|
1
1
|
Metadata-Version: 2.1
|
|
2
2
|
Name: memory_graph
|
|
3
|
-
Version: 0.2.
|
|
4
|
-
Summary: Draws a graph of your data to analyze
|
|
3
|
+
Version: 0.2.1
|
|
4
|
+
Summary: Draws a graph of your data to analyze its structure.
|
|
5
5
|
Home-page: https://github.com/bterwijn/memory_graph
|
|
6
6
|
Author: Bas Terwijn
|
|
7
7
|
Author-email: bterwijn@gmail.com
|
|
@@ -38,16 +38,16 @@ a = [4, 3, 2]
|
|
|
38
38
|
b = a
|
|
39
39
|
a.append(1) # changing 'a' changes 'b'
|
|
40
40
|
|
|
41
|
-
# print the
|
|
41
|
+
# print the 'a' and 'b' list
|
|
42
42
|
print('a:', a)
|
|
43
43
|
print('b:', b)
|
|
44
44
|
|
|
45
|
-
# check if
|
|
45
|
+
# check if 'a' and 'b' share data
|
|
46
46
|
print('ids:', id(a), id(b))
|
|
47
47
|
print('identical?:', a is b)
|
|
48
48
|
|
|
49
|
-
# show
|
|
50
|
-
memory_graph.show(locals())
|
|
49
|
+
# show all local variables in a graph
|
|
50
|
+
memory_graph.show( locals() )
|
|
51
51
|
```
|
|
52
52
|
|
|
53
53
|
</td><td>
|
|
@@ -65,21 +65,26 @@ b: 4, 3, 2, 1
|
|
|
65
65
|
ids: 126432214913216 126432214913216
|
|
66
66
|
identical?: True
|
|
67
67
|
```
|
|
68
|
-
A better way to understand what data is shared is to draw a graph of the data using
|
|
68
|
+
A better way to understand what data is shared is to draw a graph of the data using the [memory_graph](https://pypi.org/project/memory-graph/) package.
|
|
69
69
|
|
|
70
70
|
# Memory Graph Packge #
|
|
71
|
-
The [memory_graph](https://pypi.org/project/memory-graph/) package can
|
|
71
|
+
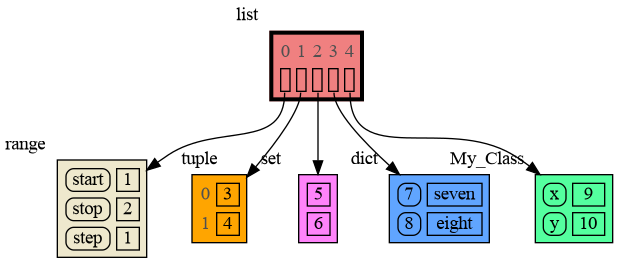
The [memory_graph](https://pypi.org/project/memory-graph/) package can graph many different data types.
|
|
72
72
|
|
|
73
73
|
```python
|
|
74
74
|
import memory_graph
|
|
75
75
|
|
|
76
|
-
|
|
76
|
+
class MyClass:
|
|
77
|
+
|
|
78
|
+
def __init__(self, x, y):
|
|
79
|
+
self.x = x
|
|
80
|
+
self.y = y
|
|
81
|
+
|
|
82
|
+
data = [ range(1, 2), (3, 4), {5, 6}, {7:'seven', 8:'eight'}, MyClass(9, 10) ]
|
|
77
83
|
memory_graph.show(data, block=True)
|
|
78
84
|
```
|
|
79
|
-
|
|
80
85
|
|
|
81
86
|
|
|
82
|
-
By using `block=True` the program blocks until the ENTER key is pressed so you can view the graph before continuing program execution (and possibly viewing later graphs). Instead of showing the graph you can also render it to an output file of
|
|
87
|
+
By using `block=True` the program blocks until the ENTER key is pressed so you can view the graph before continuing program execution (and possibly viewing later graphs). Instead of showing the graph you can also render it to an output file of your choosing (see [Graphviz Output Formats](https://graphviz.org/docs/outputs/)) using for example:
|
|
83
88
|
|
|
84
89
|
```python
|
|
85
90
|
memory_graph.render(data, "my_graph.pdf")
|
|
@@ -458,18 +463,18 @@ for i in range(n):
|
|
|
458
463
|
## 5. Configuration ##
|
|
459
464
|
Different aspects of memory_graph can be configured. The default configuration is reset by importing 'memory_graph.config_default'.
|
|
460
465
|
|
|
466
|
+
- ***memory_graph.config.max_number_nodes*** : int
|
|
467
|
+
- The maxium number of Nodes shown in the graph. When the graph gets too big set this to a smaller number. A `★` symbol indictes where the graph is cut short.
|
|
468
|
+
|
|
469
|
+
- ***memory_graph.config.max_string_length*** : int
|
|
470
|
+
- The maximum length of strings shown in the graph. Longer strings will be truncated.
|
|
471
|
+
|
|
461
472
|
- ***memory_graph.config.no_reference_types*** : dict
|
|
462
|
-
- Holds all types for which no seperate node
|
|
473
|
+
- Holds all types for which no seperate node is drawn but that instead are shown as elements in their parent Node. It maps each type to a function that determines how it is visualized.
|
|
463
474
|
|
|
464
475
|
- ***memory_graph.config.no_child_references_types*** : set
|
|
465
476
|
- The set of key_value types that don't draw references to their direct childeren but have their children shown as elements of their node.
|
|
466
477
|
|
|
467
|
-
- ***memory_graph.config.max_string_length*** : int
|
|
468
|
-
- The maximum length of strings shown in the graph.
|
|
469
|
-
|
|
470
|
-
- ***memory_graph.config.max_number_nodes*** : int
|
|
471
|
-
- The maxium number of Nodes shows in the graph. When the graph gets to big set this to a small number to analyze the problem.
|
|
472
|
-
|
|
473
478
|
- ***memory_graph.config.type_to_node*** : dict
|
|
474
479
|
- Determines how a data types is converted to a Node (sub)class for visualization in the graph.
|
|
475
480
|
|
|
@@ -19,16 +19,16 @@ a = [4, 3, 2]
|
|
|
19
19
|
b = a
|
|
20
20
|
a.append(1) # changing 'a' changes 'b'
|
|
21
21
|
|
|
22
|
-
# print the
|
|
22
|
+
# print the 'a' and 'b' list
|
|
23
23
|
print('a:', a)
|
|
24
24
|
print('b:', b)
|
|
25
25
|
|
|
26
|
-
# check if
|
|
26
|
+
# check if 'a' and 'b' share data
|
|
27
27
|
print('ids:', id(a), id(b))
|
|
28
28
|
print('identical?:', a is b)
|
|
29
29
|
|
|
30
|
-
# show
|
|
31
|
-
memory_graph.show(locals())
|
|
30
|
+
# show all local variables in a graph
|
|
31
|
+
memory_graph.show( locals() )
|
|
32
32
|
```
|
|
33
33
|
|
|
34
34
|
</td><td>
|
|
@@ -46,21 +46,26 @@ b: 4, 3, 2, 1
|
|
|
46
46
|
ids: 126432214913216 126432214913216
|
|
47
47
|
identical?: True
|
|
48
48
|
```
|
|
49
|
-
A better way to understand what data is shared is to draw a graph of the data using
|
|
49
|
+
A better way to understand what data is shared is to draw a graph of the data using the [memory_graph](https://pypi.org/project/memory-graph/) package.
|
|
50
50
|
|
|
51
51
|
# Memory Graph Packge #
|
|
52
|
-
The [memory_graph](https://pypi.org/project/memory-graph/) package can
|
|
52
|
+
The [memory_graph](https://pypi.org/project/memory-graph/) package can graph many different data types.
|
|
53
53
|
|
|
54
54
|
```python
|
|
55
55
|
import memory_graph
|
|
56
56
|
|
|
57
|
-
|
|
57
|
+
class MyClass:
|
|
58
|
+
|
|
59
|
+
def __init__(self, x, y):
|
|
60
|
+
self.x = x
|
|
61
|
+
self.y = y
|
|
62
|
+
|
|
63
|
+
data = [ range(1, 2), (3, 4), {5, 6}, {7:'seven', 8:'eight'}, MyClass(9, 10) ]
|
|
58
64
|
memory_graph.show(data, block=True)
|
|
59
65
|
```
|
|
60
|
-
|
|
61
66
|

|
|
62
67
|
|
|
63
|
-
By using `block=True` the program blocks until the ENTER key is pressed so you can view the graph before continuing program execution (and possibly viewing later graphs). Instead of showing the graph you can also render it to an output file of
|
|
68
|
+
By using `block=True` the program blocks until the ENTER key is pressed so you can view the graph before continuing program execution (and possibly viewing later graphs). Instead of showing the graph you can also render it to an output file of your choosing (see [Graphviz Output Formats](https://graphviz.org/docs/outputs/)) using for example:
|
|
64
69
|
|
|
65
70
|
```python
|
|
66
71
|
memory_graph.render(data, "my_graph.pdf")
|
|
@@ -439,18 +444,18 @@ for i in range(n):
|
|
|
439
444
|
## 5. Configuration ##
|
|
440
445
|
Different aspects of memory_graph can be configured. The default configuration is reset by importing 'memory_graph.config_default'.
|
|
441
446
|
|
|
447
|
+
- ***memory_graph.config.max_number_nodes*** : int
|
|
448
|
+
- The maxium number of Nodes shown in the graph. When the graph gets too big set this to a smaller number. A `★` symbol indictes where the graph is cut short.
|
|
449
|
+
|
|
450
|
+
- ***memory_graph.config.max_string_length*** : int
|
|
451
|
+
- The maximum length of strings shown in the graph. Longer strings will be truncated.
|
|
452
|
+
|
|
442
453
|
- ***memory_graph.config.no_reference_types*** : dict
|
|
443
|
-
- Holds all types for which no seperate node
|
|
454
|
+
- Holds all types for which no seperate node is drawn but that instead are shown as elements in their parent Node. It maps each type to a function that determines how it is visualized.
|
|
444
455
|
|
|
445
456
|
- ***memory_graph.config.no_child_references_types*** : set
|
|
446
457
|
- The set of key_value types that don't draw references to their direct childeren but have their children shown as elements of their node.
|
|
447
458
|
|
|
448
|
-
- ***memory_graph.config.max_string_length*** : int
|
|
449
|
-
- The maximum length of strings shown in the graph.
|
|
450
|
-
|
|
451
|
-
- ***memory_graph.config.max_number_nodes*** : int
|
|
452
|
-
- The maxium number of Nodes shows in the graph. When the graph gets to big set this to a small number to analyze the problem.
|
|
453
|
-
|
|
454
459
|
- ***memory_graph.config.type_to_node*** : dict
|
|
455
460
|
- Determines how a data types is converted to a Node (sub)class for visualization in the graph.
|
|
456
461
|
|
|
@@ -6,7 +6,6 @@ import memory_graph.utils as utils
|
|
|
6
6
|
import memory_graph.config as config
|
|
7
7
|
import memory_graph.config_helpers as config_helpers
|
|
8
8
|
|
|
9
|
-
|
|
10
9
|
def default_backtrack_callback(node):
|
|
11
10
|
print('backtrack_callback:', node)
|
|
12
11
|
#node.visit_with_depth(lambda child: print('-- child:', child))
|
|
@@ -49,12 +48,12 @@ class Memory_Visitor:
|
|
|
49
48
|
data_type = type(data)
|
|
50
49
|
if (parent_node != None and data_type in config.no_reference_types):
|
|
51
50
|
return config.no_reference_types[data_type](data)
|
|
52
|
-
if len(self.data_ids) > config.max_number_nodes:
|
|
53
|
-
print(f"Memory_Visitor max_number_nodes ({config.max_number_nodes}) reached, stopping recursion.")
|
|
54
|
-
return None
|
|
55
51
|
data_id = id(data)
|
|
56
52
|
if data_id in self.data_ids:
|
|
57
53
|
return self.data_ids[data_id]
|
|
54
|
+
elif len(self.data_ids) > config.max_number_nodes:
|
|
55
|
+
print(f"Memory_Visitor max_number_nodes ({config.max_number_nodes}) reached, stopping recursion.")
|
|
56
|
+
return "★"
|
|
58
57
|
else:
|
|
59
58
|
node = self.data_to_node(data)
|
|
60
59
|
self.data_ids[data_id] = node
|
|
@@ -1,11 +1,11 @@
|
|
|
1
1
|
""" Configuration file for the graph visualizer. The configuration values are set later by the 'config_default.py' file. """
|
|
2
2
|
|
|
3
|
+
max_number_nodes = 0
|
|
4
|
+
max_string_length = 0
|
|
5
|
+
|
|
3
6
|
no_reference_types = {}
|
|
4
7
|
no_child_references_types = set()
|
|
5
8
|
|
|
6
|
-
max_string_length = 42
|
|
7
|
-
max_number_nodes = 1000
|
|
8
|
-
|
|
9
9
|
type_to_node = { }
|
|
10
10
|
|
|
11
11
|
type_to_color = { }
|
|
@@ -11,6 +11,12 @@ import memory_graph.utils as utils
|
|
|
11
11
|
|
|
12
12
|
import types
|
|
13
13
|
|
|
14
|
+
""" The maxium number of Nodes shown in the graph. When the graph gets too big set this to a smaller number to analyze the problem. A `★` symbol indictes where the gra[h is cut short. """
|
|
15
|
+
config.max_number_nodes = 1000
|
|
16
|
+
|
|
17
|
+
""" The maximum length of strings shown in the graph. Longer strings will be truncated. """
|
|
18
|
+
config.max_string_length = 42
|
|
19
|
+
|
|
14
20
|
""" Types that by default will not have references pointing to them in the graph but instead will be visualized in the node of their parent. """
|
|
15
21
|
config.no_reference_types = {
|
|
16
22
|
type(None) : lambda d: "None", # so None can be used to indicate no value
|
|
@@ -26,9 +32,6 @@ config.no_reference_types = {
|
|
|
26
32
|
""" Types that will not have references pointing to their children in the graph but instead will have their children visualized in their node. """
|
|
27
33
|
config.no_child_references_types = {dict, types.MappingProxyType}
|
|
28
34
|
|
|
29
|
-
config.max_string_length = 42
|
|
30
|
-
config.max_number_nodes = 1000
|
|
31
|
-
|
|
32
35
|
""" Conversion from type to Node objects. """
|
|
33
36
|
config.type_to_node = {
|
|
34
37
|
str: lambda data: Node(data), # visit as whole string, don't iterate over characters
|
|
@@ -1,7 +1,7 @@
|
|
|
1
1
|
Metadata-Version: 2.1
|
|
2
2
|
Name: memory-graph
|
|
3
|
-
Version: 0.2.
|
|
4
|
-
Summary: Draws a graph of your data to analyze
|
|
3
|
+
Version: 0.2.1
|
|
4
|
+
Summary: Draws a graph of your data to analyze its structure.
|
|
5
5
|
Home-page: https://github.com/bterwijn/memory_graph
|
|
6
6
|
Author: Bas Terwijn
|
|
7
7
|
Author-email: bterwijn@gmail.com
|
|
@@ -38,16 +38,16 @@ a = [4, 3, 2]
|
|
|
38
38
|
b = a
|
|
39
39
|
a.append(1) # changing 'a' changes 'b'
|
|
40
40
|
|
|
41
|
-
# print the
|
|
41
|
+
# print the 'a' and 'b' list
|
|
42
42
|
print('a:', a)
|
|
43
43
|
print('b:', b)
|
|
44
44
|
|
|
45
|
-
# check if
|
|
45
|
+
# check if 'a' and 'b' share data
|
|
46
46
|
print('ids:', id(a), id(b))
|
|
47
47
|
print('identical?:', a is b)
|
|
48
48
|
|
|
49
|
-
# show
|
|
50
|
-
memory_graph.show(locals())
|
|
49
|
+
# show all local variables in a graph
|
|
50
|
+
memory_graph.show( locals() )
|
|
51
51
|
```
|
|
52
52
|
|
|
53
53
|
</td><td>
|
|
@@ -65,21 +65,26 @@ b: 4, 3, 2, 1
|
|
|
65
65
|
ids: 126432214913216 126432214913216
|
|
66
66
|
identical?: True
|
|
67
67
|
```
|
|
68
|
-
A better way to understand what data is shared is to draw a graph of the data using
|
|
68
|
+
A better way to understand what data is shared is to draw a graph of the data using the [memory_graph](https://pypi.org/project/memory-graph/) package.
|
|
69
69
|
|
|
70
70
|
# Memory Graph Packge #
|
|
71
|
-
The [memory_graph](https://pypi.org/project/memory-graph/) package can
|
|
71
|
+
The [memory_graph](https://pypi.org/project/memory-graph/) package can graph many different data types.
|
|
72
72
|
|
|
73
73
|
```python
|
|
74
74
|
import memory_graph
|
|
75
75
|
|
|
76
|
-
|
|
76
|
+
class MyClass:
|
|
77
|
+
|
|
78
|
+
def __init__(self, x, y):
|
|
79
|
+
self.x = x
|
|
80
|
+
self.y = y
|
|
81
|
+
|
|
82
|
+
data = [ range(1, 2), (3, 4), {5, 6}, {7:'seven', 8:'eight'}, MyClass(9, 10) ]
|
|
77
83
|
memory_graph.show(data, block=True)
|
|
78
84
|
```
|
|
79
|
-
|
|
80
85
|

|
|
81
86
|
|
|
82
|
-
By using `block=True` the program blocks until the ENTER key is pressed so you can view the graph before continuing program execution (and possibly viewing later graphs). Instead of showing the graph you can also render it to an output file of
|
|
87
|
+
By using `block=True` the program blocks until the ENTER key is pressed so you can view the graph before continuing program execution (and possibly viewing later graphs). Instead of showing the graph you can also render it to an output file of your choosing (see [Graphviz Output Formats](https://graphviz.org/docs/outputs/)) using for example:
|
|
83
88
|
|
|
84
89
|
```python
|
|
85
90
|
memory_graph.render(data, "my_graph.pdf")
|
|
@@ -458,18 +463,18 @@ for i in range(n):
|
|
|
458
463
|
## 5. Configuration ##
|
|
459
464
|
Different aspects of memory_graph can be configured. The default configuration is reset by importing 'memory_graph.config_default'.
|
|
460
465
|
|
|
466
|
+
- ***memory_graph.config.max_number_nodes*** : int
|
|
467
|
+
- The maxium number of Nodes shown in the graph. When the graph gets too big set this to a smaller number. A `★` symbol indictes where the graph is cut short.
|
|
468
|
+
|
|
469
|
+
- ***memory_graph.config.max_string_length*** : int
|
|
470
|
+
- The maximum length of strings shown in the graph. Longer strings will be truncated.
|
|
471
|
+
|
|
461
472
|
- ***memory_graph.config.no_reference_types*** : dict
|
|
462
|
-
- Holds all types for which no seperate node
|
|
473
|
+
- Holds all types for which no seperate node is drawn but that instead are shown as elements in their parent Node. It maps each type to a function that determines how it is visualized.
|
|
463
474
|
|
|
464
475
|
- ***memory_graph.config.no_child_references_types*** : set
|
|
465
476
|
- The set of key_value types that don't draw references to their direct childeren but have their children shown as elements of their node.
|
|
466
477
|
|
|
467
|
-
- ***memory_graph.config.max_string_length*** : int
|
|
468
|
-
- The maximum length of strings shown in the graph.
|
|
469
|
-
|
|
470
|
-
- ***memory_graph.config.max_number_nodes*** : int
|
|
471
|
-
- The maxium number of Nodes shows in the graph. When the graph gets to big set this to a small number to analyze the problem.
|
|
472
|
-
|
|
473
478
|
- ***memory_graph.config.type_to_node*** : dict
|
|
474
479
|
- Determines how a data types is converted to a Node (sub)class for visualization in the graph.
|
|
475
480
|
|
|
@@ -18,6 +18,7 @@ memory_graph/config_default.py
|
|
|
18
18
|
memory_graph/config_helpers.py
|
|
19
19
|
memory_graph/extension_numpy.py
|
|
20
20
|
memory_graph/extension_pandas.py
|
|
21
|
+
memory_graph/special_types.py
|
|
21
22
|
memory_graph/test.py
|
|
22
23
|
memory_graph/test_memory_graph.py
|
|
23
24
|
memory_graph/test_memory_visitor.py
|
|
@@ -7,8 +7,8 @@ long_description_from_readme = (this_directory / "README.md").read_text()
|
|
|
7
7
|
|
|
8
8
|
setup(
|
|
9
9
|
name = 'memory_graph',
|
|
10
|
-
version = '0.2.
|
|
11
|
-
description = 'Draws a graph of your data to analyze
|
|
10
|
+
version = '0.2.01',
|
|
11
|
+
description = 'Draws a graph of your data to analyze its structure.',
|
|
12
12
|
long_description = long_description_from_readme,
|
|
13
13
|
long_description_content_type = 'text/markdown',
|
|
14
14
|
readme = 'README.md',
|
|
File without changes
|
|
File without changes
|
|
File without changes
|
|
File without changes
|
|
File without changes
|
|
File without changes
|
|
File without changes
|
|
File without changes
|
|
File without changes
|
|
File without changes
|
|
File without changes
|
|
File without changes
|
|
File without changes
|
|
File without changes
|
|
File without changes
|
|
File without changes
|
|
File without changes
|
|
File without changes
|
|
File without changes
|
|
File without changes
|