memory-graph 0.1.27__tar.gz → 0.2.0__tar.gz
This diff represents the content of publicly available package versions that have been released to one of the supported registries. The information contained in this diff is provided for informational purposes only and reflects changes between package versions as they appear in their respective public registries.
- memory_graph-0.2.0/PKG-INFO +555 -0
- memory_graph-0.2.0/README.md +534 -0
- memory_graph-0.2.0/memory_graph/HTML_Table.py +133 -0
- memory_graph-0.2.0/memory_graph/Memory_Graph.py +76 -0
- memory_graph-0.2.0/memory_graph/Memory_Visitor.py +82 -0
- memory_graph-0.2.0/memory_graph/Node.py +111 -0
- memory_graph-0.2.0/memory_graph/Node_Hidden.py +26 -0
- memory_graph-0.2.0/memory_graph/Node_Key_Value.py +93 -0
- memory_graph-0.2.0/memory_graph/Node_Linear.py +66 -0
- memory_graph-0.2.0/memory_graph/Node_Table.py +84 -0
- memory_graph-0.2.0/memory_graph/Sliced.py +111 -0
- memory_graph-0.2.0/memory_graph/Slicer.py +169 -0
- memory_graph-0.2.0/memory_graph/__init__.py +148 -0
- memory_graph-0.2.0/memory_graph/config.py +15 -0
- memory_graph-0.2.0/memory_graph/config_default.py +80 -0
- memory_graph-0.2.0/memory_graph/config_helpers.py +70 -0
- memory_graph-0.2.0/memory_graph/extension_numpy.py +44 -0
- memory_graph-0.2.0/memory_graph/extension_pandas.py +22 -0
- memory_graph-0.2.0/memory_graph/test.py +178 -0
- memory_graph-0.2.0/memory_graph/test_memory_graph.py +14 -0
- memory_graph-0.2.0/memory_graph/test_memory_visitor.py +10 -0
- memory_graph-0.2.0/memory_graph/utils.py +73 -0
- memory_graph-0.2.0/memory_graph.egg-info/PKG-INFO +555 -0
- memory_graph-0.2.0/memory_graph.egg-info/SOURCES.txt +29 -0
- {memory_graph-0.1.27 → memory_graph-0.2.0}/setup.py +1 -1
- memory_graph-0.1.27/PKG-INFO +0 -525
- memory_graph-0.1.27/README.md +0 -504
- memory_graph-0.1.27/memory_graph/Node.py +0 -85
- memory_graph-0.1.27/memory_graph/__init__.py +0 -124
- memory_graph-0.1.27/memory_graph/graphviz_nodes.py +0 -199
- memory_graph-0.1.27/memory_graph/rewrite.py +0 -148
- memory_graph-0.1.27/memory_graph/rewrite_to_node.py +0 -37
- memory_graph-0.1.27/memory_graph/rewrite_to_string.py +0 -26
- memory_graph-0.1.27/memory_graph.egg-info/PKG-INFO +0 -525
- memory_graph-0.1.27/memory_graph.egg-info/SOURCES.txt +0 -15
- {memory_graph-0.1.27 → memory_graph-0.2.0}/LICENSE.txt +0 -0
- {memory_graph-0.1.27 → memory_graph-0.2.0}/MANIFEST.in +0 -0
- {memory_graph-0.1.27 → memory_graph-0.2.0}/memory_graph.egg-info/dependency_links.txt +0 -0
- {memory_graph-0.1.27 → memory_graph-0.2.0}/memory_graph.egg-info/requires.txt +0 -0
- {memory_graph-0.1.27 → memory_graph-0.2.0}/memory_graph.egg-info/top_level.txt +0 -0
- {memory_graph-0.1.27 → memory_graph-0.2.0}/setup.cfg +0 -0
|
@@ -0,0 +1,555 @@
|
|
|
1
|
+
Metadata-Version: 2.1
|
|
2
|
+
Name: memory_graph
|
|
3
|
+
Version: 0.2.0
|
|
4
|
+
Summary: Draws a graph of your data to analyze the structure of its references.
|
|
5
|
+
Home-page: https://github.com/bterwijn/memory_graph
|
|
6
|
+
Author: Bas Terwijn
|
|
7
|
+
Author-email: bterwijn@gmail.com
|
|
8
|
+
License: BSD 2-clause
|
|
9
|
+
Platform: UNKNOWN
|
|
10
|
+
Classifier: Development Status :: 4 - Beta
|
|
11
|
+
Classifier: Intended Audience :: Education
|
|
12
|
+
Classifier: Intended Audience :: Developers
|
|
13
|
+
Classifier: License :: OSI Approved :: BSD License
|
|
14
|
+
Classifier: Programming Language :: Python :: 3
|
|
15
|
+
Classifier: Topic :: Education
|
|
16
|
+
Classifier: Topic :: Software Development :: Debuggers
|
|
17
|
+
Description-Content-Type: text/markdown
|
|
18
|
+
License-File: LICENSE.txt
|
|
19
|
+
|
|
20
|
+
# Installation #
|
|
21
|
+
Install (or upgrade) `memory_graph` using pip:
|
|
22
|
+
```
|
|
23
|
+
pip install --upgrade memory_graph
|
|
24
|
+
```
|
|
25
|
+
Additionally [Graphviz](https://graphviz.org/download/) needs to be installed.
|
|
26
|
+
|
|
27
|
+
# Sharing Data #
|
|
28
|
+
|
|
29
|
+
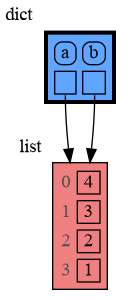
In Python, assigning the list from variable `a` to variable `b` causes both variables to reference the same list object and therefore share the data. Consequently, any change applied through one variable will impact the other. This behavior can lead to elusive bugs if a programmer incorrectly assumes that list `a` and `b` are independent.
|
|
30
|
+
|
|
31
|
+
<table><tr><td>
|
|
32
|
+
|
|
33
|
+
```python
|
|
34
|
+
import memory_graph
|
|
35
|
+
|
|
36
|
+
# create the lists 'a' and 'b'
|
|
37
|
+
a = [4, 3, 2]
|
|
38
|
+
b = a
|
|
39
|
+
a.append(1) # changing 'a' changes 'b'
|
|
40
|
+
|
|
41
|
+
# print the lists
|
|
42
|
+
print('a:', a)
|
|
43
|
+
print('b:', b)
|
|
44
|
+
|
|
45
|
+
# check if they share data
|
|
46
|
+
print('ids:', id(a), id(b))
|
|
47
|
+
print('identical?:', a is b)
|
|
48
|
+
|
|
49
|
+
# show the lists in a graph
|
|
50
|
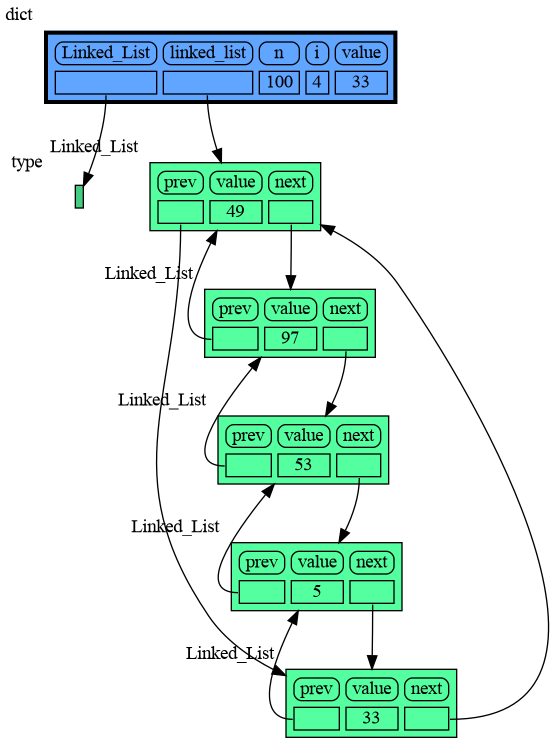
+
memory_graph.show(locals())
|
|
51
|
+
```
|
|
52
|
+
|
|
53
|
+
</td><td>
|
|
54
|
+
|
|
55
|
+
|
|
56
|
+
|
|
57
|
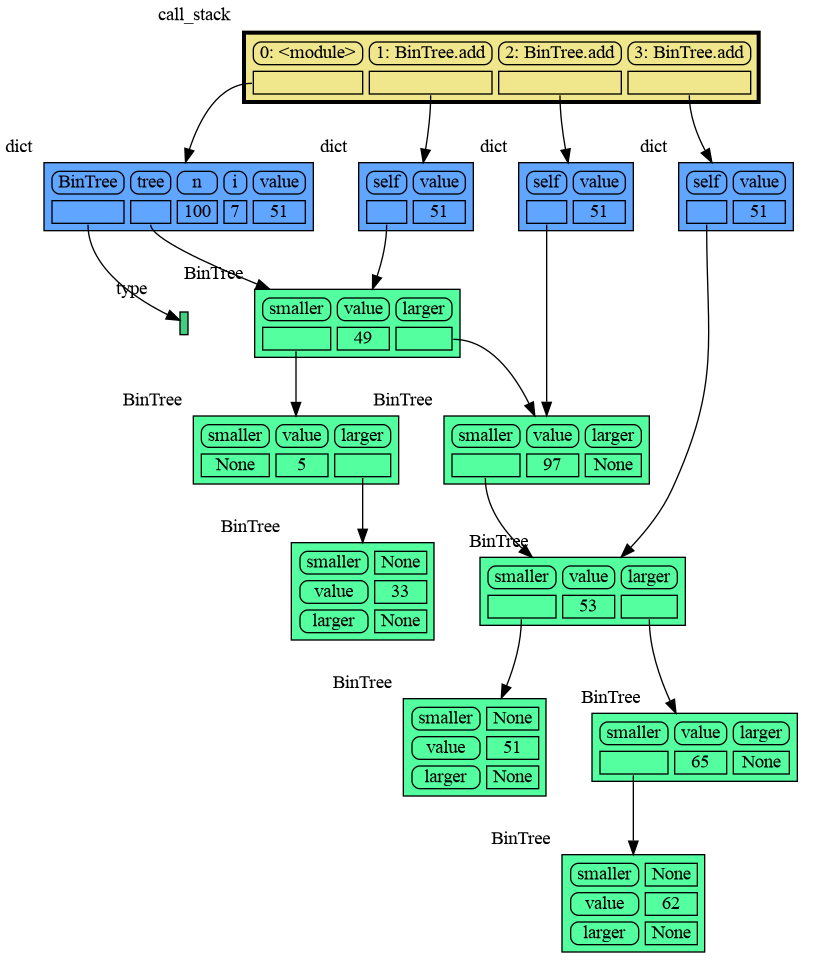
+
a graph showing `a` and `b` share data
|
|
58
|
+
|
|
59
|
+
</td></tr></table>
|
|
60
|
+
|
|
61
|
+
The fact that `a` and `b` share data can not be verified by printing the lists. It can be verified by comparing the identity of both variables using the `id()` function or by using the `is` comparison operator as shown in the program output below, but this quickly becomes impractical for larger programs.
|
|
62
|
+
```{verbatim}
|
|
63
|
+
a: 4, 3, 2, 1
|
|
64
|
+
b: 4, 3, 2, 1
|
|
65
|
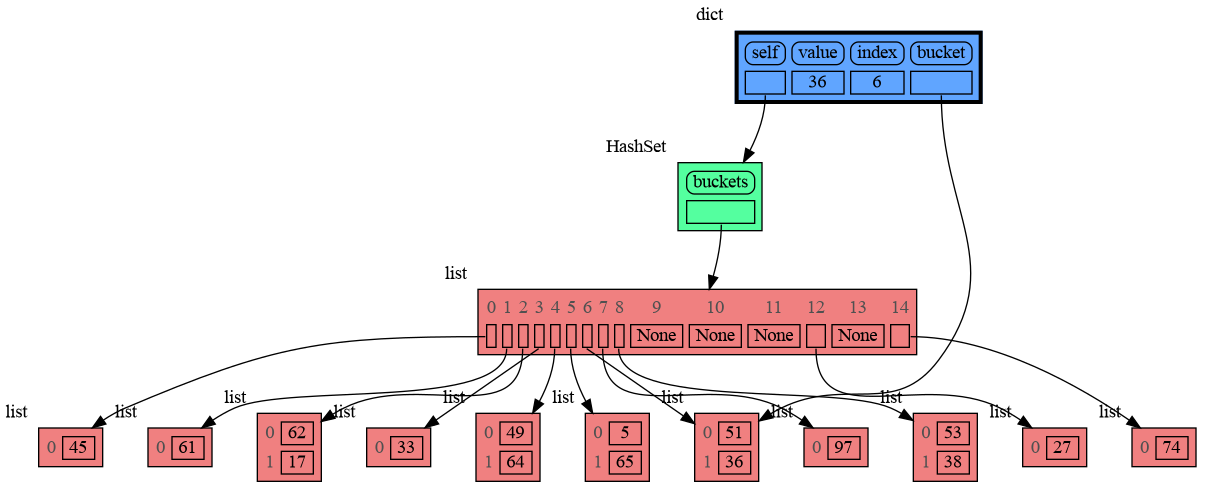
+
ids: 126432214913216 126432214913216
|
|
66
|
+
identical?: True
|
|
67
|
+
```
|
|
68
|
+
A better way to understand what data is shared is to draw a graph of the data using this [memory_graph](https://pypi.org/project/memory-graph/) package.
|
|
69
|
+
|
|
70
|
+
# Memory Graph Packge #
|
|
71
|
+
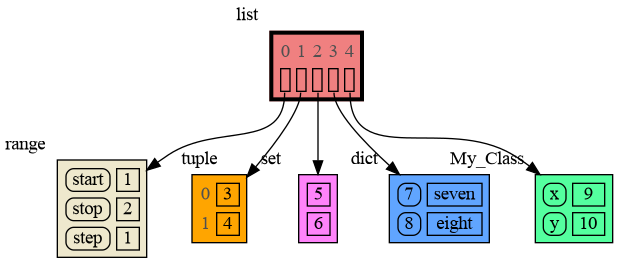
The [memory_graph](https://pypi.org/project/memory-graph/) package can show a graph with many different data types.
|
|
72
|
+
|
|
73
|
+
```python
|
|
74
|
+
import memory_graph
|
|
75
|
+
|
|
76
|
+
data = [ (1, 2), [3, 4], {5, 6}, {7:'seven', 8:'eight'} ]
|
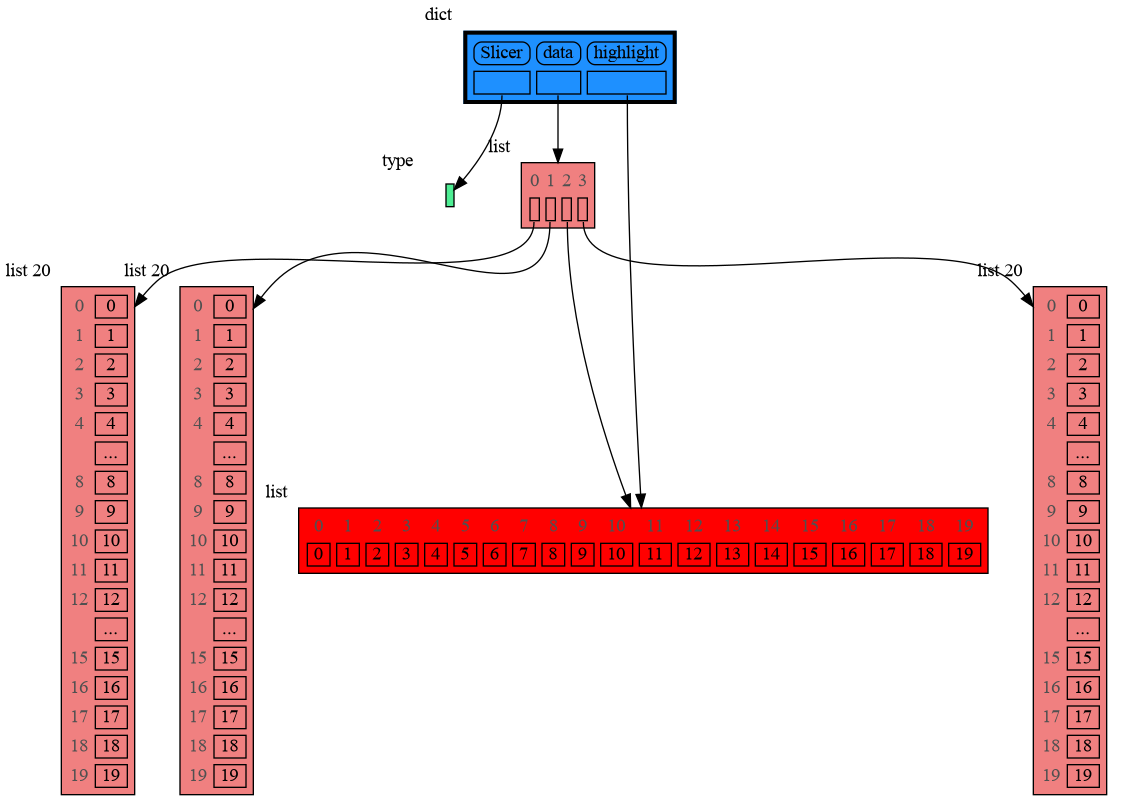
|
77
|
+
memory_graph.show(data, block=True)
|
|
78
|
+
```
|
|
79
|
+
|
|
80
|
+
|
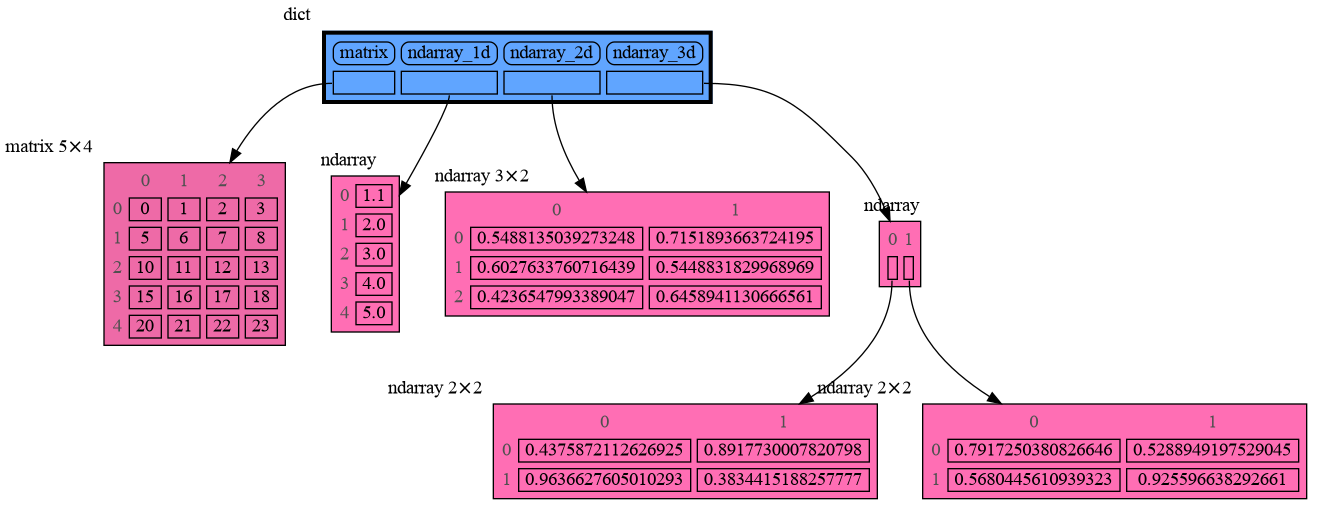
|
81
|
+
|
|
82
|
+
By using `block=True` the program blocks until the ENTER key is pressed so you can view the graph before continuing program execution (and possibly viewing later graphs). Instead of showing the graph you can also render it to an output file of our choosing (see [Graphviz Output Formats](https://graphviz.org/docs/outputs/)) using for example:
|
|
83
|
+
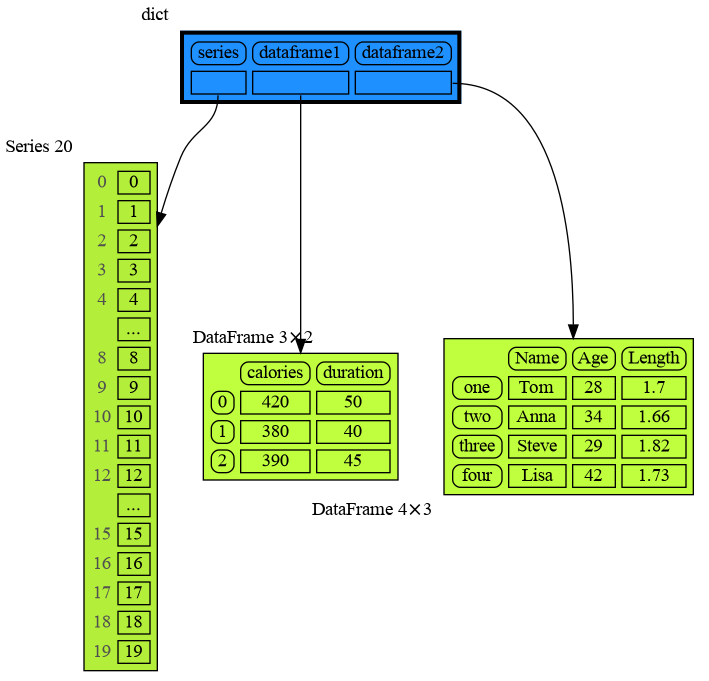
|
|
84
|
+
```python
|
|
85
|
+
memory_graph.render(data, "my_graph.pdf")
|
|
86
|
+
memory_graph.render(data, "my_graph.png")
|
|
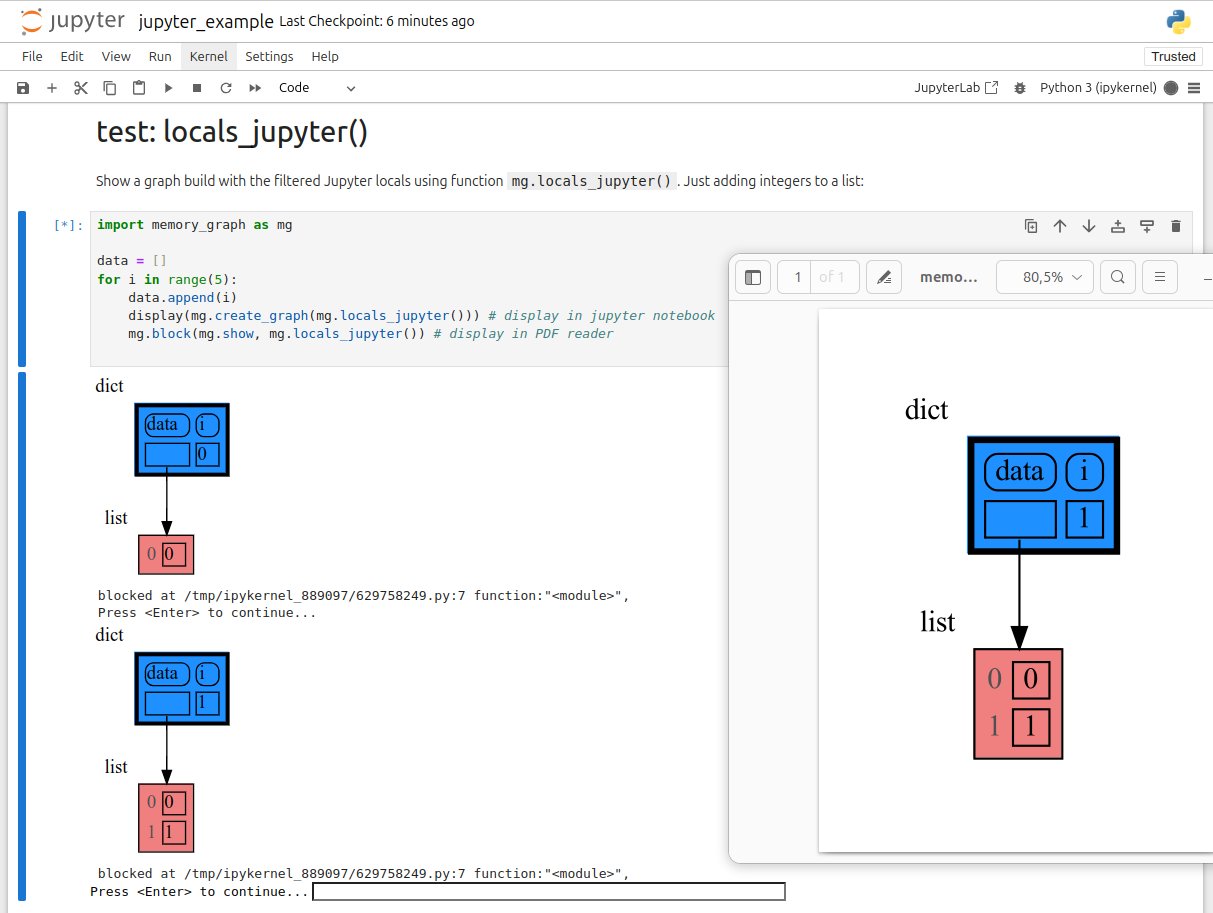
87
|
+
memory_graph.render(data, "my_graph.gv") # Graphviz DOT file
|
|
88
|
+
```
|
|
89
|
+
|
|
90
|
+
# Chapters #
|
|
91
|
+
|
|
92
|
+
[1. Python Data Model](#1-python-data-model)
|
|
93
|
+
|
|
94
|
+
[2. Debugging](#2-debugging)
|
|
95
|
+
|
|
96
|
+
[3. Call Stack](#3-call-stack)
|
|
97
|
+
|
|
98
|
+
[4. Datastructure Examples](#4-datastructure-examples)
|
|
99
|
+
|
|
100
|
+
[5. Configuration](#5-configuration)
|
|
101
|
+
|
|
102
|
+
[6. Extensions](#6-extensions)
|
|
103
|
+
|
|
104
|
+
[7. Jupyter Notebook](#7-jupyter-notebook)
|
|
105
|
+
|
|
106
|
+
[8. Troubleshooting](#8-troubleshooting)
|
|
107
|
+
|
|
108
|
+
|
|
109
|
+
## Author ##
|
|
110
|
+
Bas Terwijn
|
|
111
|
+
|
|
112
|
+
## Inspiration ##
|
|
113
|
+
Inspired by [Python Tutor](https://pythontutor.com/).
|
|
114
|
+
|
|
115
|
+
___
|
|
116
|
+
___
|
|
117
|
+
|
|
118
|
+
## 1. Python Data Model ##
|
|
119
|
+
The [Python Data Model](https://docs.python.org/3/reference/datamodel.html) makes a distiction between immutable and mutable types:
|
|
120
|
+
|
|
121
|
+
* **immutable**: bool, int, float, complex, str, tuple, bytes, frozenset
|
|
122
|
+
* **mutable**: list, dict, set, class, ... (all other types)
|
|
123
|
+
|
|
124
|
+
|
|
125
|
+
### Immutable Type ###
|
|
126
|
+
In the code below variable `a` and `b` both reference the same `int` value 10. An `int` is an immutable type and therefore when we change variable `a` its value can **not** be mutated in place, and thus a copy is made and `a` and `b` reference a different value afterwards.
|
|
127
|
+
```python
|
|
128
|
+
import memory_graph
|
|
129
|
+
memory_graph.rewrite_to_node.reduce_reference_children.remove("int") # shows references to 'int'
|
|
130
|
+
|
|
131
|
+
a = 10
|
|
132
|
+
b = a
|
|
133
|
+
memory_graph.render(locals(), 'immutable1.png')
|
|
134
|
+
a += 1
|
|
135
|
+
memory_graph.render(locals(), 'immutable2.png')
|
|
136
|
+
```
|
|
137
|
+
|  |  |
|
|
138
|
+
|:-----------------------------------------------------------:|:-------------------------------------------------------------:|
|
|
139
|
+
| immutable1.png | immutable2.png |
|
|
140
|
+
|
|
141
|
+
|
|
142
|
+
### Mutable Type ###
|
|
143
|
+
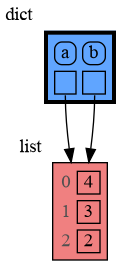
With mutable types the result is different. In the code below variable `a` and `b` both reference the same `list` value [4, 3, 2]. A `list` is a mutable type and therefore when we change variable `a` its value **can** be mutated in place and thus `a` and `b` both reference the same new value afterwards. Thus changing `a` also changes `b` and vice versa. Sometimes we want this but other times we don't and then we will have to make a copy so that `b` is independent from `a`.
|
|
144
|
+
|
|
145
|
+
```python
|
|
146
|
+
import memory_graph
|
|
147
|
+
|
|
148
|
+
a = [4, 3, 2]
|
|
149
|
+
b = a
|
|
150
|
+
memory_graph.render(locals(), 'mutable1.png')
|
|
151
|
+
a.append(1)
|
|
152
|
+
memory_graph.render(locals(), 'mutable2.png')
|
|
153
|
+
```
|
|
154
|
+
|  |  |
|
|
155
|
+
|:-----------------------------------------------------------:|:-------------------------------------------------------------:|
|
|
156
|
+
| mutable1.png | mutable2.png |
|
|
157
|
+
|
|
158
|
+
|
|
159
|
+
Python makes this distiction between mutable and immutable types because a value of a mutable type generally could be large and therefore it would be slow to make a copy each time we change it. On the other hand, a value of a changable immutable type generally is small and therefore fast to copy.
|
|
160
|
+
|
|
161
|
+
|
|
162
|
+
### Copying ###
|
|
163
|
+
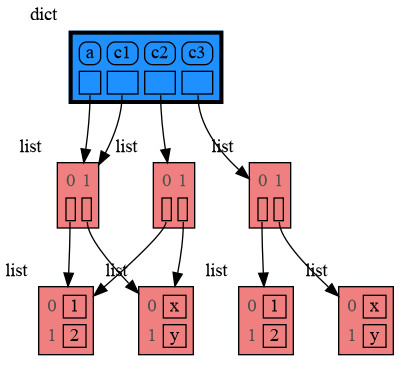
Python offers three different "copy" options that we will demonstrate using a nested list:
|
|
164
|
+
|
|
165
|
+
```python
|
|
166
|
+
import memory_graph
|
|
167
|
+
import copy
|
|
168
|
+
|
|
169
|
+
a = [ [1, 2], ['x', 'y'] ] # a nested list (a list containing lists)
|
|
170
|
+
|
|
171
|
+
# three different ways to make a "copy" of 'a':
|
|
172
|
+
c1 = a
|
|
173
|
+
c2 = copy.copy(a) # equivalent to: a.copy() a[:] list(a)
|
|
174
|
+
c3 = copy.deepcopy(a)
|
|
175
|
+
|
|
176
|
+
memory_graph.show(locals())
|
|
177
|
+
```
|
|
178
|
+
|
|
179
|
+
* `c1` is an **assignment**, all the data is shared, nothing is copied
|
|
180
|
+
* `c2` is a **shallow copy**, only the data referenced by the first reference is copied and the underlying data is shared
|
|
181
|
+
* `c3` is a **deep copy**, all the data is copied, nothing is shared
|
|
182
|
+
|
|
183
|
+
|
|
184
|
+
|
|
185
|
+
|
|
186
|
+
### Custom Copy Method ###
|
|
187
|
+
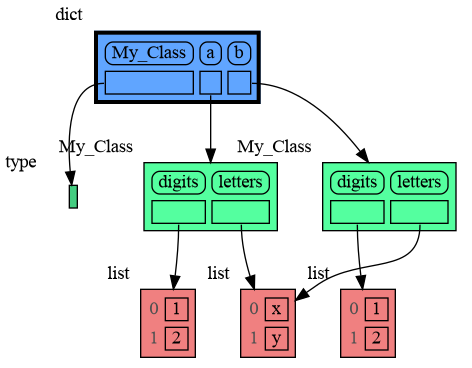
We can write our own custom copy function or method in case the three "copy" options don't do what we want. For example the copy() method of My_Class in the code below copies the `digits` but shares the `letters` between the two objects.
|
|
188
|
+
|
|
189
|
+
```python
|
|
190
|
+
import memory_graph
|
|
191
|
+
import copy
|
|
192
|
+
|
|
193
|
+
class My_Class:
|
|
194
|
+
|
|
195
|
+
def __init__(self):
|
|
196
|
+
self.digits = [1, 2]
|
|
197
|
+
self.letters = ['x', 'y']
|
|
198
|
+
|
|
199
|
+
def copy(self): # custom copy method copies the digits but shares the letters
|
|
200
|
+
c = copy.copy(self)
|
|
201
|
+
c.digits = copy.copy(self.digits)
|
|
202
|
+
return c
|
|
203
|
+
|
|
204
|
+
a = My_Class()
|
|
205
|
+
b = a.copy()
|
|
206
|
+
|
|
207
|
+
memory_graph.show(locals())
|
|
208
|
+
```
|
|
209
|
+
|
|
210
|
+
|
|
211
|
+
|
|
212
|
+
## 2. Debugging ##
|
|
213
|
+
Often it is useful to graph all the local variables using:
|
|
214
|
+
```python
|
|
215
|
+
memory_graph.show(locals(), block=True)
|
|
216
|
+
```
|
|
217
|
+
|
|
218
|
+
So much so that function `d()` is available as alias for this for easier debugging. Additionally it can optionally log the data by printing them. For example:
|
|
219
|
+
```python
|
|
220
|
+
from memory_graph import d
|
|
221
|
+
|
|
222
|
+
my_squares = []
|
|
223
|
+
my_squares_ref = my_squares
|
|
224
|
+
for i in range(5):
|
|
225
|
+
my_squares.append(i**2)
|
|
226
|
+
d(log=True)
|
|
227
|
+
my_squares_copy = my_squares.copy()
|
|
228
|
+
d(log=True)
|
|
229
|
+
```
|
|
230
|
+
which after pressing ENTER a number of times results in:
|
|
231
|
+
|
|
232
|
+

|
|
233
|
+
```
|
|
234
|
+
my_squares: [0, 1, 4, 9, 16]
|
|
235
|
+
my_squares_ref: [0, 1, 4, 9, 16]
|
|
236
|
+
i: 4
|
|
237
|
+
my_squares_copy: [0, 1, 4, 9, 16]
|
|
238
|
+
```
|
|
239
|
+
|
|
240
|
+
Function `d()` has these default arguments:
|
|
241
|
+
```python
|
|
242
|
+
def d(data=None, graph=True, log=False, block=True):
|
|
243
|
+
```
|
|
244
|
+
- data: the data that is handled, defaults to `locals()` when not specified
|
|
245
|
+
- graph: if True the data is visualized as a graph
|
|
246
|
+
- log: if True the data is printed
|
|
247
|
+
- block: if True the function blocks until the ENTER key is pressed
|
|
248
|
+
|
|
249
|
+
To print to a log file instead of standard output use:
|
|
250
|
+
```python
|
|
251
|
+
memory_graph.log_file = open("my_log_file.txt", "w")
|
|
252
|
+
```
|
|
253
|
+
|
|
254
|
+
### Watchpoint in Debugger ###
|
|
255
|
+
Alternatively you get an even better debugging experience when you set expression:
|
|
256
|
+
```
|
|
257
|
+
memory_graph.render(locals(), "my_debug_graph.pdf")
|
|
258
|
+
```
|
|
259
|
+
as a *watchpoint* in a debugger tool and open the "my_debug_graph.pdf" output file. This continuouly shows the graph of all the local variables while debugging and avoids having to add any memory_graph `show()`, `render()`, or `d()` calls to your code.
|
|
260
|
+
|
|
261
|
+
|
|
262
|
+
## 3. Call Stack ##
|
|
263
|
+
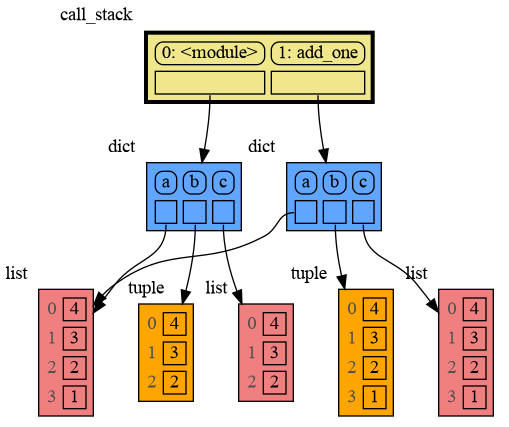
Function ```memory_graph.get_call_stack()``` returns the full call stack that holds for each called function all the local variables. This enables us to visualize the local variables of each of the called functions simultaneously. This helps to visualize if variables of different called functions share any data between them. Here for example we call function ```add_one()``` with arguments ```a, b, c``` that adds one to change each of its arguments.
|
|
264
|
+
|
|
265
|
+
```python
|
|
266
|
+
import memory_graph
|
|
267
|
+
|
|
268
|
+
def add_one(a, b, c):
|
|
269
|
+
a += 1
|
|
270
|
+
b.append(1)
|
|
271
|
+
c.append(1)
|
|
272
|
+
memory_graph.show(memory_graph.get_call_stack())
|
|
273
|
+
|
|
274
|
+
a = 10
|
|
275
|
+
b = [4, 3, 2]
|
|
276
|
+
c = [4, 3, 2]
|
|
277
|
+
|
|
278
|
+
add_one(a, b, c.copy())
|
|
279
|
+
print(f"a:{a} b:{b} c:{c}")
|
|
280
|
+
```
|
|
281
|
+
|
|
282
|
+
|
|
283
|
+
As `a` is of immutable type 'int' and as we call the function with a copy of `c`, only `b` is shared so only `b` is changed in the calling stack frame as reflected in the printed output:
|
|
284
|
+
```
|
|
285
|
+
a:0 b:[4, 3, 2, 1] c:[4, 3, 2]
|
|
286
|
+
```
|
|
287
|
+
|
|
288
|
+
### Recursion ###
|
|
289
|
+
The call stack also helps to visualize how recursion works. Here we show each step of how recursively ```factorial(3)``` is computed:
|
|
290
|
+
|
|
291
|
+
```python
|
|
292
|
+
import memory_graph
|
|
293
|
+
|
|
294
|
+
def factorial(n):
|
|
295
|
+
if n==0:
|
|
296
|
+
return 1
|
|
297
|
+
memory_graph.show( memory_graph.get_call_stack(), block=True )
|
|
298
|
+
result = n * factorial(n-1)
|
|
299
|
+
memory_graph.show( memory_graph.get_call_stack(), block=True )
|
|
300
|
+
return result
|
|
301
|
+
|
|
302
|
+
factorial(3)
|
|
303
|
+
```
|
|
304
|
+
<div><img src="https://raw.githubusercontent.com/bterwijn/memory_graph/main/images/factorial1.png" /></div>
|
|
305
|
+
<div><img src="https://raw.githubusercontent.com/bterwijn/memory_graph/main/images/factorial2.png" /></div>
|
|
306
|
+
<div><img src="https://raw.githubusercontent.com/bterwijn/memory_graph/main/images/factorial3.png" /></div>
|
|
307
|
+
<div><img src="https://raw.githubusercontent.com/bterwijn/memory_graph/main/images/factorial4.png" /></div>
|
|
308
|
+
<div><img src="https://raw.githubusercontent.com/bterwijn/memory_graph/main/images/factorial5.png" /></div>
|
|
309
|
+
<div><img src="https://raw.githubusercontent.com/bterwijn/memory_graph/main/images/factorial6.png" /></div>
|
|
310
|
+
and the final result is: 1 x 2 x 3 = 6
|
|
311
|
+
|
|
312
|
+
### Call Stack in Watchpoint ###
|
|
313
|
+
The ```memory_graph.get_call_stack()``` doesn't work well in a watchpoint context in most debuggers because debuggers introduce additional stack frames that cause problems. Use these alternative functions for various debuggers to filter out these problematic stack frames:
|
|
314
|
+
|
|
315
|
+
| debugger | function to get the call stack |
|
|
316
|
+
|:---|:---|
|
|
317
|
+
| **pdb, pudb** | `memory_graph.get_call_stack_pdb()` |
|
|
318
|
+
| **Visual Studio Code** | `memory_graph.get_call_stack_vscode()` |
|
|
319
|
+
| **Pycharm** | `memory_graph.get_call_stack_pycharm()` |
|
|
320
|
+
|
|
321
|
+
#### Other Debuggers ####
|
|
322
|
+
For other debuggers, invoke this function within the watchpoint context. Then, in the "call_stack.txt" file, identify the slice of functions you wish to include in the call stack, more specifically choise 'after' and 'up_to' what function you want to slice.
|
|
323
|
+
```
|
|
324
|
+
memory_graph.save_call_stack("call_stack.txt")
|
|
325
|
+
```
|
|
326
|
+
and then call this function to get the desired call stack to show in the graph:
|
|
327
|
+
```
|
|
328
|
+
memory_graph.get_call_stack_after_up_to(after_function, up_to_function="<module>")
|
|
329
|
+
```
|
|
330
|
+
|
|
331
|
+
|
|
332
|
+
## 4. Datastructure Examples ##
|
|
333
|
+
Module memory_graph can be very useful in a course about datastructures, some examples:
|
|
334
|
+
|
|
335
|
+
### Doubly Linked List ###
|
|
336
|
+
```python
|
|
337
|
+
from memory_graph import d
|
|
338
|
+
import random
|
|
339
|
+
random.seed(0) # use same random numbers each run
|
|
340
|
+
|
|
341
|
+
class Node:
|
|
342
|
+
|
|
343
|
+
def __init__(self, value):
|
|
344
|
+
self.prev = None
|
|
345
|
+
self.value = value
|
|
346
|
+
self.next = None
|
|
347
|
+
|
|
348
|
+
class LinkedList:
|
|
349
|
+
|
|
350
|
+
def __init__(self):
|
|
351
|
+
self.head = None
|
|
352
|
+
self.tail = None
|
|
353
|
+
|
|
354
|
+
def add_front(self, value):
|
|
355
|
+
new_node = Node(value)
|
|
356
|
+
if self.head is None:
|
|
357
|
+
self.head = new_node
|
|
358
|
+
self.tail = new_node
|
|
359
|
+
else:
|
|
360
|
+
new_node.next = self.head
|
|
361
|
+
self.head.prev = new_node
|
|
362
|
+
self.head = new_node
|
|
363
|
+
|
|
364
|
+
linked_list = LinkedList()
|
|
365
|
+
n = 100
|
|
366
|
+
for i in range(n):
|
|
367
|
+
new_value = random.randrange(n)
|
|
368
|
+
linked_list.add_front(new_value)
|
|
369
|
+
d() # <--- draw linked list
|
|
370
|
+
```
|
|
371
|
+
|
|
372
|
+
|
|
373
|
+
### Binary Tree ###
|
|
374
|
+
```python
|
|
375
|
+
from memory_graph import d
|
|
376
|
+
import random
|
|
377
|
+
random.seed(0) # use same random numbers each run
|
|
378
|
+
|
|
379
|
+
class Node:
|
|
380
|
+
|
|
381
|
+
def __init__(self, value):
|
|
382
|
+
self.smaller = None
|
|
383
|
+
self.value = value
|
|
384
|
+
self.larger = None
|
|
385
|
+
|
|
386
|
+
class BinTree:
|
|
387
|
+
|
|
388
|
+
def __init__(self):
|
|
389
|
+
self.root = None
|
|
390
|
+
|
|
391
|
+
def add_recursive(self, new_value, node):
|
|
392
|
+
d() # <--- draw tree when adding recursively
|
|
393
|
+
if new_value < node.value:
|
|
394
|
+
if node.smaller is None:
|
|
395
|
+
node.smaller = Node(new_value)
|
|
396
|
+
else:
|
|
397
|
+
self.add_recursive(new_value, node.smaller)
|
|
398
|
+
else:
|
|
399
|
+
if node.larger is None:
|
|
400
|
+
node.larger = Node(new_value)
|
|
401
|
+
else:
|
|
402
|
+
self.add_recursive(new_value, node.larger)
|
|
403
|
+
|
|
404
|
+
def add(self, value):
|
|
405
|
+
if self.root is None:
|
|
406
|
+
self.root = Node(value)
|
|
407
|
+
else:
|
|
408
|
+
self.add_recursive(value, self.root)
|
|
409
|
+
|
|
410
|
+
tree = BinTree()
|
|
411
|
+
n = 100
|
|
412
|
+
for i in range(n):
|
|
413
|
+
new_value = random.randrange(100)
|
|
414
|
+
tree.add(new_value)
|
|
415
|
+
d() # <--- draw tree after adding
|
|
416
|
+
```
|
|
417
|
+
|
|
418
|
+
|
|
419
|
+
### Hash Set ###
|
|
420
|
+
```python
|
|
421
|
+
from memory_graph import d
|
|
422
|
+
import random
|
|
423
|
+
random.seed(0) # use same random numbers each run
|
|
424
|
+
|
|
425
|
+
class HashSet:
|
|
426
|
+
|
|
427
|
+
def __init__(self, capacity=20):
|
|
428
|
+
self.buckets = [None] * capacity
|
|
429
|
+
|
|
430
|
+
def add(self, value):
|
|
431
|
+
index = hash(value) % len(self.buckets)
|
|
432
|
+
if self.buckets[index] is None:
|
|
433
|
+
self.buckets[index] = [value]
|
|
434
|
+
else:
|
|
435
|
+
self.buckets[index].append(value)
|
|
436
|
+
|
|
437
|
+
def contains(self, value):
|
|
438
|
+
index = hash(value) % len(self.buckets)
|
|
439
|
+
if self.buckets[index] is None:
|
|
440
|
+
return False
|
|
441
|
+
return value in self.buckets[index]
|
|
442
|
+
|
|
443
|
+
def remove(self, value):
|
|
444
|
+
index = hash(value) % len(self.buckets)
|
|
445
|
+
if self.buckets[index] is not None:
|
|
446
|
+
self.buckets[index].remove(value)
|
|
447
|
+
|
|
448
|
+
hash_set = HashSet()
|
|
449
|
+
n = 100
|
|
450
|
+
for i in range(n):
|
|
451
|
+
new_value = random.randrange(n)
|
|
452
|
+
hash_set.add(new_value)
|
|
453
|
+
d() # <--- draw hash set
|
|
454
|
+
```
|
|
455
|
+
|
|
456
|
+
|
|
457
|
+
|
|
458
|
+
## 5. Configuration ##
|
|
459
|
+
Different aspects of memory_graph can be configured. The default configuration is reset by importing 'memory_graph.config_default'.
|
|
460
|
+
|
|
461
|
+
- ***memory_graph.config.no_reference_types*** : dict
|
|
462
|
+
- Holds all types for which no seperate node it drawn but that are shown as elements in their parent Node. It maps each type to a function that determines how it is visualized.
|
|
463
|
+
|
|
464
|
+
- ***memory_graph.config.no_child_references_types*** : set
|
|
465
|
+
- The set of key_value types that don't draw references to their direct childeren but have their children shown as elements of their node.
|
|
466
|
+
|
|
467
|
+
- ***memory_graph.config.max_string_length*** : int
|
|
468
|
+
- The maximum length of strings shown in the graph.
|
|
469
|
+
|
|
470
|
+
- ***memory_graph.config.max_number_nodes*** : int
|
|
471
|
+
- The maxium number of Nodes shows in the graph. When the graph gets to big set this to a small number to analyze the problem.
|
|
472
|
+
|
|
473
|
+
- ***memory_graph.config.type_to_node*** : dict
|
|
474
|
+
- Determines how a data types is converted to a Node (sub)class for visualization in the graph.
|
|
475
|
+
|
|
476
|
+
- ***memory_graph.config.type_to_color*** : dict
|
|
477
|
+
- Maps each type to the [graphviz color](https://graphviz.org/doc/info/colors.html) it gets in the graph.
|
|
478
|
+
|
|
479
|
+
- ***memory_graph.config.type_to_vertical_orientation*** : dict
|
|
480
|
+
- Maps each type to its orientation. Use 'True' for vertical and 'False' for horizontal. If not specified Node_Linear and Node_Key_Value are vertical unless they have references to children.
|
|
481
|
+
|
|
482
|
+
- ***memory_graph.config.type_to_slicer*** : dict
|
|
483
|
+
- Maps each type to a Slicer. A slicer determines how many elements of a data type are shown in the graph to prevent the graph from getting too big. 'Slicer()' does no slicing, 'Slicer(1,2,3)' shows just 1 element at the beginning, 2 in the middle, and 3 at the end.
|
|
484
|
+
|
|
485
|
+
### Temporary Configuration ###
|
|
486
|
+
In addition to the global configuration, a temporary configuration can be set for a single `show()`, `render()`, or `d()` call to change the colors, orientation, and slicer. This example highlights a particular list element in red, gives it a horizontal orientattion, and overwrites the default slicer for lists:
|
|
487
|
+
|
|
488
|
+
```python
|
|
489
|
+
import memory_graph
|
|
490
|
+
from memory_graph.Slicer import Slicer
|
|
491
|
+
|
|
492
|
+
data = [ list(range(20)) for i in range(1,5)]
|
|
493
|
+
highlight = data[2]
|
|
494
|
+
|
|
495
|
+
memory_graph.show( locals(),
|
|
496
|
+
colors = {id(highlight): "red" }, # set color to "red"
|
|
497
|
+
vertical_orientations = {id(highlight): False }, # set horizontal orientation
|
|
498
|
+
slicers = {id(highlight): Slicer()} # set no slicing
|
|
499
|
+
)
|
|
500
|
+
```
|
|
501
|
+
|
|
502
|
+
|
|
503
|
+
## 6. Extensions ##
|
|
504
|
+
Different extension are available for types from Python packages.
|
|
505
|
+
|
|
506
|
+
### Numpy ###
|
|
507
|
+
Numpy types `arrray` and `matrix` and `ndarray` can be graphed with the "memory_graph.extension_numpy" extension:
|
|
508
|
+
|
|
509
|
+
```python
|
|
510
|
+
from memory_graph import d
|
|
511
|
+
import numpy as np
|
|
512
|
+
import memory_graph.extension_numpy
|
|
513
|
+
|
|
514
|
+
array = np.array([1.1, 2, 3, 4, 5])
|
|
515
|
+
matrix = np.matrix([[i*20+j for j in range(20)] for i in range(20)])
|
|
516
|
+
ndarray = np.random.rand(20,20)
|
|
517
|
+
d()
|
|
518
|
+
```
|
|
519
|
+
|
|
520
|
+
|
|
521
|
+
### Pandas ###
|
|
522
|
+
Pandas types `Series` and `DataFrame` can be graphed with the "memory_graph.extension_pandas" extension:
|
|
523
|
+
|
|
524
|
+
```python
|
|
525
|
+
from memory_graph import d
|
|
526
|
+
import pandas as pd
|
|
527
|
+
import memory_graph.extension_pandas
|
|
528
|
+
|
|
529
|
+
series = pd.Series( [i for i in range(20)] )
|
|
530
|
+
dataframe1 = pd.DataFrame({ "calories": [420, 380, 390],
|
|
531
|
+
"duration": [50, 40, 45] })
|
|
532
|
+
dataframe2 = pd.DataFrame({ 'Name' : [ 'Tom', 'Anna', 'Steve', 'Lisa'],
|
|
533
|
+
'Age' : [ 28, 34, 29, 42],
|
|
534
|
+
'Length' : [ 1.70, 1.66, 1.82, 1.73] },
|
|
535
|
+
index=['one', 'two', 'three', 'four']) # with row names
|
|
536
|
+
d()
|
|
537
|
+
```
|
|
538
|
+
|
|
539
|
+
|
|
540
|
+
## 7. Jupyter Notebook ##
|
|
541
|
+
|
|
542
|
+
In Jupyter Notebook `locals()` has additional variables that cause problems in the graph, use `memory_graph.locals_jupyter()` to get the local variables with these problematic variables filtered out. Use `memory_graph.get_call_stack_jupyter()` to get the whole call stack with these variables filtered out.
|
|
543
|
+
|
|
544
|
+
See for example [jupyter_example.ipynb](https://raw.githubusercontent.com/bterwijn/memory_graph/main/images/jupyter_example.ipynb).
|
|
545
|
+
|
|
546
|
+
|
|
547
|
+
|
|
548
|
+
## 8. Troubleshooting ##
|
|
549
|
+
|
|
550
|
+
- Adobe Acrobat Reader [doesn't refresh a PDF file](https://superuser.com/questions/337011/windows-pdf-viewer-that-auto-refreshes-pdf-when-compiling-with-pdflatex) when it changes on disk and blocks updates which results in an `Could not open 'somefile.pdf' for writing : Permission denied` error. One solution is to install a PDF reader that does refresh ([Evince](https://www.fosshub.com/Evince.html) for example) and set it as the default PDF reader. Another solution is to `render()` the graph to a different output format and open it manually.
|
|
551
|
+
|
|
552
|
+
- When graph edges overlap it can be hard to distinguish them. Using an interactive graphviz viewer, such as [xdot](https://github.com/jrfonseca/xdot.py), on a '*.gv' DOT output file will help.
|
|
553
|
+
|
|
554
|
+
|
|
555
|
+
|