mdsview 0.2.0__tar.gz
This diff represents the content of publicly available package versions that have been released to one of the supported registries. The information contained in this diff is provided for informational purposes only and reflects changes between package versions as they appear in their respective public registries.
- mdsview-0.2.0/LICENSE +21 -0
- mdsview-0.2.0/PKG-INFO +248 -0
- mdsview-0.2.0/README.md +210 -0
- mdsview-0.2.0/mdsview/__init__.py +3 -0
- mdsview-0.2.0/mdsview/animation.py +154 -0
- mdsview-0.2.0/mdsview/assets/logo.png +0 -0
- mdsview-0.2.0/mdsview/catalog.py +98 -0
- mdsview-0.2.0/mdsview/cli.py +521 -0
- mdsview-0.2.0/mdsview/cli_help.py +93 -0
- mdsview-0.2.0/mdsview/colormaps.py +87 -0
- mdsview-0.2.0/mdsview/errors.py +25 -0
- mdsview-0.2.0/mdsview/grid.py +299 -0
- mdsview-0.2.0/mdsview/gui.py +1773 -0
- mdsview-0.2.0/mdsview/gui_theme.py +215 -0
- mdsview-0.2.0/mdsview/io.py +147 -0
- mdsview-0.2.0/mdsview/meta.py +92 -0
- mdsview-0.2.0/mdsview/ops.py +341 -0
- mdsview-0.2.0/mdsview/plotting.py +347 -0
- mdsview-0.2.0/mdsview/samples/__init__.py +1 -0
- mdsview-0.2.0/mdsview/samples/generate.py +477 -0
- mdsview-0.2.0/mdsview/slices.py +46 -0
- mdsview-0.2.0/mdsview/validate.py +54 -0
- mdsview-0.2.0/mdsview.egg-info/PKG-INFO +248 -0
- mdsview-0.2.0/mdsview.egg-info/SOURCES.txt +33 -0
- mdsview-0.2.0/mdsview.egg-info/dependency_links.txt +1 -0
- mdsview-0.2.0/mdsview.egg-info/entry_points.txt +2 -0
- mdsview-0.2.0/mdsview.egg-info/requires.txt +15 -0
- mdsview-0.2.0/mdsview.egg-info/top_level.txt +1 -0
- mdsview-0.2.0/pyproject.toml +54 -0
- mdsview-0.2.0/setup.cfg +4 -0
- mdsview-0.2.0/tests/test_catalog.py +52 -0
- mdsview-0.2.0/tests/test_cli.py +83 -0
- mdsview-0.2.0/tests/test_grid.py +64 -0
- mdsview-0.2.0/tests/test_plot_titles.py +35 -0
- mdsview-0.2.0/tests/test_sample_workflow.py +102 -0
mdsview-0.2.0/LICENSE
ADDED
|
@@ -0,0 +1,21 @@
|
|
|
1
|
+
MIT License
|
|
2
|
+
|
|
3
|
+
Copyright (c) 2026 Rhett R. Adam
|
|
4
|
+
|
|
5
|
+
Permission is hereby granted, free of charge, to any person obtaining a copy
|
|
6
|
+
of this software and associated documentation files (the "Software"), to deal
|
|
7
|
+
in the Software without restriction, including without limitation the rights
|
|
8
|
+
to use, copy, modify, merge, publish, distribute, sublicense, and/or sell
|
|
9
|
+
copies of the Software, and to permit persons to whom the Software is
|
|
10
|
+
furnished to do so, subject to the following conditions:
|
|
11
|
+
|
|
12
|
+
The above copyright notice and this permission notice shall be included in all
|
|
13
|
+
copies or substantial portions of the Software.
|
|
14
|
+
|
|
15
|
+
THE SOFTWARE IS PROVIDED "AS IS", WITHOUT WARRANTY OF ANY KIND, EXPRESS OR
|
|
16
|
+
IMPLIED, INCLUDING BUT NOT LIMITED TO THE WARRANTIES OF MERCHANTABILITY,
|
|
17
|
+
FITNESS FOR A PARTICULAR PURPOSE AND NONINFRINGEMENT. IN NO EVENT SHALL THE
|
|
18
|
+
AUTHORS OR COPYRIGHT HOLDERS BE LIABLE FOR ANY CLAIM, DAMAGES OR OTHER
|
|
19
|
+
LIABILITY, WHETHER IN AN ACTION OF CONTRACT, TORT OR OTHERWISE, ARISING FROM,
|
|
20
|
+
OUT OF OR IN CONNECTION WITH THE SOFTWARE OR THE USE OR OTHER DEALINGS IN THE
|
|
21
|
+
SOFTWARE.
|
mdsview-0.2.0/PKG-INFO
ADDED
|
@@ -0,0 +1,248 @@
|
|
|
1
|
+
Metadata-Version: 2.4
|
|
2
|
+
Name: mdsview
|
|
3
|
+
Version: 0.2.0
|
|
4
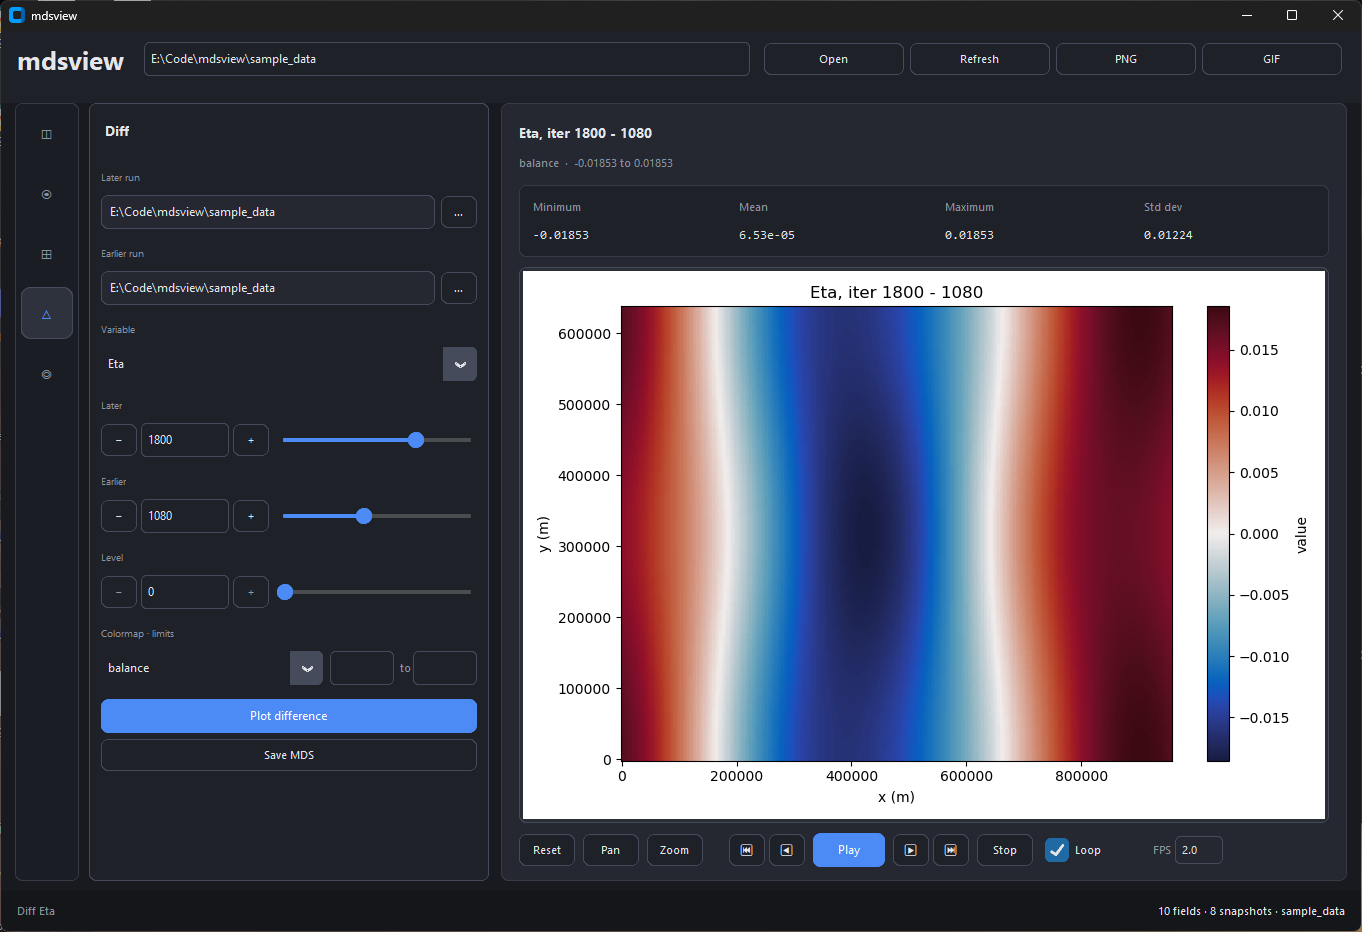
|
+
Summary: Browse, plot, and compare MITgcm MDS binary output from the CLI or an optional GUI.
|
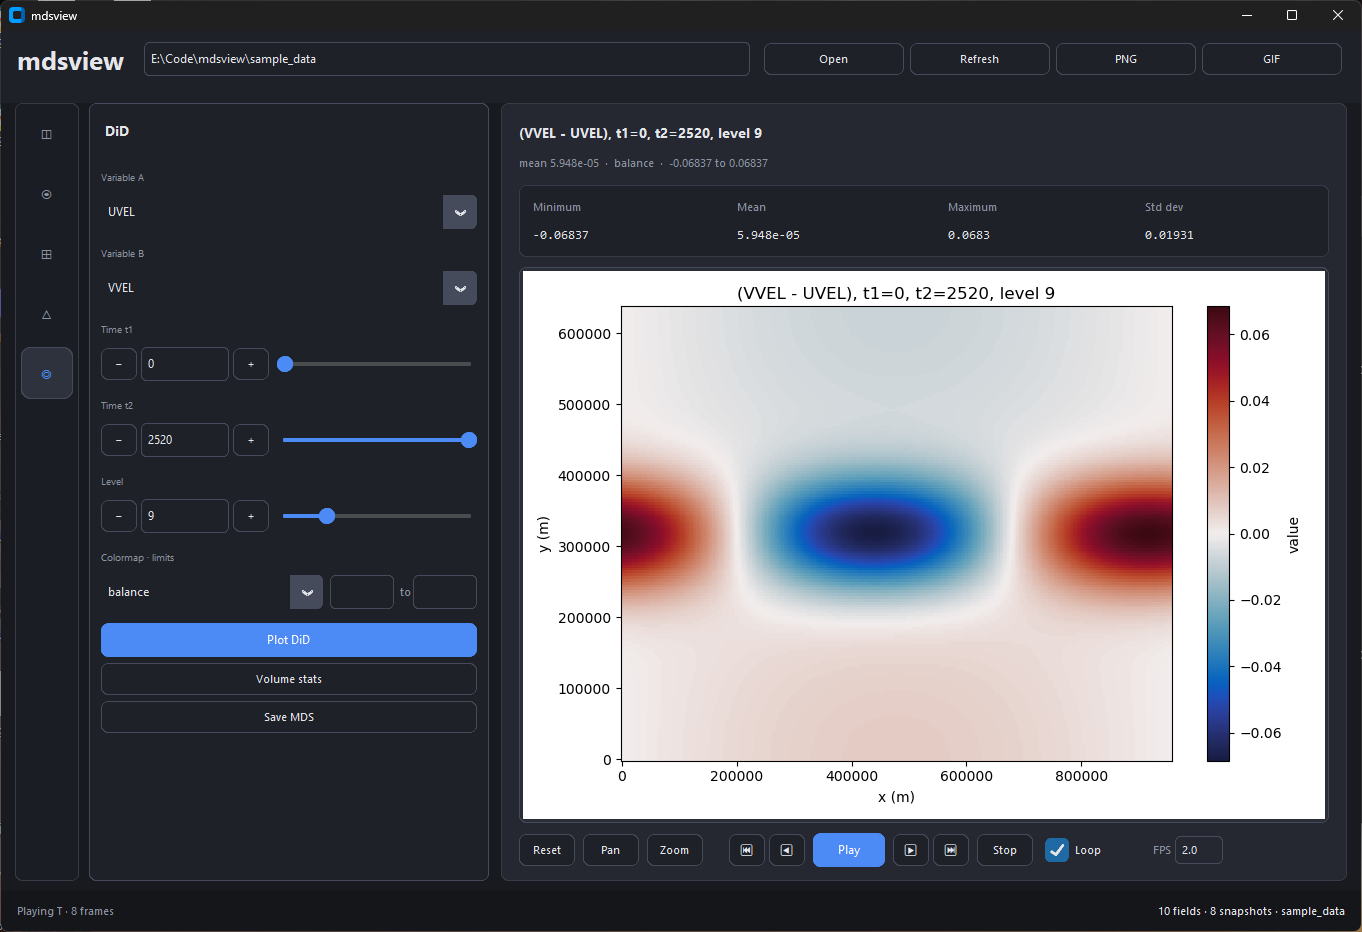
|
5
|
+
Author-email: "Rhett R. Adam" <rhettradam@gmail.com>
|
|
6
|
+
License-Expression: MIT
|
|
7
|
+
Project-URL: Homepage, https://github.com/rhettadam/mdsview
|
|
8
|
+
Project-URL: Repository, https://github.com/rhettadam/mdsview
|
|
9
|
+
Project-URL: Issues, https://github.com/rhettadam/mdsview/issues
|
|
10
|
+
Keywords: mitgcm,ocean,climate,mds,visualization,hpc,netcdf
|
|
11
|
+
Classifier: Development Status :: 4 - Beta
|
|
12
|
+
Classifier: Intended Audience :: Science/Research
|
|
13
|
+
Classifier: Topic :: Scientific/Engineering :: Visualization
|
|
14
|
+
Classifier: Topic :: Scientific/Engineering :: Atmospheric Science
|
|
15
|
+
Classifier: Topic :: Scientific/Engineering :: Oceanography
|
|
16
|
+
Classifier: Programming Language :: Python :: 3
|
|
17
|
+
Classifier: Programming Language :: Python :: 3.9
|
|
18
|
+
Classifier: Programming Language :: Python :: 3.10
|
|
19
|
+
Classifier: Programming Language :: Python :: 3.11
|
|
20
|
+
Classifier: Programming Language :: Python :: 3.12
|
|
21
|
+
Classifier: Operating System :: OS Independent
|
|
22
|
+
Requires-Python: >=3.9
|
|
23
|
+
Description-Content-Type: text/markdown
|
|
24
|
+
License-File: LICENSE
|
|
25
|
+
Requires-Dist: numpy>=1.20
|
|
26
|
+
Requires-Dist: matplotlib>=3.5
|
|
27
|
+
Requires-Dist: MITgcmutils>=0.1
|
|
28
|
+
Requires-Dist: cmocean>=4.0
|
|
29
|
+
Requires-Dist: pillow>=9.0
|
|
30
|
+
Provides-Extra: gui
|
|
31
|
+
Requires-Dist: customtkinter>=5.2; extra == "gui"
|
|
32
|
+
Provides-Extra: dev
|
|
33
|
+
Requires-Dist: pytest>=7; extra == "dev"
|
|
34
|
+
Provides-Extra: all
|
|
35
|
+
Requires-Dist: customtkinter>=5.2; extra == "all"
|
|
36
|
+
Requires-Dist: pytest>=7; extra == "all"
|
|
37
|
+
Dynamic: license-file
|
|
38
|
+
|
|
39
|
+
<img src="https://raw.githubusercontent.com/rhettadam/mdsview/main/docs/images/logo.png" alt="mdsview logo" width="280">
|
|
40
|
+
|
|
41
|
+
Browse, plot, and compare MITgcm MDS (`.data`/`.meta`) binary output. Use the CLI on a cluster or the optional GUI on your laptop.
|
|
42
|
+
|
|
43
|
+
[](https://www.python.org/)
|
|
44
|
+
[](LICENSE)
|
|
45
|
+
|
|
46
|
+
[MITgcm](https://mitgcm.org/) (MIT General Circulation Model) is a widely used ocean and climate model. A typical run writes out many 3-D fields (temperature, salinity, sea surface height, velocities) at regular time steps, often from MPI jobs on a cluster. The default binary format is **MDS**: each field is a **`.meta`** file (dimensions, precision, iteration) plus a **`.data`** file (raw array, usually big-endian float32). Tiled MPI output adds more filename suffixes but the same basic layout.
|
|
47
|
+
|
|
48
|
+
After a run you usually have a directory with hundreds or thousands of these file pairs and no built-in viewer. MITgcm ships [`MITgcmutils`](https://github.com/MITgcm/MITgcm/tree/master/utils/python/MITgcmutils) for reading and writing MDS in Python, but you still need scripts to list what's there, pick an iteration and level, plot a slice, or subtract two snapshots. mdsview fills that gap: catalog a run folder without loading `.data`, plot 2-D slices with grid coordinates, diff two times or two variables (DiD), and export figures or new MDS files from the terminal on a headless node or from a local GUI.
|
|
49
|
+
|
|
50
|
+
For huge LLC runs or lazy xarray loading, use [`xmitgcm`](https://xmitgcm.readthedocs.io/). mdsview targets quick inspection of run directories.
|
|
51
|
+
|
|
52
|
+
## Install
|
|
53
|
+
|
|
54
|
+
```bash
|
|
55
|
+
pip install mdsview
|
|
56
|
+
pip install "mdsview[gui]" # optional desktop GUI
|
|
57
|
+
```
|
|
58
|
+
|
|
59
|
+
From source:
|
|
60
|
+
|
|
61
|
+
```bash
|
|
62
|
+
git clone https://github.com/rhettadam/mdsview.git
|
|
63
|
+
cd mdsview
|
|
64
|
+
pip install -e .
|
|
65
|
+
pip install -e ".[gui]"
|
|
66
|
+
```
|
|
67
|
+
|
|
68
|
+
On Windows, if `mdsview` is not on PATH:
|
|
69
|
+
|
|
70
|
+
```bash
|
|
71
|
+
python -m mdsview.cli info -d C:\path\to\run
|
|
72
|
+
```
|
|
73
|
+
|
|
74
|
+
Requires Python 3.9+, NumPy, matplotlib, MITgcmutils, cmocean, Pillow. GUI needs CustomTkinter.
|
|
75
|
+
|
|
76
|
+
## Quick start
|
|
77
|
+
|
|
78
|
+
```bash
|
|
79
|
+
mdsview info -d /path/to/run
|
|
80
|
+
mdsview plot -v T -i 480 -l 4 -d /path/to/run
|
|
81
|
+
mdsview plot -v T -i 480 -l 4 --save-figure t.png --no-show -d /path/to/run # headless
|
|
82
|
+
mdsview gui -d /path/to/run
|
|
83
|
+
```
|
|
84
|
+
|
|
85
|
+
`-d FOLDER` is the run directory (default: `.`). `-v NAME` is the field prefix (`T`, `S`, `Eta`, …). Most commands accept `--json`. Run `mdsview COMMAND --help` for options.
|
|
86
|
+
|
|
87
|
+
## Sample data
|
|
88
|
+
|
|
89
|
+
Synthetic run directories for testing without MITgcm:
|
|
90
|
+
|
|
91
|
+
```bash
|
|
92
|
+
mdsview generate-sample -o sample_data --preset demo
|
|
93
|
+
```
|
|
94
|
+
|
|
95
|
+
See `sample_data/SAMPLE_README.txt` after generation. Other presets and options: `mdsview generate-sample --help`.
|
|
96
|
+
|
|
97
|
+
## CLI
|
|
98
|
+
|
|
99
|
+
### `info`
|
|
100
|
+
|
|
101
|
+
List variables or show metadata. Reads `.meta` only, safe with thousands of snapshots.
|
|
102
|
+
|
|
103
|
+
```bash
|
|
104
|
+
mdsview info
|
|
105
|
+
mdsview info -v T
|
|
106
|
+
mdsview info -v T --show-meta
|
|
107
|
+
mdsview info -v T --json
|
|
108
|
+
```
|
|
109
|
+
|
|
110
|
+
### `plot`
|
|
111
|
+
|
|
112
|
+
One 2-D slice. With `--level`, reads a single horizontal slab, not the full volume.
|
|
113
|
+
|
|
114
|
+
```bash
|
|
115
|
+
mdsview plot -v T -i 480 -l 4
|
|
116
|
+
mdsview plot -v Eta -i last
|
|
117
|
+
mdsview plot -v T -i 0 -l 10 --cmap haline --vmin 0 --vmax 30 --save-figure out.png --no-show
|
|
118
|
+
mdsview plot -v T -i 0 --no-coords # index axes, not XC/YC
|
|
119
|
+
```
|
|
120
|
+
|
|
121
|
+
### `diff`
|
|
122
|
+
|
|
123
|
+
`field(LATER) − field(EARLIER)`. Default is one slice; `--save-field` without `--level` loads full volumes.
|
|
124
|
+
|
|
125
|
+
```bash
|
|
126
|
+
mdsview diff -v T --later 2520 --earlier 0 -l 20
|
|
127
|
+
mdsview diff -v T --later 2520 --earlier 0 -l 20 --plot --save-figure diff.png --no-show
|
|
128
|
+
mdsview diff -v T --later 2520 --earlier 0 --save-field T_diff
|
|
129
|
+
mdsview diff -v T 480 0 -l 4 # positional iters also work
|
|
130
|
+
```
|
|
131
|
+
|
|
132
|
+
### `dod`
|
|
133
|
+
|
|
134
|
+
Difference-of-differences: `(B@t1 − A@t1) − (B@t2 − A@t2)`. Stats stream level-by-level; full 3-D output uses a memmap temp file.
|
|
135
|
+
|
|
136
|
+
```bash
|
|
137
|
+
mdsview dod -a T -b S --time1 0 --time2 2520
|
|
138
|
+
mdsview dod -a T -b S --time1 0 --time2 2520 -l 20 --plot --save-figure dod.png --no-show
|
|
139
|
+
mdsview dod -a T -b S --time1 0 --time2 2520 --save-field DiD_TS
|
|
140
|
+
mdsview dod -a UVEL -b VVEL --time1 0 --time2 120 --rec 0
|
|
141
|
+
```
|
|
142
|
+
|
|
143
|
+
### `combine`
|
|
144
|
+
|
|
145
|
+
Stack iterations into one array. Loads every listed iteration; use for small tests only.
|
|
146
|
+
|
|
147
|
+
```bash
|
|
148
|
+
mdsview combine -v T --iterations 0,360,720 --save-field T_stack
|
|
149
|
+
```
|
|
150
|
+
|
|
151
|
+
### `generate-sample`
|
|
152
|
+
|
|
153
|
+
Create synthetic `.data`/`.meta` for tests. See [Sample data](#sample-data).
|
|
154
|
+
|
|
155
|
+
### Plot options
|
|
156
|
+
|
|
157
|
+
Used by `plot`, `diff`, and `dod`:
|
|
158
|
+
|
|
159
|
+
- `-l`, `--level K`: vertical index (0 = top)
|
|
160
|
+
- `--cmap`: default `thermal` (plot) or `balance` (diff/dod); matplotlib + cmocean names
|
|
161
|
+
- `--vmin`, `--vmax`
|
|
162
|
+
- `--save-figure FILE`, `--no-show`
|
|
163
|
+
|
|
164
|
+
Diff/dod plots use a symmetric diverging scale. Full list: `mdsview/colormaps.py`.
|
|
165
|
+
|
|
166
|
+
## GUI
|
|
167
|
+
|
|
168
|
+
```bash
|
|
169
|
+
pip install "mdsview[gui]"
|
|
170
|
+
mdsview gui -d /path/to/run
|
|
171
|
+
```
|
|
172
|
+
|
|
173
|
+
|
|
174
|
+
|
|
175
|
+
Run directory at the top. Left icons switch panels; controls sit beside the plot. Stats (min, mean, max, std) update with each field.
|
|
176
|
+
|
|
177
|
+
|
|
178
|
+
|
|
179
|
+
Lists every variable in the run. Selecting one shows metadata below; double-click or **Plot selected** opens it in Field.
|
|
180
|
+
|
|
181
|
+
|
|
182
|
+
|
|
183
|
+
Pick variable, iteration, and level. Sliders auto-refresh the plot. Footer controls step through time or export a GIF.
|
|
184
|
+
|
|
185
|
+
|
|
186
|
+
|
|
187
|
+
Preview XC/YC (or other grid files) and optionally overlay grid lines on field plots.
|
|
188
|
+
|
|
189
|
+
|
|
190
|
+
|
|
191
|
+
Subtract an earlier snapshot from a later one. Later and earlier can live in different run directories.
|
|
192
|
+
|
|
193
|
+
|
|
194
|
+
|
|
195
|
+
Plot or export the difference-of-differences between two variables at two times. **Volume stats** runs the same streaming calculation as `mdsview dod` without `--plot`.
|
|
196
|
+
|
|
197
|
+
Top bar: **Open** (`Ctrl+O`), **Refresh** (`Ctrl+R`), **PNG** (`Ctrl+S`), **GIF** (export dialog). Matplotlib pan/zoom sits under the plot.
|
|
198
|
+
|
|
199
|
+
## HPC / batch
|
|
200
|
+
|
|
201
|
+
CLI uses the Agg backend by default (no display). Use `--save-figure` and `--no-show`:
|
|
202
|
+
|
|
203
|
+
```bash
|
|
204
|
+
mdsview info -d /scratch/run001
|
|
205
|
+
mdsview plot -v T -i last -l 20 -d /scratch/run001 --save-figure t.png --no-show
|
|
206
|
+
mdsview dod -a T -b S --time1 0 --time2 2520 --json -d /scratch/run001
|
|
207
|
+
```
|
|
208
|
+
|
|
209
|
+
Exit codes: `0` ok, `1` error, `2` bad args, `130` interrupt. Errors go to stderr. Tracebacks: `MDSVIEW_DEBUG=1`.
|
|
210
|
+
|
|
211
|
+
### Memory
|
|
212
|
+
|
|
213
|
+
- `info`: `.meta` filenames only
|
|
214
|
+
- `plot` / `diff` with `-l`: one slab per snapshot
|
|
215
|
+
- `dod` stats: level-by-level
|
|
216
|
+
- `dod` / `diff --save-field` (no level): full volume; `combine`: all listed iters in RAM
|
|
217
|
+
|
|
218
|
+
## Python API
|
|
219
|
+
|
|
220
|
+
```python
|
|
221
|
+
from mdsview import io, ops, plotting
|
|
222
|
+
|
|
223
|
+
slab = io.read_level_slice("/path/to/run", "T", 480, level=4)
|
|
224
|
+
diff2d, meta = ops.diff_slice("/path/to/run", "T", later=480, earlier=0, level=4)
|
|
225
|
+
plotting.plot_field("/path/to/run", "T", 480, level=4, save="t.png", show=False)
|
|
226
|
+
```
|
|
227
|
+
|
|
228
|
+
## Limitations
|
|
229
|
+
|
|
230
|
+
- Standard MDS only, not `pkg/mnc` tiles (use `gluemnc` first)
|
|
231
|
+
- `dod --rec` for multi-record files; other commands may need extending
|
|
232
|
+
- No 3-D volume rendering; LLC unfolding is partial (needs XC/YC in the run dir)
|
|
233
|
+
|
|
234
|
+
## PyPI release
|
|
235
|
+
|
|
236
|
+
```bash
|
|
237
|
+
# bump version in mdsview/__init__.py and pyproject.toml
|
|
238
|
+
pip install build twine
|
|
239
|
+
python -m build
|
|
240
|
+
twine upload --repository testpypi dist/*
|
|
241
|
+
twine upload dist/*
|
|
242
|
+
```
|
|
243
|
+
|
|
244
|
+
Add screenshots under `docs/images/` before publishing.
|
|
245
|
+
|
|
246
|
+
## License
|
|
247
|
+
|
|
248
|
+
MIT License. See [LICENSE](LICENSE). Copyright (c) 2026 Rhett R. Adam.
|
mdsview-0.2.0/README.md
ADDED
|
@@ -0,0 +1,210 @@
|
|
|
1
|
+
<img src="https://raw.githubusercontent.com/rhettadam/mdsview/main/docs/images/logo.png" alt="mdsview logo" width="280">
|
|
2
|
+
|
|
3
|
+
Browse, plot, and compare MITgcm MDS (`.data`/`.meta`) binary output. Use the CLI on a cluster or the optional GUI on your laptop.
|
|
4
|
+
|
|
5
|
+
[](https://www.python.org/)
|
|
6
|
+
[](LICENSE)
|
|
7
|
+
|
|
8
|
+
[MITgcm](https://mitgcm.org/) (MIT General Circulation Model) is a widely used ocean and climate model. A typical run writes out many 3-D fields (temperature, salinity, sea surface height, velocities) at regular time steps, often from MPI jobs on a cluster. The default binary format is **MDS**: each field is a **`.meta`** file (dimensions, precision, iteration) plus a **`.data`** file (raw array, usually big-endian float32). Tiled MPI output adds more filename suffixes but the same basic layout.
|
|
9
|
+
|
|
10
|
+
After a run you usually have a directory with hundreds or thousands of these file pairs and no built-in viewer. MITgcm ships [`MITgcmutils`](https://github.com/MITgcm/MITgcm/tree/master/utils/python/MITgcmutils) for reading and writing MDS in Python, but you still need scripts to list what's there, pick an iteration and level, plot a slice, or subtract two snapshots. mdsview fills that gap: catalog a run folder without loading `.data`, plot 2-D slices with grid coordinates, diff two times or two variables (DiD), and export figures or new MDS files from the terminal on a headless node or from a local GUI.
|
|
11
|
+
|
|
12
|
+
For huge LLC runs or lazy xarray loading, use [`xmitgcm`](https://xmitgcm.readthedocs.io/). mdsview targets quick inspection of run directories.
|
|
13
|
+
|
|
14
|
+
## Install
|
|
15
|
+
|
|
16
|
+
```bash
|
|
17
|
+
pip install mdsview
|
|
18
|
+
pip install "mdsview[gui]" # optional desktop GUI
|
|
19
|
+
```
|
|
20
|
+
|
|
21
|
+
From source:
|
|
22
|
+
|
|
23
|
+
```bash
|
|
24
|
+
git clone https://github.com/rhettadam/mdsview.git
|
|
25
|
+
cd mdsview
|
|
26
|
+
pip install -e .
|
|
27
|
+
pip install -e ".[gui]"
|
|
28
|
+
```
|
|
29
|
+
|
|
30
|
+
On Windows, if `mdsview` is not on PATH:
|
|
31
|
+
|
|
32
|
+
```bash
|
|
33
|
+
python -m mdsview.cli info -d C:\path\to\run
|
|
34
|
+
```
|
|
35
|
+
|
|
36
|
+
Requires Python 3.9+, NumPy, matplotlib, MITgcmutils, cmocean, Pillow. GUI needs CustomTkinter.
|
|
37
|
+
|
|
38
|
+
## Quick start
|
|
39
|
+
|
|
40
|
+
```bash
|
|
41
|
+
mdsview info -d /path/to/run
|
|
42
|
+
mdsview plot -v T -i 480 -l 4 -d /path/to/run
|
|
43
|
+
mdsview plot -v T -i 480 -l 4 --save-figure t.png --no-show -d /path/to/run # headless
|
|
44
|
+
mdsview gui -d /path/to/run
|
|
45
|
+
```
|
|
46
|
+
|
|
47
|
+
`-d FOLDER` is the run directory (default: `.`). `-v NAME` is the field prefix (`T`, `S`, `Eta`, …). Most commands accept `--json`. Run `mdsview COMMAND --help` for options.
|
|
48
|
+
|
|
49
|
+
## Sample data
|
|
50
|
+
|
|
51
|
+
Synthetic run directories for testing without MITgcm:
|
|
52
|
+
|
|
53
|
+
```bash
|
|
54
|
+
mdsview generate-sample -o sample_data --preset demo
|
|
55
|
+
```
|
|
56
|
+
|
|
57
|
+
See `sample_data/SAMPLE_README.txt` after generation. Other presets and options: `mdsview generate-sample --help`.
|
|
58
|
+
|
|
59
|
+
## CLI
|
|
60
|
+
|
|
61
|
+
### `info`
|
|
62
|
+
|
|
63
|
+
List variables or show metadata. Reads `.meta` only, safe with thousands of snapshots.
|
|
64
|
+
|
|
65
|
+
```bash
|
|
66
|
+
mdsview info
|
|
67
|
+
mdsview info -v T
|
|
68
|
+
mdsview info -v T --show-meta
|
|
69
|
+
mdsview info -v T --json
|
|
70
|
+
```
|
|
71
|
+
|
|
72
|
+
### `plot`
|
|
73
|
+
|
|
74
|
+
One 2-D slice. With `--level`, reads a single horizontal slab, not the full volume.
|
|
75
|
+
|
|
76
|
+
```bash
|
|
77
|
+
mdsview plot -v T -i 480 -l 4
|
|
78
|
+
mdsview plot -v Eta -i last
|
|
79
|
+
mdsview plot -v T -i 0 -l 10 --cmap haline --vmin 0 --vmax 30 --save-figure out.png --no-show
|
|
80
|
+
mdsview plot -v T -i 0 --no-coords # index axes, not XC/YC
|
|
81
|
+
```
|
|
82
|
+
|
|
83
|
+
### `diff`
|
|
84
|
+
|
|
85
|
+
`field(LATER) − field(EARLIER)`. Default is one slice; `--save-field` without `--level` loads full volumes.
|
|
86
|
+
|
|
87
|
+
```bash
|
|
88
|
+
mdsview diff -v T --later 2520 --earlier 0 -l 20
|
|
89
|
+
mdsview diff -v T --later 2520 --earlier 0 -l 20 --plot --save-figure diff.png --no-show
|
|
90
|
+
mdsview diff -v T --later 2520 --earlier 0 --save-field T_diff
|
|
91
|
+
mdsview diff -v T 480 0 -l 4 # positional iters also work
|
|
92
|
+
```
|
|
93
|
+
|
|
94
|
+
### `dod`
|
|
95
|
+
|
|
96
|
+
Difference-of-differences: `(B@t1 − A@t1) − (B@t2 − A@t2)`. Stats stream level-by-level; full 3-D output uses a memmap temp file.
|
|
97
|
+
|
|
98
|
+
```bash
|
|
99
|
+
mdsview dod -a T -b S --time1 0 --time2 2520
|
|
100
|
+
mdsview dod -a T -b S --time1 0 --time2 2520 -l 20 --plot --save-figure dod.png --no-show
|
|
101
|
+
mdsview dod -a T -b S --time1 0 --time2 2520 --save-field DiD_TS
|
|
102
|
+
mdsview dod -a UVEL -b VVEL --time1 0 --time2 120 --rec 0
|
|
103
|
+
```
|
|
104
|
+
|
|
105
|
+
### `combine`
|
|
106
|
+
|
|
107
|
+
Stack iterations into one array. Loads every listed iteration; use for small tests only.
|
|
108
|
+
|
|
109
|
+
```bash
|
|
110
|
+
mdsview combine -v T --iterations 0,360,720 --save-field T_stack
|
|
111
|
+
```
|
|
112
|
+
|
|
113
|
+
### `generate-sample`
|
|
114
|
+
|
|
115
|
+
Create synthetic `.data`/`.meta` for tests. See [Sample data](#sample-data).
|
|
116
|
+
|
|
117
|
+
### Plot options
|
|
118
|
+
|
|
119
|
+
Used by `plot`, `diff`, and `dod`:
|
|
120
|
+
|
|
121
|
+
- `-l`, `--level K`: vertical index (0 = top)
|
|
122
|
+
- `--cmap`: default `thermal` (plot) or `balance` (diff/dod); matplotlib + cmocean names
|
|
123
|
+
- `--vmin`, `--vmax`
|
|
124
|
+
- `--save-figure FILE`, `--no-show`
|
|
125
|
+
|
|
126
|
+
Diff/dod plots use a symmetric diverging scale. Full list: `mdsview/colormaps.py`.
|
|
127
|
+
|
|
128
|
+
## GUI
|
|
129
|
+
|
|
130
|
+
```bash
|
|
131
|
+
pip install "mdsview[gui]"
|
|
132
|
+
mdsview gui -d /path/to/run
|
|
133
|
+
```
|
|
134
|
+
|
|
135
|
+

|
|
136
|
+
|
|
137
|
+
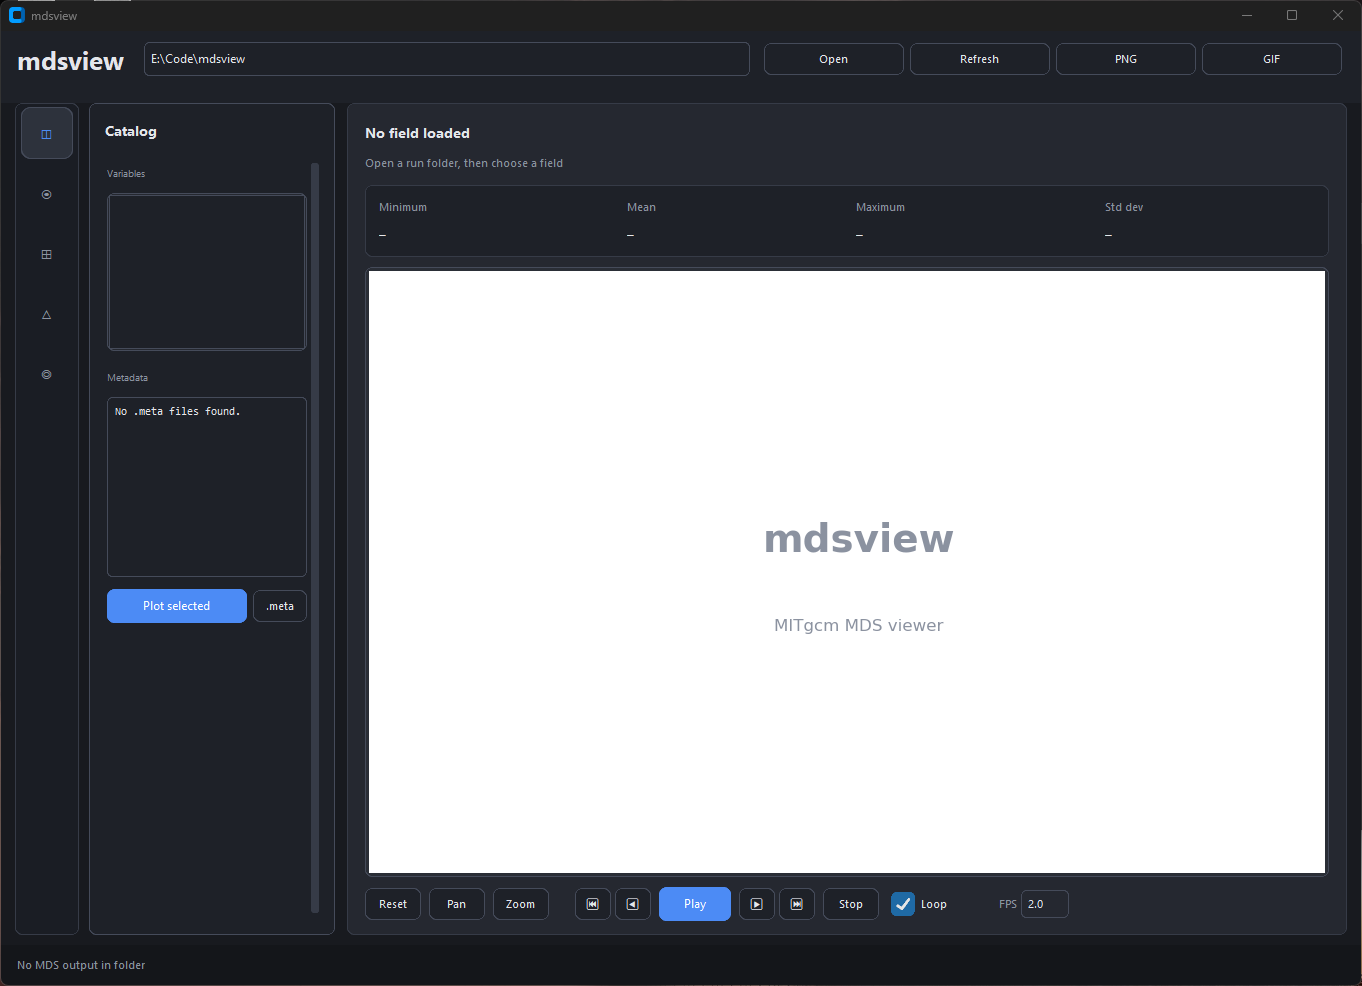
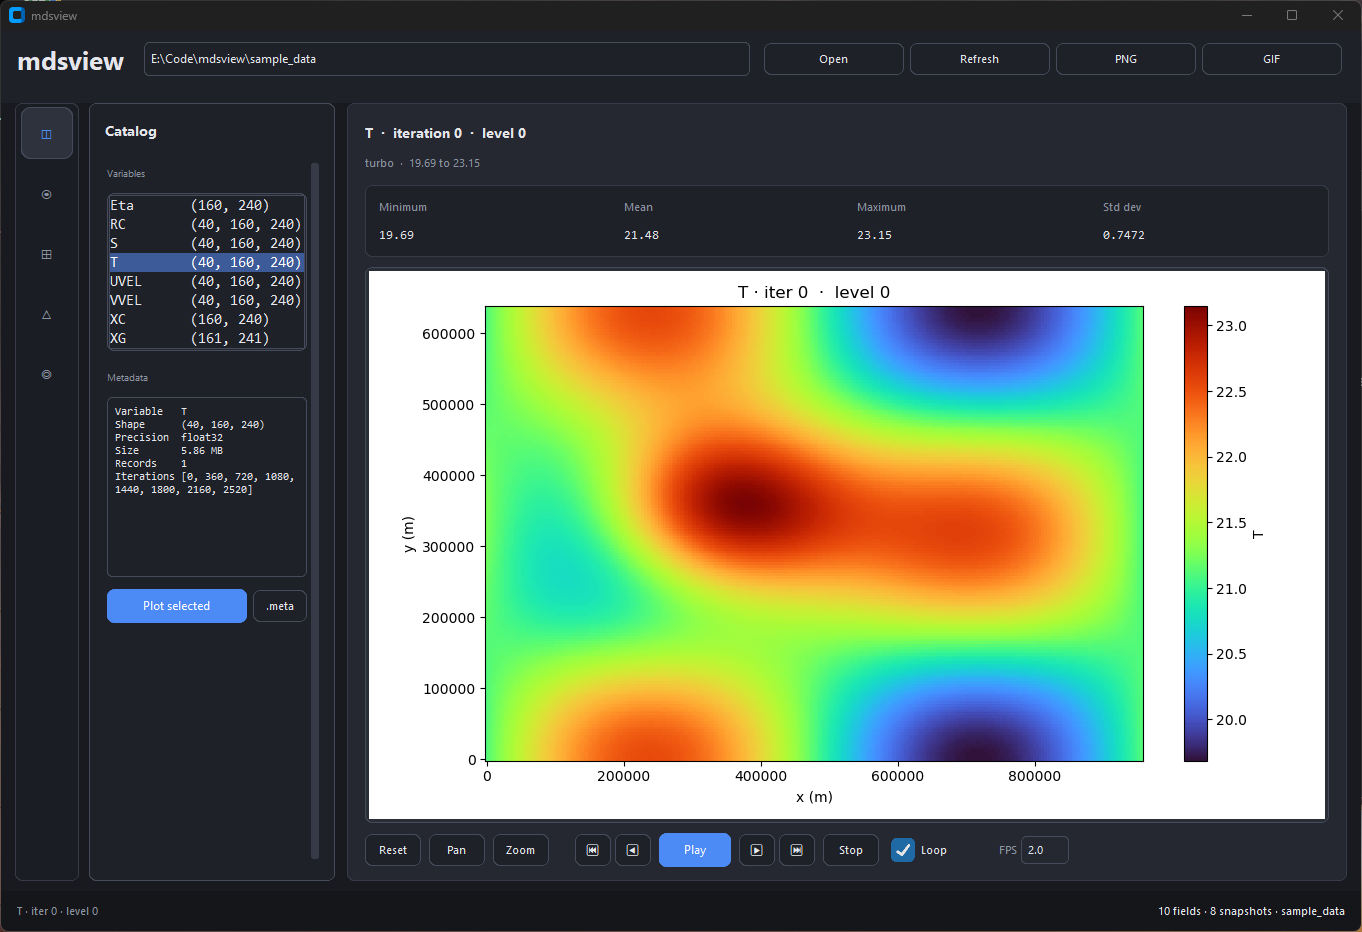
Run directory at the top. Left icons switch panels; controls sit beside the plot. Stats (min, mean, max, std) update with each field.
|
|
138
|
+
|
|
139
|
+

|
|
140
|
+
|
|
141
|
+
Lists every variable in the run. Selecting one shows metadata below; double-click or **Plot selected** opens it in Field.
|
|
142
|
+
|
|
143
|
+

|
|
144
|
+
|
|
145
|
+
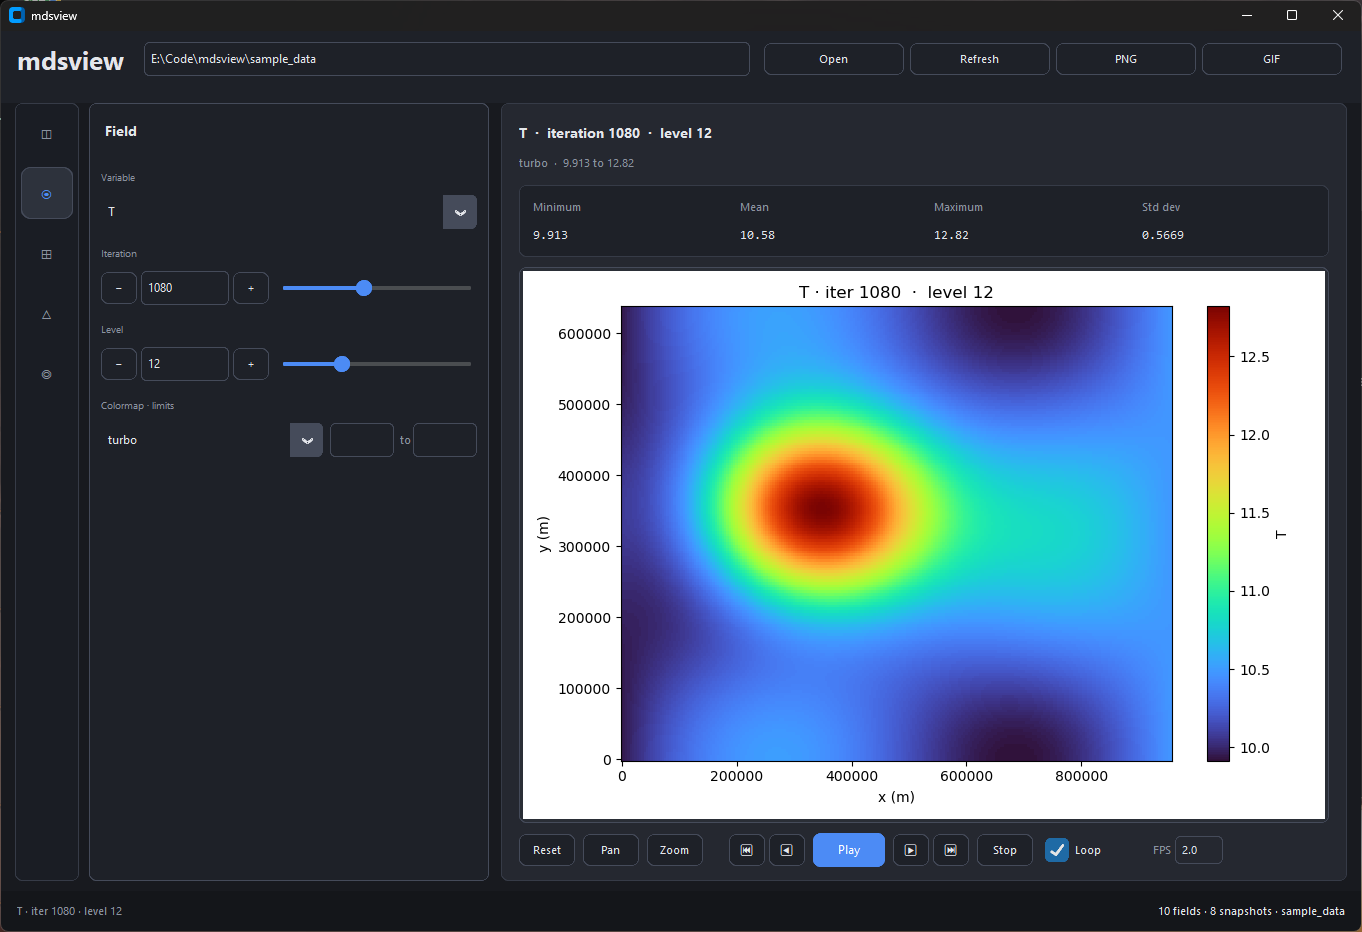
Pick variable, iteration, and level. Sliders auto-refresh the plot. Footer controls step through time or export a GIF.
|
|
146
|
+
|
|
147
|
+

|
|
148
|
+
|
|
149
|
+
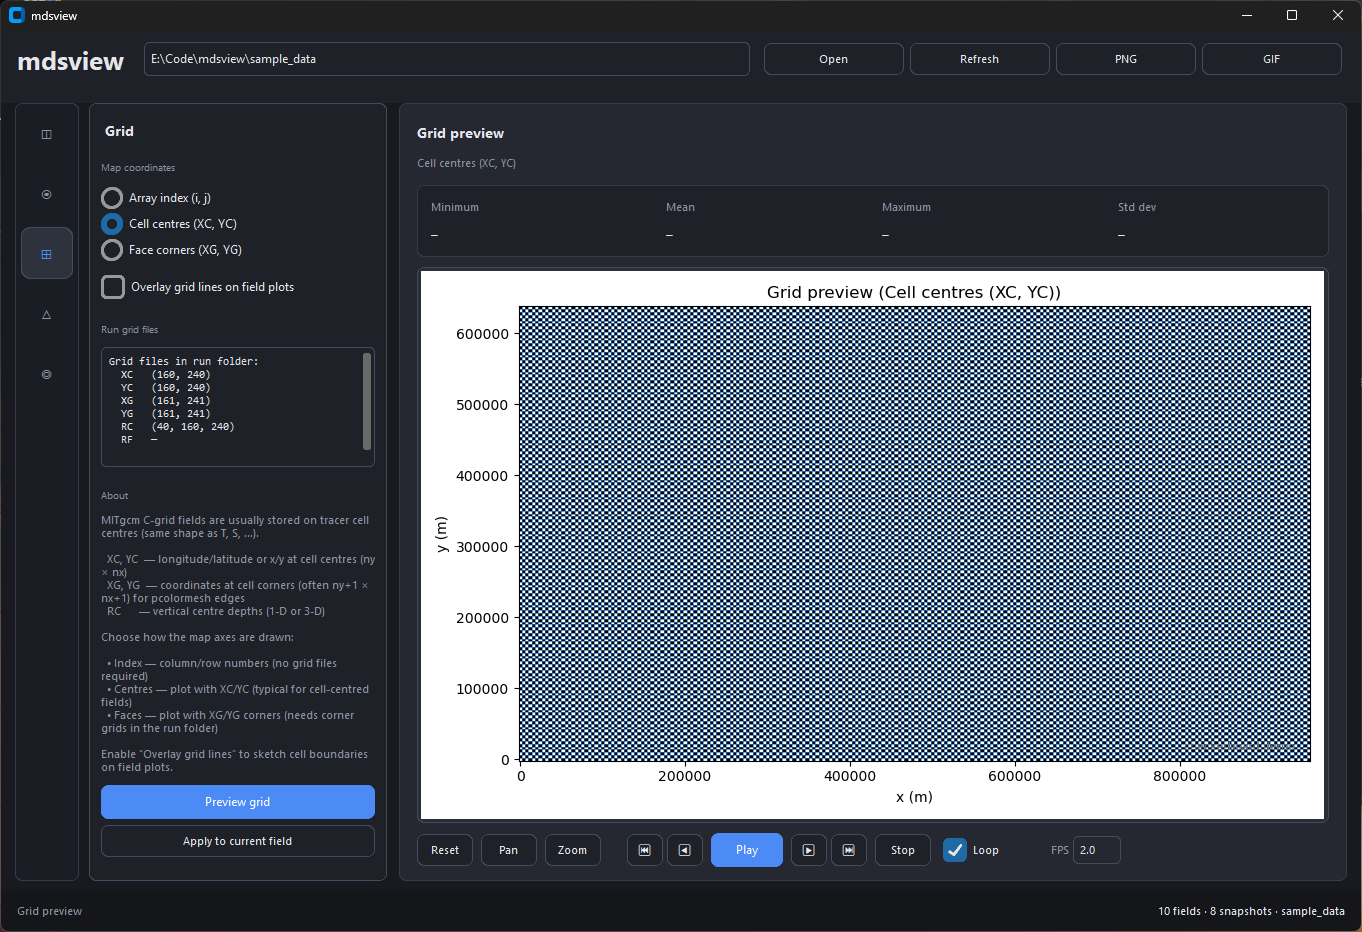
Preview XC/YC (or other grid files) and optionally overlay grid lines on field plots.
|
|
150
|
+
|
|
151
|
+

|
|
152
|
+
|
|
153
|
+
Subtract an earlier snapshot from a later one. Later and earlier can live in different run directories.
|
|
154
|
+
|
|
155
|
+

|
|
156
|
+
|
|
157
|
+
Plot or export the difference-of-differences between two variables at two times. **Volume stats** runs the same streaming calculation as `mdsview dod` without `--plot`.
|
|
158
|
+
|
|
159
|
+
Top bar: **Open** (`Ctrl+O`), **Refresh** (`Ctrl+R`), **PNG** (`Ctrl+S`), **GIF** (export dialog). Matplotlib pan/zoom sits under the plot.
|
|
160
|
+
|
|
161
|
+
## HPC / batch
|
|
162
|
+
|
|
163
|
+
CLI uses the Agg backend by default (no display). Use `--save-figure` and `--no-show`:
|
|
164
|
+
|
|
165
|
+
```bash
|
|
166
|
+
mdsview info -d /scratch/run001
|
|
167
|
+
mdsview plot -v T -i last -l 20 -d /scratch/run001 --save-figure t.png --no-show
|
|
168
|
+
mdsview dod -a T -b S --time1 0 --time2 2520 --json -d /scratch/run001
|
|
169
|
+
```
|
|
170
|
+
|
|
171
|
+
Exit codes: `0` ok, `1` error, `2` bad args, `130` interrupt. Errors go to stderr. Tracebacks: `MDSVIEW_DEBUG=1`.
|
|
172
|
+
|
|
173
|
+
### Memory
|
|
174
|
+
|
|
175
|
+
- `info`: `.meta` filenames only
|
|
176
|
+
- `plot` / `diff` with `-l`: one slab per snapshot
|
|
177
|
+
- `dod` stats: level-by-level
|
|
178
|
+
- `dod` / `diff --save-field` (no level): full volume; `combine`: all listed iters in RAM
|
|
179
|
+
|
|
180
|
+
## Python API
|
|
181
|
+
|
|
182
|
+
```python
|
|
183
|
+
from mdsview import io, ops, plotting
|
|
184
|
+
|
|
185
|
+
slab = io.read_level_slice("/path/to/run", "T", 480, level=4)
|
|
186
|
+
diff2d, meta = ops.diff_slice("/path/to/run", "T", later=480, earlier=0, level=4)
|
|
187
|
+
plotting.plot_field("/path/to/run", "T", 480, level=4, save="t.png", show=False)
|
|
188
|
+
```
|
|
189
|
+
|
|
190
|
+
## Limitations
|
|
191
|
+
|
|
192
|
+
- Standard MDS only, not `pkg/mnc` tiles (use `gluemnc` first)
|
|
193
|
+
- `dod --rec` for multi-record files; other commands may need extending
|
|
194
|
+
- No 3-D volume rendering; LLC unfolding is partial (needs XC/YC in the run dir)
|
|
195
|
+
|
|
196
|
+
## PyPI release
|
|
197
|
+
|
|
198
|
+
```bash
|
|
199
|
+
# bump version in mdsview/__init__.py and pyproject.toml
|
|
200
|
+
pip install build twine
|
|
201
|
+
python -m build
|
|
202
|
+
twine upload --repository testpypi dist/*
|
|
203
|
+
twine upload dist/*
|
|
204
|
+
```
|
|
205
|
+
|
|
206
|
+
Add screenshots under `docs/images/` before publishing.
|
|
207
|
+
|
|
208
|
+
## License
|
|
209
|
+
|
|
210
|
+
MIT License. See [LICENSE](LICENSE). Copyright (c) 2026 Rhett R. Adam.
|
|
@@ -0,0 +1,154 @@
|
|
|
1
|
+
"""Timestep playback and GIF export helpers."""
|
|
2
|
+
|
|
3
|
+
from __future__ import annotations
|
|
4
|
+
|
|
5
|
+
import io as pyio
|
|
6
|
+
import os
|
|
7
|
+
import tempfile
|
|
8
|
+
from typing import Callable
|
|
9
|
+
|
|
10
|
+
import matplotlib.pyplot as plt
|
|
11
|
+
import numpy as np
|
|
12
|
+
from PIL import Image
|
|
13
|
+
|
|
14
|
+
from . import io, plotting
|
|
15
|
+
|
|
16
|
+
|
|
17
|
+
def resolve_playback_clim(
|
|
18
|
+
data_dir: str,
|
|
19
|
+
prefix: str,
|
|
20
|
+
iterations: list[int],
|
|
21
|
+
level: int,
|
|
22
|
+
*,
|
|
23
|
+
user_vmin: float | None,
|
|
24
|
+
user_vmax: float | None,
|
|
25
|
+
lock_scale: bool,
|
|
26
|
+
symmetric: bool = False,
|
|
27
|
+
max_samples: int = 64,
|
|
28
|
+
anchor_iteration: int | None = None,
|
|
29
|
+
) -> tuple[float | None, float | None]:
|
|
30
|
+
"""Colour limits for playback/GIF; optionally fixed across frames."""
|
|
31
|
+
if not lock_scale:
|
|
32
|
+
return user_vmin, user_vmax
|
|
33
|
+
|
|
34
|
+
if user_vmin is not None and user_vmax is not None:
|
|
35
|
+
return user_vmin, user_vmax
|
|
36
|
+
if symmetric and user_vmax is not None:
|
|
37
|
+
return -user_vmax, user_vmax
|
|
38
|
+
|
|
39
|
+
if anchor_iteration is not None:
|
|
40
|
+
field2d = io.read_level_slice(data_dir, prefix, anchor_iteration, level)
|
|
41
|
+
return plotting.resolved_clim(
|
|
42
|
+
field2d, user_vmin, user_vmax, symmetric=symmetric,
|
|
43
|
+
)
|
|
44
|
+
|
|
45
|
+
sample_iters = _subsample_iterations(iterations, max_samples)
|
|
46
|
+
|
|
47
|
+
if symmetric:
|
|
48
|
+
peak = 0.0
|
|
49
|
+
for itr in sample_iters:
|
|
50
|
+
sl = io.read_level_slice(data_dir, prefix, itr, level)
|
|
51
|
+
peak = max(peak, float(np.nanmax(np.abs(sl))))
|
|
52
|
+
limit = peak or 1.0
|
|
53
|
+
return -limit, limit
|
|
54
|
+
|
|
55
|
+
vmin, vmax = np.inf, -np.inf
|
|
56
|
+
for itr in sample_iters:
|
|
57
|
+
sl = io.read_level_slice(data_dir, prefix, itr, level)
|
|
58
|
+
finite = sl[np.isfinite(sl)]
|
|
59
|
+
if finite.size:
|
|
60
|
+
vmin = min(vmin, float(np.min(finite)))
|
|
61
|
+
vmax = max(vmax, float(np.max(finite)))
|
|
62
|
+
if not np.isfinite(vmin):
|
|
63
|
+
return user_vmin, user_vmax
|
|
64
|
+
return vmin, vmax
|
|
65
|
+
|
|
66
|
+
|
|
67
|
+
def _subsample_iterations(iterations: list[int], max_samples: int) -> list[int]:
|
|
68
|
+
if max_samples <= 0 or len(iterations) <= max_samples:
|
|
69
|
+
return list(iterations)
|
|
70
|
+
idx = np.linspace(0, len(iterations) - 1, max_samples, dtype=int)
|
|
71
|
+
return [iterations[int(i)] for i in idx]
|
|
72
|
+
|
|
73
|
+
|
|
74
|
+
def save_playback_gif(
|
|
75
|
+
data_dir: str,
|
|
76
|
+
prefix: str,
|
|
77
|
+
iterations: list[int],
|
|
78
|
+
level: int,
|
|
79
|
+
output_path: str,
|
|
80
|
+
*,
|
|
81
|
+
cmap: str,
|
|
82
|
+
vmin: float | None,
|
|
83
|
+
vmax: float | None,
|
|
84
|
+
lock_scale: bool = True,
|
|
85
|
+
fps: float = 2.0,
|
|
86
|
+
coord_mode: str = "centers",
|
|
87
|
+
overlay_grid: bool = False,
|
|
88
|
+
progress: Callable[[int, int], None] | None = None,
|
|
89
|
+
) -> None:
|
|
90
|
+
"""Render a timestep loop to an animated GIF (one frame at a time on disk)."""
|
|
91
|
+
if not iterations:
|
|
92
|
+
raise ValueError("No iterations to animate")
|
|
93
|
+
|
|
94
|
+
clim_vmin, clim_vmax = resolve_playback_clim(
|
|
95
|
+
data_dir,
|
|
96
|
+
prefix,
|
|
97
|
+
iterations,
|
|
98
|
+
level,
|
|
99
|
+
user_vmin=vmin,
|
|
100
|
+
user_vmax=vmax,
|
|
101
|
+
lock_scale=lock_scale,
|
|
102
|
+
symmetric=False,
|
|
103
|
+
)
|
|
104
|
+
|
|
105
|
+
duration_ms = max(int(1000 / max(fps, 0.1)), 50)
|
|
106
|
+
total = len(iterations)
|
|
107
|
+
field_shape = io.field_info(data_dir, prefix).shape
|
|
108
|
+
|
|
109
|
+
with tempfile.TemporaryDirectory(prefix="mdsview_gif_") as tmpdir:
|
|
110
|
+
frame_paths: list[str] = []
|
|
111
|
+
fig, ax = plt.subplots(figsize=(7, 5))
|
|
112
|
+
try:
|
|
113
|
+
for i, iteration in enumerate(iterations):
|
|
114
|
+
field2d = io.read_level_slice(data_dir, prefix, iteration, level)
|
|
115
|
+
title = plotting.format_field_title(
|
|
116
|
+
prefix, iteration, level=level, shape=field_shape,
|
|
117
|
+
)
|
|
118
|
+
plotting.draw_slice_on_ax(
|
|
119
|
+
ax,
|
|
120
|
+
field2d,
|
|
121
|
+
data_dir,
|
|
122
|
+
title=title,
|
|
123
|
+
cmap=cmap,
|
|
124
|
+
vmin=clim_vmin,
|
|
125
|
+
vmax=clim_vmax,
|
|
126
|
+
clear=True,
|
|
127
|
+
colorbar_label=prefix,
|
|
128
|
+
coord_mode=coord_mode,
|
|
129
|
+
overlay_grid=overlay_grid,
|
|
130
|
+
)
|
|
131
|
+
path = os.path.join(tmpdir, f"frame_{i:06d}.png")
|
|
132
|
+
fig.savefig(path, dpi=120, bbox_inches="tight")
|
|
133
|
+
frame_paths.append(path)
|
|
134
|
+
if progress:
|
|
135
|
+
progress(i + 1, total)
|
|
136
|
+
finally:
|
|
137
|
+
plt.close(fig)
|
|
138
|
+
|
|
139
|
+
first = Image.open(frame_paths[0]).convert("P", palette=Image.ADAPTIVE, colors=256)
|
|
140
|
+
rest = [
|
|
141
|
+
Image.open(p).convert("P", palette=first.palette)
|
|
142
|
+
for p in frame_paths[1:]
|
|
143
|
+
]
|
|
144
|
+
first.save(
|
|
145
|
+
output_path,
|
|
146
|
+
save_all=True,
|
|
147
|
+
append_images=rest,
|
|
148
|
+
duration=duration_ms,
|
|
149
|
+
loop=0,
|
|
150
|
+
disposal=2,
|
|
151
|
+
)
|
|
152
|
+
for im in rest:
|
|
153
|
+
im.close()
|
|
154
|
+
first.close()
|
|
Binary file
|