matplotlib-multicolored-line 0.1.1__tar.gz → 0.3.0__tar.gz
This diff represents the content of publicly available package versions that have been released to one of the supported registries. The information contained in this diff is provided for informational purposes only and reflects changes between package versions as they appear in their respective public registries.
- {matplotlib_multicolored_line-0.1.1 → matplotlib_multicolored_line-0.3.0}/PKG-INFO +12 -3
- {matplotlib_multicolored_line-0.1.1 → matplotlib_multicolored_line-0.3.0}/README.md +11 -2
- {matplotlib_multicolored_line-0.1.1 → matplotlib_multicolored_line-0.3.0}/pyproject.toml +1 -1
- {matplotlib_multicolored_line-0.1.1 → matplotlib_multicolored_line-0.3.0}/src/matplotlib_multicolored_line/__init__.py +1 -1
- matplotlib_multicolored_line-0.3.0/src/matplotlib_multicolored_line/_main.py +128 -0
- {matplotlib_multicolored_line-0.1.1 → matplotlib_multicolored_line-0.3.0}/src/matplotlib_multicolored_line.egg-info/PKG-INFO +12 -3
- matplotlib_multicolored_line-0.3.0/tests/test_main.py +114 -0
- matplotlib_multicolored_line-0.1.1/src/matplotlib_multicolored_line/_main.py +0 -80
- matplotlib_multicolored_line-0.1.1/tests/test_main.py +0 -36
- {matplotlib_multicolored_line-0.1.1 → matplotlib_multicolored_line-0.3.0}/LICENSE +0 -0
- {matplotlib_multicolored_line-0.1.1 → matplotlib_multicolored_line-0.3.0}/setup.cfg +0 -0
- {matplotlib_multicolored_line-0.1.1 → matplotlib_multicolored_line-0.3.0}/setup.py +0 -0
- {matplotlib_multicolored_line-0.1.1 → matplotlib_multicolored_line-0.3.0}/src/matplotlib_multicolored_line/py.typed +0 -0
- {matplotlib_multicolored_line-0.1.1 → matplotlib_multicolored_line-0.3.0}/src/matplotlib_multicolored_line.egg-info/SOURCES.txt +0 -0
- {matplotlib_multicolored_line-0.1.1 → matplotlib_multicolored_line-0.3.0}/src/matplotlib_multicolored_line.egg-info/dependency_links.txt +0 -0
- {matplotlib_multicolored_line-0.1.1 → matplotlib_multicolored_line-0.3.0}/src/matplotlib_multicolored_line.egg-info/requires.txt +0 -0
- {matplotlib_multicolored_line-0.1.1 → matplotlib_multicolored_line-0.3.0}/src/matplotlib_multicolored_line.egg-info/top_level.txt +0 -0
|
@@ -1,6 +1,6 @@
|
|
|
1
1
|
Metadata-Version: 2.4
|
|
2
2
|
Name: matplotlib-multicolored-line
|
|
3
|
-
Version: 0.
|
|
3
|
+
Version: 0.3.0
|
|
4
4
|
Summary: Plot multicolored lines in Matplotlib
|
|
5
5
|
Author-email: 34j <34j.95a2p@simplelogin.com>
|
|
6
6
|
License-Expression: CC0-1.0
|
|
@@ -88,13 +88,22 @@ x = 0.9 * np.sin(t)
|
|
|
88
88
|
y = 0.9 * np.cos(1.6 * t)
|
|
89
89
|
|
|
90
90
|
fig, ax = plt.subplots()
|
|
91
|
-
lc = colored_line(x, y, t, ax, linewidth=
|
|
91
|
+
lc = colored_line(x, y, c=t, ax=ax, linewidth=10)
|
|
92
92
|
fig.colorbar(lc)
|
|
93
93
|
```
|
|
94
94
|
|
|
95
95
|
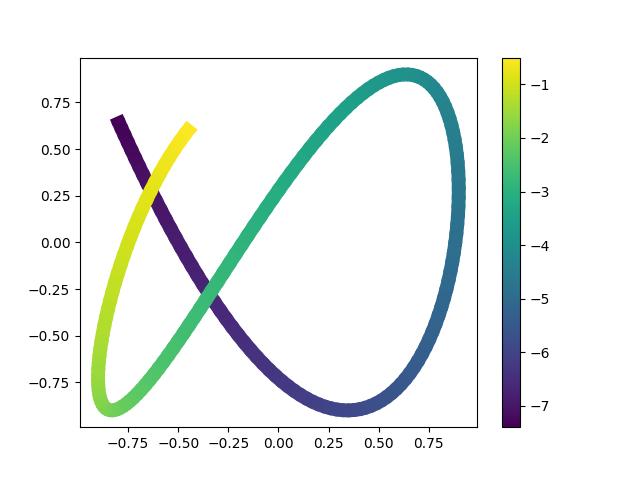
|
|
96
96
|
|
|
97
|
-
|
|
97
|
+
```python
|
|
98
|
+
y = np.random.normal(size=(5, 2))
|
|
99
|
+
c = np.random.normal(size=(5, 2))
|
|
100
|
+
|
|
101
|
+
fig, ax = plt.subplots()
|
|
102
|
+
lc = colored_line(y, c=c, ax=ax, linewidth=10)
|
|
103
|
+
fig.colorbar(lc)
|
|
104
|
+
```
|
|
105
|
+
|
|
106
|
+
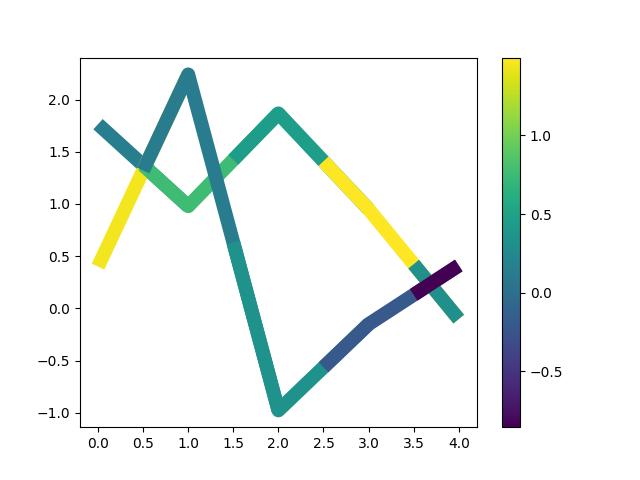
|
|
98
107
|
|
|
99
108
|
## Contributors ✨
|
|
100
109
|
|
|
@@ -62,13 +62,22 @@ x = 0.9 * np.sin(t)
|
|
|
62
62
|
y = 0.9 * np.cos(1.6 * t)
|
|
63
63
|
|
|
64
64
|
fig, ax = plt.subplots()
|
|
65
|
-
lc = colored_line(x, y, t, ax, linewidth=
|
|
65
|
+
lc = colored_line(x, y, c=t, ax=ax, linewidth=10)
|
|
66
66
|
fig.colorbar(lc)
|
|
67
67
|
```
|
|
68
68
|
|
|
69
69
|

|
|
70
70
|
|
|
71
|
-
|
|
71
|
+
```python
|
|
72
|
+
y = np.random.normal(size=(5, 2))
|
|
73
|
+
c = np.random.normal(size=(5, 2))
|
|
74
|
+
|
|
75
|
+
fig, ax = plt.subplots()
|
|
76
|
+
lc = colored_line(y, c=c, ax=ax, linewidth=10)
|
|
77
|
+
fig.colorbar(lc)
|
|
78
|
+
```
|
|
79
|
+
|
|
80
|
+

|
|
72
81
|
|
|
73
82
|
## Contributors ✨
|
|
74
83
|
|
|
@@ -0,0 +1,128 @@
|
|
|
1
|
+
from __future__ import annotations
|
|
2
|
+
|
|
3
|
+
import warnings
|
|
4
|
+
from typing import Any
|
|
5
|
+
|
|
6
|
+
import matplotlib.pyplot as plt
|
|
7
|
+
import numpy as np
|
|
8
|
+
from matplotlib.axes import Axes
|
|
9
|
+
from matplotlib.collections import LineCollection
|
|
10
|
+
from numpy.typing import ArrayLike
|
|
11
|
+
|
|
12
|
+
|
|
13
|
+
def colored_line(
|
|
14
|
+
*args: ArrayLike,
|
|
15
|
+
c: ArrayLike,
|
|
16
|
+
start: ArrayLike = 0.5,
|
|
17
|
+
end: ArrayLike = 0,
|
|
18
|
+
ax: Axes | None = None,
|
|
19
|
+
**kwargs: Any,
|
|
20
|
+
) -> LineCollection:
|
|
21
|
+
"""
|
|
22
|
+
Plot a line with a color specified along the line by a third value.
|
|
23
|
+
|
|
24
|
+
It does this by creating a collection of line segments. Each line segment is
|
|
25
|
+
made up of two straight lines each connecting the current (x, y) point to the
|
|
26
|
+
midpoints of the lines connecting the current point with its two neighbors.
|
|
27
|
+
This creates a smooth line with no gaps between the line segments.
|
|
28
|
+
|
|
29
|
+
Parameters
|
|
30
|
+
----------
|
|
31
|
+
*args : array-like
|
|
32
|
+
The horizontal and vertical coordinates of the data points
|
|
33
|
+
of shape (N,) or (N, m).
|
|
34
|
+
c : array-like or array-like of color, optional
|
|
35
|
+
The line values. Possible values:
|
|
36
|
+
- array-like of numbers of shape (N,) or (N, m) to be mapped
|
|
37
|
+
to colors using cmap and norm.
|
|
38
|
+
- array-like of numbers of shape (N, m, 3) or (N, m, 4),
|
|
39
|
+
where the last dimension is RGB or RGBA.
|
|
40
|
+
- array-like of colors of shape (N,) or (N, m).
|
|
41
|
+
ax : matplotlib.axes.Axes, optional
|
|
42
|
+
The axes to plot on. If not provided, the current axes will be used.
|
|
43
|
+
start : array-like, optional
|
|
44
|
+
The ratio of the point where the color starts.
|
|
45
|
+
Should be between 0 and 1.
|
|
46
|
+
end : array-like, optional
|
|
47
|
+
The ratio of the point where the color changes.
|
|
48
|
+
Should be between 0 and 1.
|
|
49
|
+
**kwargs : Any
|
|
50
|
+
Any additional arguments to pass to matplotlib.collections.LineCollection
|
|
51
|
+
constructor. This should not include the array keyword argument because
|
|
52
|
+
that is set to the color argument. If provided, it will be overridden.
|
|
53
|
+
|
|
54
|
+
Returns
|
|
55
|
+
-------
|
|
56
|
+
matplotlib.collections.LineCollection
|
|
57
|
+
The generated line collection representing the colored line.
|
|
58
|
+
|
|
59
|
+
"""
|
|
60
|
+
for key in ["array", "colors"]:
|
|
61
|
+
if key in kwargs:
|
|
62
|
+
warnings.warn(
|
|
63
|
+
f'The provided "{key}" keyword argument will be overridden',
|
|
64
|
+
UserWarning,
|
|
65
|
+
stacklevel=2,
|
|
66
|
+
)
|
|
67
|
+
|
|
68
|
+
# parse args
|
|
69
|
+
if len(args) == 1:
|
|
70
|
+
y = args[0]
|
|
71
|
+
x = np.arange(len(y))
|
|
72
|
+
elif len(args) == 2:
|
|
73
|
+
x, y = args
|
|
74
|
+
else:
|
|
75
|
+
raise ValueError("Invalid number of arguments. Provide either x and y or just y.")
|
|
76
|
+
|
|
77
|
+
# ensure x, y, c are 1D or 2D arrays
|
|
78
|
+
x, y, c = map(np.asarray, (x, y, c))
|
|
79
|
+
if x.ndim == 1:
|
|
80
|
+
x = x[:, None]
|
|
81
|
+
elif x.ndim == 2:
|
|
82
|
+
pass
|
|
83
|
+
else:
|
|
84
|
+
raise ValueError(f"{x.ndim=} should be 1 or 2")
|
|
85
|
+
if y.ndim == 1:
|
|
86
|
+
y = y[:, None]
|
|
87
|
+
elif y.ndim == 2:
|
|
88
|
+
pass
|
|
89
|
+
else:
|
|
90
|
+
raise ValueError(f"{y.ndim=} should be 1 or 2")
|
|
91
|
+
x, y = np.broadcast_arrays(x, y)
|
|
92
|
+
|
|
93
|
+
if c.ndim == 1:
|
|
94
|
+
c = c[:, None]
|
|
95
|
+
if c.ndim == 2:
|
|
96
|
+
c = np.broadcast_to(c, x.shape).reshape((-1,))
|
|
97
|
+
if np.issubdtype(c.dtype, np.number):
|
|
98
|
+
kwargs["array"] = c
|
|
99
|
+
else:
|
|
100
|
+
kwargs["colors"] = c
|
|
101
|
+
elif c.ndim == 3:
|
|
102
|
+
c = np.broadcast_to(c, (*x.shape, c.shape[-1])).reshape((-1, c.shape[-1]))
|
|
103
|
+
c = [tuple(c[i]) for i in range(c.shape[0])]
|
|
104
|
+
kwargs["colors"] = c
|
|
105
|
+
else:
|
|
106
|
+
raise ValueError(f"{c.ndim=} should be 2 or 3")
|
|
107
|
+
|
|
108
|
+
# (N, m, 2)
|
|
109
|
+
xy = np.stack((x, y), axis=-1)
|
|
110
|
+
# (N, m, 2)
|
|
111
|
+
xy_start = np.concat(
|
|
112
|
+
(xy[0, :, :][None, :, :], xy[:-1, :, :] * (1 - start) + xy[1:, :, :] * start), axis=0
|
|
113
|
+
)
|
|
114
|
+
xy_end = np.concat(
|
|
115
|
+
(xy[:-1, :, :] * end + xy[1:, :, :] * (1 - end), xy[-1, :][None, :, :]), axis=0
|
|
116
|
+
)
|
|
117
|
+
segments = np.stack((xy_start, xy, xy_end), axis=-2)
|
|
118
|
+
segments = np.reshape(segments, (-1, segments.shape[-2], segments.shape[-1]))
|
|
119
|
+
|
|
120
|
+
lc = LineCollection(segments, **kwargs)
|
|
121
|
+
|
|
122
|
+
# Plot the line collection to the axes
|
|
123
|
+
ax = ax or plt.gca()
|
|
124
|
+
ax.add_collection(lc)
|
|
125
|
+
ax.autoscale_view()
|
|
126
|
+
|
|
127
|
+
# Return the LineCollection object
|
|
128
|
+
return lc
|
|
@@ -1,6 +1,6 @@
|
|
|
1
1
|
Metadata-Version: 2.4
|
|
2
2
|
Name: matplotlib-multicolored-line
|
|
3
|
-
Version: 0.
|
|
3
|
+
Version: 0.3.0
|
|
4
4
|
Summary: Plot multicolored lines in Matplotlib
|
|
5
5
|
Author-email: 34j <34j.95a2p@simplelogin.com>
|
|
6
6
|
License-Expression: CC0-1.0
|
|
@@ -88,13 +88,22 @@ x = 0.9 * np.sin(t)
|
|
|
88
88
|
y = 0.9 * np.cos(1.6 * t)
|
|
89
89
|
|
|
90
90
|
fig, ax = plt.subplots()
|
|
91
|
-
lc = colored_line(x, y, t, ax, linewidth=
|
|
91
|
+
lc = colored_line(x, y, c=t, ax=ax, linewidth=10)
|
|
92
92
|
fig.colorbar(lc)
|
|
93
93
|
```
|
|
94
94
|
|
|
95
95
|

|
|
96
96
|
|
|
97
|
-
|
|
97
|
+
```python
|
|
98
|
+
y = np.random.normal(size=(5, 2))
|
|
99
|
+
c = np.random.normal(size=(5, 2))
|
|
100
|
+
|
|
101
|
+
fig, ax = plt.subplots()
|
|
102
|
+
lc = colored_line(y, c=c, ax=ax, linewidth=10)
|
|
103
|
+
fig.colorbar(lc)
|
|
104
|
+
```
|
|
105
|
+
|
|
106
|
+

|
|
98
107
|
|
|
99
108
|
## Contributors ✨
|
|
100
109
|
|
|
@@ -0,0 +1,114 @@
|
|
|
1
|
+
from collections.abc import Sequence
|
|
2
|
+
from pathlib import Path
|
|
3
|
+
|
|
4
|
+
import matplotlib.pyplot as plt
|
|
5
|
+
import numpy as np
|
|
6
|
+
import pytest
|
|
7
|
+
from numpy.typing import ArrayLike
|
|
8
|
+
|
|
9
|
+
from matplotlib_multicolored_line import colored_line
|
|
10
|
+
|
|
11
|
+
CACHE_PATH = Path(__file__).parent / ".cache"
|
|
12
|
+
|
|
13
|
+
|
|
14
|
+
@pytest.fixture(autouse=True)
|
|
15
|
+
def setup_cache() -> None:
|
|
16
|
+
CACHE_PATH.mkdir(parents=True, exist_ok=True)
|
|
17
|
+
|
|
18
|
+
|
|
19
|
+
t = np.linspace(-7.4, -0.5, 200)
|
|
20
|
+
|
|
21
|
+
|
|
22
|
+
@pytest.mark.parametrize(
|
|
23
|
+
"name, args, c",
|
|
24
|
+
[
|
|
25
|
+
("notebook1", (0.9 * np.sin(t), 0.5 * np.sin(t)), t),
|
|
26
|
+
("notebook2", ([0, 1, 2, 3, 4], [0, 1, 2, 1, 1]), [1, 2, 3, 4, 5]),
|
|
27
|
+
("singley", (np.random.normal(size=(5,)),), np.random.normal(size=(5,))),
|
|
28
|
+
("singley.rgb", (np.random.normal(size=(5,)),), np.random.normal(size=(5, 1, 3))),
|
|
29
|
+
("singley.rgba", (np.random.normal(size=(5,)),), np.random.normal(size=(5, 1, 4))),
|
|
30
|
+
(
|
|
31
|
+
"singley.colors",
|
|
32
|
+
(np.random.normal(size=(5,)),),
|
|
33
|
+
np.random.choice(["black", "red"], size=(5,)),
|
|
34
|
+
),
|
|
35
|
+
(
|
|
36
|
+
"singlexy",
|
|
37
|
+
(
|
|
38
|
+
np.random.normal(size=(5,)),
|
|
39
|
+
np.random.normal(size=(5,)),
|
|
40
|
+
),
|
|
41
|
+
np.random.normal(size=(5,)),
|
|
42
|
+
),
|
|
43
|
+
(
|
|
44
|
+
"singlexy.rgb",
|
|
45
|
+
(
|
|
46
|
+
np.random.normal(size=(5,)),
|
|
47
|
+
np.random.normal(size=(5,)),
|
|
48
|
+
),
|
|
49
|
+
np.random.normal(size=(5, 1, 3)),
|
|
50
|
+
),
|
|
51
|
+
(
|
|
52
|
+
"singlexy.rgba",
|
|
53
|
+
(
|
|
54
|
+
np.random.normal(size=(5,)),
|
|
55
|
+
np.random.normal(size=(5,)),
|
|
56
|
+
),
|
|
57
|
+
np.random.normal(size=(5, 1, 4)),
|
|
58
|
+
),
|
|
59
|
+
(
|
|
60
|
+
"singlexy.colors",
|
|
61
|
+
(
|
|
62
|
+
np.random.normal(size=(5,)),
|
|
63
|
+
np.random.normal(size=(5,)),
|
|
64
|
+
),
|
|
65
|
+
np.random.choice(["black", "red"], size=(5,)),
|
|
66
|
+
),
|
|
67
|
+
("multiy", (np.random.normal(size=(5, 2)),), np.random.normal(size=(5, 2))),
|
|
68
|
+
("multiy.rgb", (np.random.normal(size=(5, 2)),), np.random.uniform(size=(5, 2, 3))),
|
|
69
|
+
("multiy.rgba", (np.random.normal(size=(5, 2)),), np.random.uniform(size=(5, 2, 4))),
|
|
70
|
+
(
|
|
71
|
+
"multiy.colors",
|
|
72
|
+
(np.random.normal(size=(5, 2)),),
|
|
73
|
+
np.random.choice(["black", "red"], size=(5, 2)),
|
|
74
|
+
),
|
|
75
|
+
(
|
|
76
|
+
"multixy",
|
|
77
|
+
(
|
|
78
|
+
np.random.normal(size=(5, 2)),
|
|
79
|
+
np.random.normal(size=(5, 2)),
|
|
80
|
+
),
|
|
81
|
+
np.random.normal(size=(5, 2)),
|
|
82
|
+
),
|
|
83
|
+
(
|
|
84
|
+
"multixy.rgb",
|
|
85
|
+
(
|
|
86
|
+
np.random.normal(size=(5, 2)),
|
|
87
|
+
np.random.normal(size=(5, 2)),
|
|
88
|
+
),
|
|
89
|
+
np.random.uniform(size=(5, 2, 3)),
|
|
90
|
+
),
|
|
91
|
+
(
|
|
92
|
+
"multixy.rgba",
|
|
93
|
+
(
|
|
94
|
+
np.random.normal(size=(5, 2)),
|
|
95
|
+
np.random.normal(size=(5, 2)),
|
|
96
|
+
),
|
|
97
|
+
np.random.uniform(size=(5, 2, 4)),
|
|
98
|
+
),
|
|
99
|
+
(
|
|
100
|
+
"multixy.colors",
|
|
101
|
+
(
|
|
102
|
+
np.random.normal(size=(5, 2)),
|
|
103
|
+
np.random.normal(size=(5, 2)),
|
|
104
|
+
),
|
|
105
|
+
np.random.choice(["black", "red"], size=(5, 2)),
|
|
106
|
+
),
|
|
107
|
+
],
|
|
108
|
+
)
|
|
109
|
+
def test_multicolor(name: str, args: Sequence[ArrayLike], c: ArrayLike) -> None:
|
|
110
|
+
fig, ax = plt.subplots()
|
|
111
|
+
lc = colored_line(*args, c=c, ax=ax, linewidth=10)
|
|
112
|
+
if "rgb" not in name:
|
|
113
|
+
fig.colorbar(lc)
|
|
114
|
+
fig.savefig(CACHE_PATH / f"example.{name}.jpg")
|
|
@@ -1,80 +0,0 @@
|
|
|
1
|
-
from __future__ import annotations
|
|
2
|
-
|
|
3
|
-
import warnings
|
|
4
|
-
from typing import Any
|
|
5
|
-
|
|
6
|
-
import matplotlib.pyplot as plt
|
|
7
|
-
import numpy as np
|
|
8
|
-
from matplotlib.axes import Axes
|
|
9
|
-
from matplotlib.collections import LineCollection
|
|
10
|
-
from numpy.typing import ArrayLike
|
|
11
|
-
|
|
12
|
-
|
|
13
|
-
def colored_line(
|
|
14
|
-
x: ArrayLike,
|
|
15
|
-
y: ArrayLike,
|
|
16
|
-
c: ArrayLike,
|
|
17
|
-
ax: Axes | None = None,
|
|
18
|
-
scalex: bool = True,
|
|
19
|
-
scaley: bool = True,
|
|
20
|
-
**kwargs: Any,
|
|
21
|
-
) -> LineCollection:
|
|
22
|
-
"""
|
|
23
|
-
Plot a line with a color specified along the line by a third value.
|
|
24
|
-
|
|
25
|
-
It does this by creating a collection of line segments. Each line segment is
|
|
26
|
-
made up of two straight lines each connecting the current (x, y) point to the
|
|
27
|
-
midpoints of the lines connecting the current point with its two neighbors.
|
|
28
|
-
This creates a smooth line with no gaps between the line segments.
|
|
29
|
-
|
|
30
|
-
Parameters
|
|
31
|
-
----------
|
|
32
|
-
x, y : array-like
|
|
33
|
-
The horizontal and vertical coordinates of the data points.
|
|
34
|
-
c : array-like
|
|
35
|
-
The color values, which should be the same size as x and y.
|
|
36
|
-
ax : matplotlib.axes.Axes, optional
|
|
37
|
-
The axes to plot on. If not provided, the current axes will be used.
|
|
38
|
-
scalex, scaley : bool
|
|
39
|
-
These parameters determine if the view limits are adapted to the data limits.
|
|
40
|
-
The values are passed on to autoscale_view.
|
|
41
|
-
**kwargs : Any
|
|
42
|
-
Any additional arguments to pass to matplotlib.collections.LineCollection
|
|
43
|
-
constructor. This should not include the array keyword argument because
|
|
44
|
-
that is set to the color argument. If provided, it will be overridden.
|
|
45
|
-
|
|
46
|
-
Returns
|
|
47
|
-
-------
|
|
48
|
-
matplotlib.collections.LineCollection
|
|
49
|
-
The generated line collection representing the colored line.
|
|
50
|
-
|
|
51
|
-
"""
|
|
52
|
-
if "array" in kwargs:
|
|
53
|
-
warnings.warn(
|
|
54
|
-
'The provided "array" keyword argument will be overridden',
|
|
55
|
-
UserWarning,
|
|
56
|
-
stacklevel=2,
|
|
57
|
-
)
|
|
58
|
-
|
|
59
|
-
xy = np.stack((x, y), axis=-1)
|
|
60
|
-
xy_mid = np.concat(
|
|
61
|
-
(xy[0, :][None, :], (xy[:-1, :] + xy[1:, :]) / 2, xy[-1, :][None, :]), axis=0
|
|
62
|
-
)
|
|
63
|
-
segments = np.stack((xy_mid[:-1, :], xy, xy_mid[1:, :]), axis=-2)
|
|
64
|
-
# Note that segments is [
|
|
65
|
-
# [[x[0], y[0]], [x[0], y[0]], [mean(x[0], x[1]), mean(y[0], y[1])]],
|
|
66
|
-
# [[mean(x[0], x[1]), mean(y[0], y[1])], [x[1], y[1]], [mean(x[1], x[2]), mean(y[1], y[2])]],
|
|
67
|
-
# ...
|
|
68
|
-
# [[mean(x[-2], x[-1]), mean(y[-2], y[-1])], [x[-1], y[-1]], [x[-1], y[-1]]]
|
|
69
|
-
# ]
|
|
70
|
-
|
|
71
|
-
kwargs["array"] = c
|
|
72
|
-
lc = LineCollection(segments, **kwargs)
|
|
73
|
-
|
|
74
|
-
# Plot the line collection to the axes
|
|
75
|
-
ax = ax or plt.gca()
|
|
76
|
-
ax.add_collection(lc)
|
|
77
|
-
ax.autoscale_view(scalex=scalex, scaley=scaley)
|
|
78
|
-
|
|
79
|
-
# Return the LineCollection object
|
|
80
|
-
return lc
|
|
@@ -1,36 +0,0 @@
|
|
|
1
|
-
from pathlib import Path
|
|
2
|
-
|
|
3
|
-
import matplotlib.pyplot as plt
|
|
4
|
-
import numpy as np
|
|
5
|
-
import pytest
|
|
6
|
-
|
|
7
|
-
from matplotlib_multicolored_line import colored_line
|
|
8
|
-
|
|
9
|
-
CACHE_PATH = Path(__file__).parent / ".cache"
|
|
10
|
-
|
|
11
|
-
|
|
12
|
-
@pytest.fixture(autouse=True)
|
|
13
|
-
def setup_cache() -> None:
|
|
14
|
-
CACHE_PATH.mkdir(parents=True, exist_ok=True)
|
|
15
|
-
|
|
16
|
-
|
|
17
|
-
def test_main() -> None:
|
|
18
|
-
t = np.linspace(-7.4, -0.5, 200)
|
|
19
|
-
x = 0.9 * np.sin(t)
|
|
20
|
-
y = 0.9 * np.cos(1.6 * t)
|
|
21
|
-
|
|
22
|
-
fig, ax = plt.subplots()
|
|
23
|
-
lc = colored_line(x, y, t, ax, linewidth=10)
|
|
24
|
-
fig.colorbar(lc)
|
|
25
|
-
fig.savefig(CACHE_PATH / "example.jpg")
|
|
26
|
-
|
|
27
|
-
|
|
28
|
-
def test_main_small() -> None:
|
|
29
|
-
x = [0, 1, 2, 3, 4]
|
|
30
|
-
y = [0, 1, 2, 1, 1]
|
|
31
|
-
c = [1, 2, 3, 4, 5]
|
|
32
|
-
|
|
33
|
-
fig, ax = plt.subplots()
|
|
34
|
-
lc = colored_line(x, y, c, ax, linewidth=10)
|
|
35
|
-
fig.colorbar(lc)
|
|
36
|
-
fig.savefig(CACHE_PATH / "example_small.jpg")
|
|
File without changes
|
|
File without changes
|
|
File without changes
|
|
File without changes
|
|
File without changes
|
|
File without changes
|
|
File without changes
|