matplotlib-multicolored-line 0.1.1__tar.gz → 0.2.0__tar.gz
This diff represents the content of publicly available package versions that have been released to one of the supported registries. The information contained in this diff is provided for informational purposes only and reflects changes between package versions as they appear in their respective public registries.
- {matplotlib_multicolored_line-0.1.1 → matplotlib_multicolored_line-0.2.0}/PKG-INFO +12 -3
- {matplotlib_multicolored_line-0.1.1 → matplotlib_multicolored_line-0.2.0}/README.md +11 -2
- {matplotlib_multicolored_line-0.1.1 → matplotlib_multicolored_line-0.2.0}/pyproject.toml +1 -1
- {matplotlib_multicolored_line-0.1.1 → matplotlib_multicolored_line-0.2.0}/src/matplotlib_multicolored_line/__init__.py +1 -1
- {matplotlib_multicolored_line-0.1.1 → matplotlib_multicolored_line-0.2.0}/src/matplotlib_multicolored_line/_main.py +40 -20
- {matplotlib_multicolored_line-0.1.1 → matplotlib_multicolored_line-0.2.0}/src/matplotlib_multicolored_line.egg-info/PKG-INFO +12 -3
- {matplotlib_multicolored_line-0.1.1 → matplotlib_multicolored_line-0.2.0}/tests/test_main.py +13 -2
- {matplotlib_multicolored_line-0.1.1 → matplotlib_multicolored_line-0.2.0}/LICENSE +0 -0
- {matplotlib_multicolored_line-0.1.1 → matplotlib_multicolored_line-0.2.0}/setup.cfg +0 -0
- {matplotlib_multicolored_line-0.1.1 → matplotlib_multicolored_line-0.2.0}/setup.py +0 -0
- {matplotlib_multicolored_line-0.1.1 → matplotlib_multicolored_line-0.2.0}/src/matplotlib_multicolored_line/py.typed +0 -0
- {matplotlib_multicolored_line-0.1.1 → matplotlib_multicolored_line-0.2.0}/src/matplotlib_multicolored_line.egg-info/SOURCES.txt +0 -0
- {matplotlib_multicolored_line-0.1.1 → matplotlib_multicolored_line-0.2.0}/src/matplotlib_multicolored_line.egg-info/dependency_links.txt +0 -0
- {matplotlib_multicolored_line-0.1.1 → matplotlib_multicolored_line-0.2.0}/src/matplotlib_multicolored_line.egg-info/requires.txt +0 -0
- {matplotlib_multicolored_line-0.1.1 → matplotlib_multicolored_line-0.2.0}/src/matplotlib_multicolored_line.egg-info/top_level.txt +0 -0
|
@@ -1,6 +1,6 @@
|
|
|
1
1
|
Metadata-Version: 2.4
|
|
2
2
|
Name: matplotlib-multicolored-line
|
|
3
|
-
Version: 0.
|
|
3
|
+
Version: 0.2.0
|
|
4
4
|
Summary: Plot multicolored lines in Matplotlib
|
|
5
5
|
Author-email: 34j <34j.95a2p@simplelogin.com>
|
|
6
6
|
License-Expression: CC0-1.0
|
|
@@ -88,13 +88,22 @@ x = 0.9 * np.sin(t)
|
|
|
88
88
|
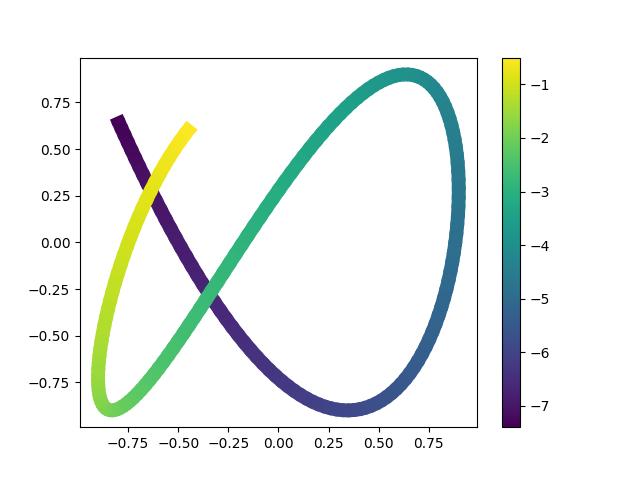
y = 0.9 * np.cos(1.6 * t)
|
|
89
89
|
|
|
90
90
|
fig, ax = plt.subplots()
|
|
91
|
-
lc = colored_line(x, y, t, ax, linewidth=
|
|
91
|
+
lc = colored_line(x, y, c=t, ax=ax, linewidth=10)
|
|
92
92
|
fig.colorbar(lc)
|
|
93
93
|
```
|
|
94
94
|
|
|
95
95
|
|
|
96
96
|
|
|
97
|
-
|
|
97
|
+
```python
|
|
98
|
+
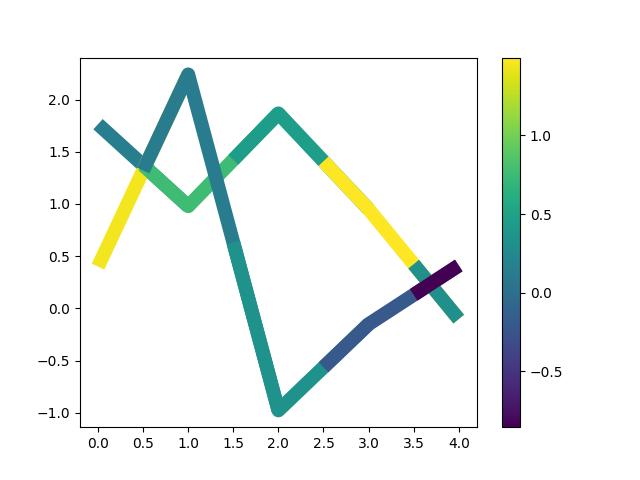
y = np.random.normal(size=(5, 2))
|
|
99
|
+
c = np.random.normal(size=(5, 2))
|
|
100
|
+
|
|
101
|
+
fig, ax = plt.subplots()
|
|
102
|
+
lc = colored_line(y, c=c, ax=ax, linewidth=10)
|
|
103
|
+
fig.colorbar(lc)
|
|
104
|
+
```
|
|
105
|
+
|
|
106
|
+
|
|
98
107
|
|
|
99
108
|
## Contributors ✨
|
|
100
109
|
|
|
@@ -62,13 +62,22 @@ x = 0.9 * np.sin(t)
|
|
|
62
62
|
y = 0.9 * np.cos(1.6 * t)
|
|
63
63
|
|
|
64
64
|
fig, ax = plt.subplots()
|
|
65
|
-
lc = colored_line(x, y, t, ax, linewidth=
|
|
65
|
+
lc = colored_line(x, y, c=t, ax=ax, linewidth=10)
|
|
66
66
|
fig.colorbar(lc)
|
|
67
67
|
```
|
|
68
68
|
|
|
69
69
|

|
|
70
70
|
|
|
71
|
-
|
|
71
|
+
```python
|
|
72
|
+
y = np.random.normal(size=(5, 2))
|
|
73
|
+
c = np.random.normal(size=(5, 2))
|
|
74
|
+
|
|
75
|
+
fig, ax = plt.subplots()
|
|
76
|
+
lc = colored_line(y, c=c, ax=ax, linewidth=10)
|
|
77
|
+
fig.colorbar(lc)
|
|
78
|
+
```
|
|
79
|
+
|
|
80
|
+

|
|
72
81
|
|
|
73
82
|
## Contributors ✨
|
|
74
83
|
|
|
@@ -11,12 +11,11 @@ from numpy.typing import ArrayLike
|
|
|
11
11
|
|
|
12
12
|
|
|
13
13
|
def colored_line(
|
|
14
|
-
|
|
15
|
-
y: ArrayLike,
|
|
14
|
+
*args: ArrayLike,
|
|
16
15
|
c: ArrayLike,
|
|
16
|
+
start: ArrayLike = 0.5,
|
|
17
|
+
end: ArrayLike = 0,
|
|
17
18
|
ax: Axes | None = None,
|
|
18
|
-
scalex: bool = True,
|
|
19
|
-
scaley: bool = True,
|
|
20
19
|
**kwargs: Any,
|
|
21
20
|
) -> LineCollection:
|
|
22
21
|
"""
|
|
@@ -29,15 +28,19 @@ def colored_line(
|
|
|
29
28
|
|
|
30
29
|
Parameters
|
|
31
30
|
----------
|
|
32
|
-
|
|
33
|
-
The horizontal and vertical coordinates of the data points
|
|
31
|
+
*args : array-like
|
|
32
|
+
The horizontal and vertical coordinates of the data points
|
|
33
|
+
of shape (N,) or (N, m).
|
|
34
34
|
c : array-like
|
|
35
35
|
The color values, which should be the same size as x and y.
|
|
36
36
|
ax : matplotlib.axes.Axes, optional
|
|
37
37
|
The axes to plot on. If not provided, the current axes will be used.
|
|
38
|
-
|
|
39
|
-
|
|
40
|
-
|
|
38
|
+
start : array-like, optional
|
|
39
|
+
The ratio of the point where the color starts.
|
|
40
|
+
Should be between 0 and 1.
|
|
41
|
+
end : array-like, optional
|
|
42
|
+
The ratio of the point where the color changes.
|
|
43
|
+
Should be between 0 and 1.
|
|
41
44
|
**kwargs : Any
|
|
42
45
|
Any additional arguments to pass to matplotlib.collections.LineCollection
|
|
43
46
|
constructor. This should not include the array keyword argument because
|
|
@@ -56,25 +59,42 @@ def colored_line(
|
|
|
56
59
|
stacklevel=2,
|
|
57
60
|
)
|
|
58
61
|
|
|
62
|
+
# parse args
|
|
63
|
+
if len(args) == 1:
|
|
64
|
+
y = args[0]
|
|
65
|
+
x = np.arange(len(y))
|
|
66
|
+
elif len(args) == 2:
|
|
67
|
+
x, y = args
|
|
68
|
+
else:
|
|
69
|
+
raise ValueError("Invalid number of arguments. Provide either x and y or just y.")
|
|
70
|
+
|
|
71
|
+
# ensure x, y, c are 1D or 2D arrays
|
|
72
|
+
x, y, c = map(np.asarray, (x, y, c))
|
|
73
|
+
if x.ndim == 1:
|
|
74
|
+
x = x[:, None]
|
|
75
|
+
if y.ndim == 1:
|
|
76
|
+
y = y[:, None]
|
|
77
|
+
x, y = np.broadcast_arrays(x, y)
|
|
78
|
+
|
|
79
|
+
# (N, m, 2)
|
|
59
80
|
xy = np.stack((x, y), axis=-1)
|
|
60
|
-
|
|
61
|
-
|
|
81
|
+
# (N, m, 2)
|
|
82
|
+
xy_start = np.concat(
|
|
83
|
+
(xy[0, :, :][None, :, :], xy[:-1, :, :] * (1 - start) + xy[1:, :, :] * start), axis=0
|
|
84
|
+
)
|
|
85
|
+
xy_end = np.concat(
|
|
86
|
+
(xy[:-1, :, :] * end + xy[1:, :, :] * (1 - end), xy[-1, :][None, :, :]), axis=0
|
|
62
87
|
)
|
|
63
|
-
segments = np.stack((
|
|
64
|
-
|
|
65
|
-
# [[x[0], y[0]], [x[0], y[0]], [mean(x[0], x[1]), mean(y[0], y[1])]],
|
|
66
|
-
# [[mean(x[0], x[1]), mean(y[0], y[1])], [x[1], y[1]], [mean(x[1], x[2]), mean(y[1], y[2])]],
|
|
67
|
-
# ...
|
|
68
|
-
# [[mean(x[-2], x[-1]), mean(y[-2], y[-1])], [x[-1], y[-1]], [x[-1], y[-1]]]
|
|
69
|
-
# ]
|
|
88
|
+
segments = np.stack((xy_start, xy, xy_end), axis=-2)
|
|
89
|
+
segments = np.reshape(segments, (-1, segments.shape[-2], segments.shape[-1]))
|
|
70
90
|
|
|
71
|
-
kwargs["array"] = c
|
|
91
|
+
kwargs["array"] = c.reshape(-1)
|
|
72
92
|
lc = LineCollection(segments, **kwargs)
|
|
73
93
|
|
|
74
94
|
# Plot the line collection to the axes
|
|
75
95
|
ax = ax or plt.gca()
|
|
76
96
|
ax.add_collection(lc)
|
|
77
|
-
ax.autoscale_view(
|
|
97
|
+
ax.autoscale_view()
|
|
78
98
|
|
|
79
99
|
# Return the LineCollection object
|
|
80
100
|
return lc
|
|
@@ -1,6 +1,6 @@
|
|
|
1
1
|
Metadata-Version: 2.4
|
|
2
2
|
Name: matplotlib-multicolored-line
|
|
3
|
-
Version: 0.
|
|
3
|
+
Version: 0.2.0
|
|
4
4
|
Summary: Plot multicolored lines in Matplotlib
|
|
5
5
|
Author-email: 34j <34j.95a2p@simplelogin.com>
|
|
6
6
|
License-Expression: CC0-1.0
|
|
@@ -88,13 +88,22 @@ x = 0.9 * np.sin(t)
|
|
|
88
88
|
y = 0.9 * np.cos(1.6 * t)
|
|
89
89
|
|
|
90
90
|
fig, ax = plt.subplots()
|
|
91
|
-
lc = colored_line(x, y, t, ax, linewidth=
|
|
91
|
+
lc = colored_line(x, y, c=t, ax=ax, linewidth=10)
|
|
92
92
|
fig.colorbar(lc)
|
|
93
93
|
```
|
|
94
94
|
|
|
95
95
|

|
|
96
96
|
|
|
97
|
-
|
|
97
|
+
```python
|
|
98
|
+
y = np.random.normal(size=(5, 2))
|
|
99
|
+
c = np.random.normal(size=(5, 2))
|
|
100
|
+
|
|
101
|
+
fig, ax = plt.subplots()
|
|
102
|
+
lc = colored_line(y, c=c, ax=ax, linewidth=10)
|
|
103
|
+
fig.colorbar(lc)
|
|
104
|
+
```
|
|
105
|
+
|
|
106
|
+

|
|
98
107
|
|
|
99
108
|
## Contributors ✨
|
|
100
109
|
|
{matplotlib_multicolored_line-0.1.1 → matplotlib_multicolored_line-0.2.0}/tests/test_main.py
RENAMED
|
@@ -20,7 +20,7 @@ def test_main() -> None:
|
|
|
20
20
|
y = 0.9 * np.cos(1.6 * t)
|
|
21
21
|
|
|
22
22
|
fig, ax = plt.subplots()
|
|
23
|
-
lc = colored_line(x, y, t, ax, linewidth=10)
|
|
23
|
+
lc = colored_line(x, y, c=t, ax=ax, linewidth=10)
|
|
24
24
|
fig.colorbar(lc)
|
|
25
25
|
fig.savefig(CACHE_PATH / "example.jpg")
|
|
26
26
|
|
|
@@ -31,6 +31,17 @@ def test_main_small() -> None:
|
|
|
31
31
|
c = [1, 2, 3, 4, 5]
|
|
32
32
|
|
|
33
33
|
fig, ax = plt.subplots()
|
|
34
|
-
lc = colored_line(x, y, c, ax, linewidth=10)
|
|
34
|
+
lc = colored_line(x, y, c=c, ax=ax, linewidth=10)
|
|
35
35
|
fig.colorbar(lc)
|
|
36
36
|
fig.savefig(CACHE_PATH / "example_small.jpg")
|
|
37
|
+
|
|
38
|
+
|
|
39
|
+
def test_multiple() -> None:
|
|
40
|
+
np.random.seed(0)
|
|
41
|
+
y = np.random.normal(size=(5, 2))
|
|
42
|
+
c = np.random.normal(size=(5, 2))
|
|
43
|
+
|
|
44
|
+
fig, ax = plt.subplots()
|
|
45
|
+
lc = colored_line(y, c=c, ax=ax, linewidth=10)
|
|
46
|
+
fig.colorbar(lc)
|
|
47
|
+
fig.savefig(CACHE_PATH / "example_multiple.jpg")
|
|
File without changes
|
|
File without changes
|
|
File without changes
|
|
File without changes
|
|
File without changes
|
|
File without changes
|
|
File without changes
|