manim-radar 0.1.0__tar.gz
This diff represents the content of publicly available package versions that have been released to one of the supported registries. The information contained in this diff is provided for informational purposes only and reflects changes between package versions as they appear in their respective public registries.
- manim_radar-0.1.0/.gitignore +14 -0
- manim_radar-0.1.0/CHANGELOG.md +38 -0
- manim_radar-0.1.0/LICENSE +21 -0
- manim_radar-0.1.0/PKG-INFO +272 -0
- manim_radar-0.1.0/README.md +238 -0
- manim_radar-0.1.0/README.zh-CN.md +228 -0
- manim_radar-0.1.0/examples/01_quickstart.py +37 -0
- manim_radar-0.1.0/examples/02_morph_gallery.py +43 -0
- manim_radar-0.1.0/examples/03_reel.py +42 -0
- manim_radar-0.1.0/examples/04_styles_themes.py +39 -0
- manim_radar-0.1.0/examples/05_two_styles.py +44 -0
- manim_radar-0.1.0/examples/legacy_v1.py +19 -0
- manim_radar-0.1.0/examples/legacy_v2.py +19 -0
- manim_radar-0.1.0/pyproject.toml +78 -0
- manim_radar-0.1.0/src/manim_radar/__init__.py +77 -0
- manim_radar-0.1.0/src/manim_radar/animations.py +473 -0
- manim_radar-0.1.0/src/manim_radar/backdrop.py +213 -0
- manim_radar-0.1.0/src/manim_radar/chart.py +779 -0
- manim_radar-0.1.0/src/manim_radar/cli.py +141 -0
- manim_radar-0.1.0/src/manim_radar/config.py +255 -0
- manim_radar-0.1.0/src/manim_radar/data.py +141 -0
- manim_radar-0.1.0/src/manim_radar/legacy.py +158 -0
- manim_radar-0.1.0/src/manim_radar/numbers.py +157 -0
- manim_radar-0.1.0/src/manim_radar/reel.py +174 -0
- manim_radar-0.1.0/src/manim_radar/theme.py +145 -0
- manim_radar-0.1.0/src/manim_radar/utils.py +102 -0
- manim_radar-0.1.0/tests/test_smoke.py +339 -0
|
@@ -0,0 +1,38 @@
|
|
|
1
|
+
# Changelog
|
|
2
|
+
|
|
3
|
+
All notable changes to `manim-radar` are documented here.
|
|
4
|
+
The format follows [Keep a Changelog](https://keepachangelog.com/en/1.1.0/)
|
|
5
|
+
and the project uses [Semantic Versioning](https://semver.org/spec/v2.0.0.html).
|
|
6
|
+
|
|
7
|
+
## [Unreleased]
|
|
8
|
+
|
|
9
|
+
## [0.1.0] — 2026-09-21
|
|
10
|
+
|
|
11
|
+
First release.
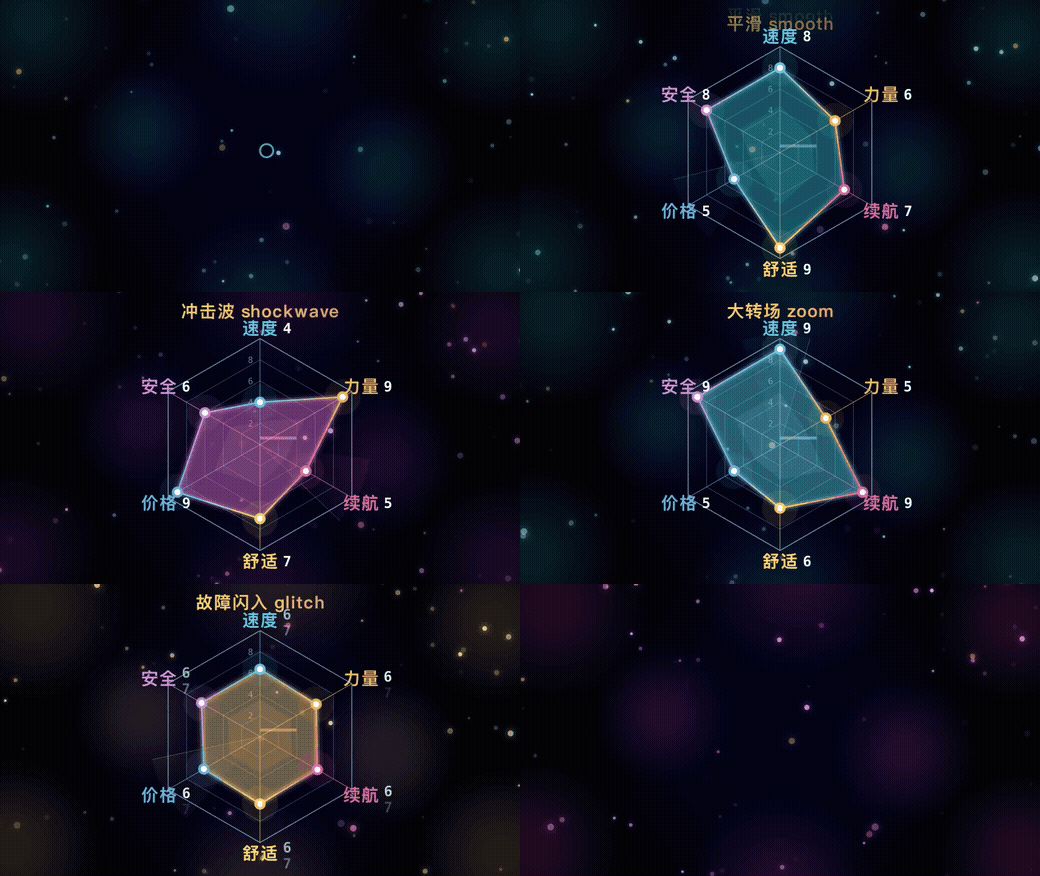
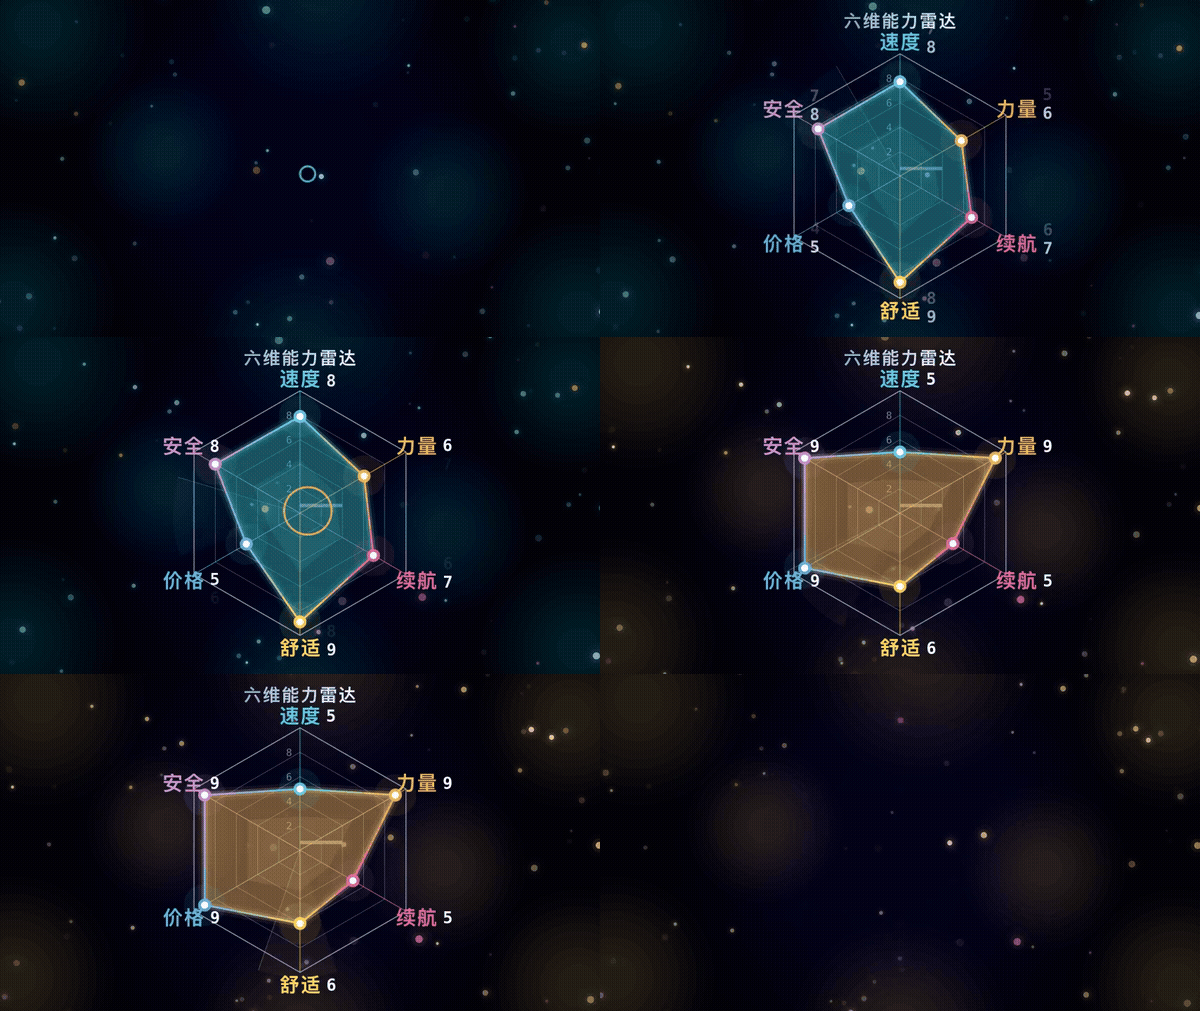
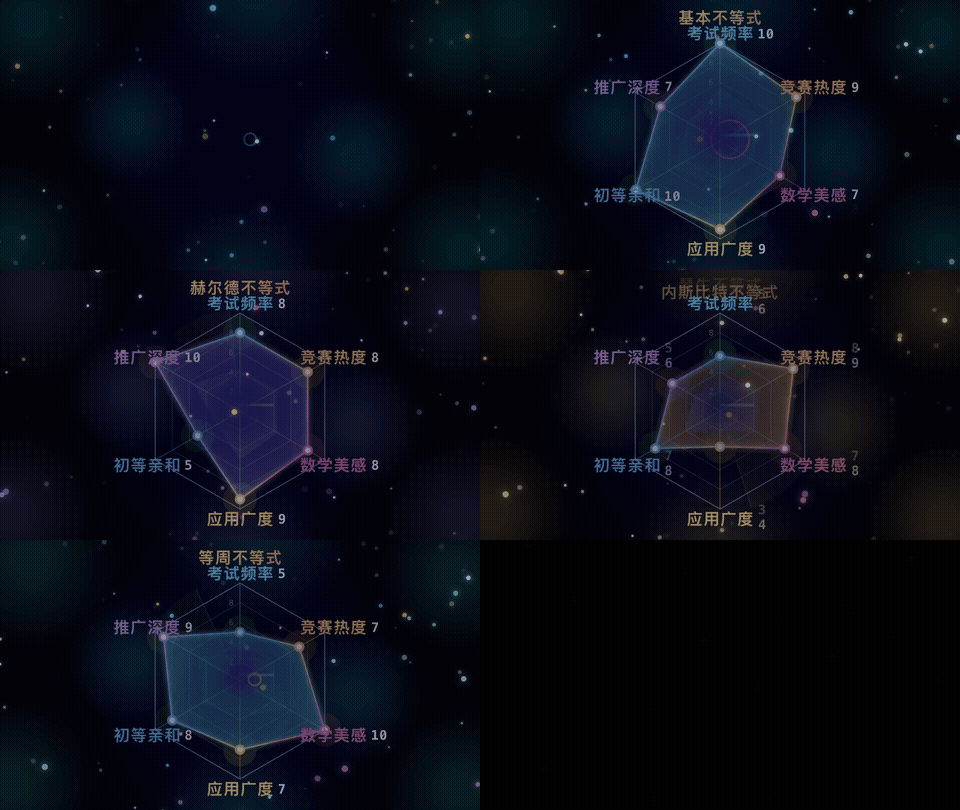
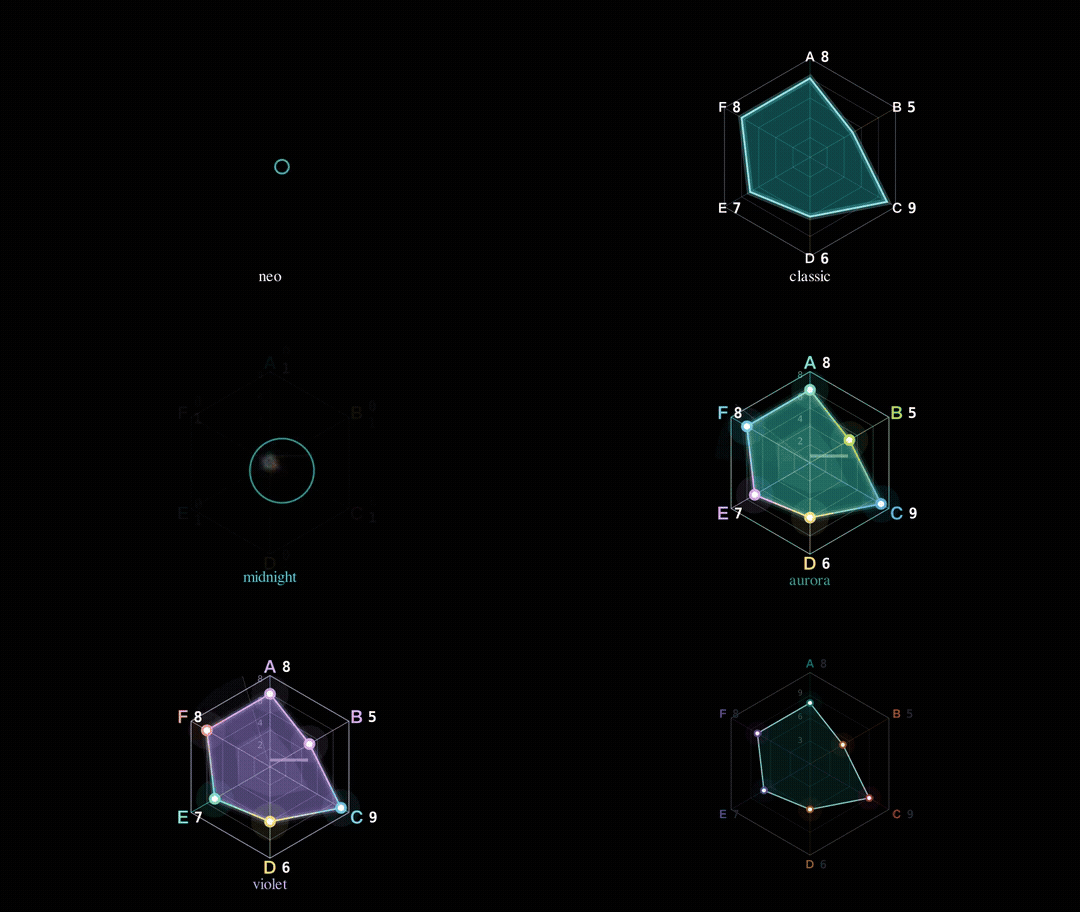
|
|
12
|
+
|
|
13
|
+
### Added
|
|
14
|
+
|
|
15
|
+
- `RadarChart` — an animated radar/spider chart as a real Manim `VGroup`
|
|
16
|
+
(supports `shift` / `move_to` / `scale` / `rotate` / `FadeIn` / `FadeOut`).
|
|
17
|
+
- `RadarData` — immutable snapshot model with axes, values, name, colour,
|
|
18
|
+
full scale, emphasis, hold and per-snapshot transition overrides.
|
|
19
|
+
- `RadarChart.morph_to(...)` — one command tweens values, full scale, colour,
|
|
20
|
+
emphasis outline, opacity and nameplate in a single pass.
|
|
21
|
+
- Six transition presets: `smooth`, `dip`, `shockwave`, `zoom`, `glitch`, `stepped`.
|
|
22
|
+
- `RadarReel` — plays a whole list of snapshots (with black gaps) in one call.
|
|
23
|
+
- `RadarReveal`, `RadarFade`, `GlitchFlash` and `Shockwave` animations.
|
|
24
|
+
- `RollingNumber` — odometer-style value read-out with overflow labels (`10+`).
|
|
25
|
+
- `DeepSpace` — radial glow + corner vignette + nebula blobs + drifting stars,
|
|
26
|
+
tinted by the chart colour.
|
|
27
|
+
- Three style presets (`neo`, `classic`, `minimal`) and five themes
|
|
28
|
+
(`midnight`, `aurora`, `ember`, `violet`, `paper`).
|
|
29
|
+
- `RadarConfig` (~60 fields) and `RadarTheme` for full customisation.
|
|
30
|
+
- Legacy generations rebuilt on the library: `RadarV1Scene` (1.0) and
|
|
31
|
+
`RadarV2Scene` (2.0), playing the bundled 23-snapshot demo reel.
|
|
32
|
+
- Cross-platform font fallback (`PingFang SC` → `Microsoft YaHei` → `Noto Sans CJK` …).
|
|
33
|
+
- `manim-radar` CLI: `themes`, `styles`, `template`, `demo --render`.
|
|
34
|
+
- Manim plugin entry point (`manim.plugins`) and example scenes under `examples/`.
|
|
35
|
+
- Test suite (41 tests) that runs without rendering.
|
|
36
|
+
|
|
37
|
+
[Unreleased]: https://github.com/FTZ-OPUS/manim-radar/compare/v0.1.0...HEAD
|
|
38
|
+
[0.1.0]: https://github.com/FTZ-OPUS/manim-radar/releases/tag/v0.1.0
|
|
@@ -0,0 +1,21 @@
|
|
|
1
|
+
MIT License
|
|
2
|
+
|
|
3
|
+
Copyright (c) 2026 FTZ-OPUS
|
|
4
|
+
|
|
5
|
+
Permission is hereby granted, free of charge, to any person obtaining a copy
|
|
6
|
+
of this software and associated documentation files (the "Software"), to deal
|
|
7
|
+
in the Software without restriction, including without limitation the rights
|
|
8
|
+
to use, copy, modify, merge, publish, distribute, sublicense, and/or sell
|
|
9
|
+
copies of the Software, and to permit persons to whom the Software is
|
|
10
|
+
furnished to do so, subject to the following conditions:
|
|
11
|
+
|
|
12
|
+
The above copyright notice and this permission notice shall be included in all
|
|
13
|
+
copies or substantial portions of the Software.
|
|
14
|
+
|
|
15
|
+
THE SOFTWARE IS PROVIDED "AS IS", WITHOUT WARRANTY OF ANY KIND, EXPRESS OR
|
|
16
|
+
IMPLIED, INCLUDING BUT NOT LIMITED TO THE WARRANTIES OF MERCHANTABILITY,
|
|
17
|
+
FITNESS FOR A PARTICULAR PURPOSE AND NONINFRINGEMENT. IN NO EVENT SHALL THE
|
|
18
|
+
AUTHORS OR COPYRIGHT HOLDERS BE LIABLE FOR ANY CLAIM, DAMAGES OR OTHER
|
|
19
|
+
LIABILITY, WHETHER IN AN ACTION OF CONTRACT, TORT OR OTHERWISE, ARISING FROM,
|
|
20
|
+
OUT OF OR IN CONNECTION WITH THE SOFTWARE OR THE USE OR OTHER DEALINGS IN THE
|
|
21
|
+
SOFTWARE.
|
|
@@ -0,0 +1,272 @@
|
|
|
1
|
+
Metadata-Version: 2.5
|
|
2
|
+
Name: manim_radar
|
|
3
|
+
Version: 0.1.0
|
|
4
|
+
Summary: Animated radar (spider) charts for Manim — build, morph and play whole radar-chart sequences with one line of code.
|
|
5
|
+
Project-URL: Homepage, https://github.com/FTZ-OPUS/manim-radar
|
|
6
|
+
Project-URL: Repository, https://github.com/FTZ-OPUS/manim-radar
|
|
7
|
+
Project-URL: Issues, https://github.com/FTZ-OPUS/manim-radar/issues
|
|
8
|
+
Project-URL: Changelog, https://github.com/FTZ-OPUS/manim-radar/blob/main/CHANGELOG.md
|
|
9
|
+
Author-email: FTZ-OPUS <1710644976@qq.com>
|
|
10
|
+
License: MIT
|
|
11
|
+
License-File: LICENSE
|
|
12
|
+
Keywords: animation,data-visualization,education,manim,manim-plugin,morph,radar-chart,spider-chart,web-chart
|
|
13
|
+
Classifier: Development Status :: 4 - Beta
|
|
14
|
+
Classifier: Intended Audience :: Education
|
|
15
|
+
Classifier: Intended Audience :: Science/Research
|
|
16
|
+
Classifier: License :: OSI Approved :: MIT License
|
|
17
|
+
Classifier: Programming Language :: Python :: 3
|
|
18
|
+
Classifier: Programming Language :: Python :: 3.9
|
|
19
|
+
Classifier: Programming Language :: Python :: 3.10
|
|
20
|
+
Classifier: Programming Language :: Python :: 3.11
|
|
21
|
+
Classifier: Programming Language :: Python :: 3.12
|
|
22
|
+
Classifier: Programming Language :: Python :: 3.13
|
|
23
|
+
Classifier: Topic :: Multimedia :: Graphics
|
|
24
|
+
Classifier: Topic :: Multimedia :: Video
|
|
25
|
+
Classifier: Topic :: Scientific/Engineering :: Visualization
|
|
26
|
+
Requires-Python: >=3.9
|
|
27
|
+
Requires-Dist: manim>=0.18
|
|
28
|
+
Requires-Dist: numpy>=1.23
|
|
29
|
+
Provides-Extra: dev
|
|
30
|
+
Requires-Dist: pytest>=7.0; extra == 'dev'
|
|
31
|
+
Provides-Extra: docs
|
|
32
|
+
Requires-Dist: pillow>=9.5; extra == 'docs'
|
|
33
|
+
Description-Content-Type: text/markdown
|
|
34
|
+
|
|
35
|
+
# manim-radar
|
|
36
|
+
|
|
37
|
+
**Animated radar (spider) charts for [Manim](https://www.manim.community/) — build one, morph it into another, or play a whole sequence with a single command.**
|
|
38
|
+
|
|
39
|
+
[](https://pypi.org/project/manim-radar/)
|
|
40
|
+
[](https://pypi.org/project/manim-radar/)
|
|
41
|
+
[](LICENSE)
|
|
42
|
+
[](https://github.com/FTZ-OPUS/manim-radar/actions/workflows/ci.yml)
|
|
43
|
+
|
|
44
|
+
|
|
45
|
+
|
|
46
|
+
```python
|
|
47
|
+
from manim import *
|
|
48
|
+
from manim_radar import RadarChart, DeepSpace, set_scene_background
|
|
49
|
+
|
|
50
|
+
AXES = ["Speed", "Power", "Range", "Comfort", "Price", "Safety"]
|
|
51
|
+
|
|
52
|
+
class Demo(Scene):
|
|
53
|
+
def construct(self):
|
|
54
|
+
set_scene_background("midnight")
|
|
55
|
+
chart = RadarChart(axes=AXES, values=[8, 6, 7, 9, 5, 8], title="Six axes")
|
|
56
|
+
|
|
57
|
+
self.add(DeepSpace().link(chart)) # optional starfield
|
|
58
|
+
self.play(chart.reveal()) # grow out of the centre
|
|
59
|
+
self.play(chart.morph_to([5, 9, 5, 6, 9, 9], # one command = one morph
|
|
60
|
+
color="#FFB74D"))
|
|
61
|
+
self.play(chart.disappear())
|
|
62
|
+
```
|
|
63
|
+
|
|
64
|
+
```bash
|
|
65
|
+
manim -qh demo.py Demo # 1080p60
|
|
66
|
+
```
|
|
67
|
+
|
|
68
|
+
---
|
|
69
|
+
|
|
70
|
+
## Install
|
|
71
|
+
|
|
72
|
+
```bash
|
|
73
|
+
pip install manim_radar
|
|
74
|
+
```
|
|
75
|
+
|
|
76
|
+
Requires Python ≥ 3.9, `manim >= 0.18` and `numpy`. `pip` pulls those in for you.
|
|
77
|
+
|
|
78
|
+
## Features
|
|
79
|
+
|
|
80
|
+
| | |
|
|
81
|
+
|---|---|
|
|
82
|
+
| **One command morphing** | `chart.morph_to(...)` tweens values, full scale, colour, emphasis outline and opacity in a single pass |
|
|
83
|
+
| **Six transition presets** | `smooth`, `dip`, `shockwave`, `zoom`, `glitch`, `stepped` — plus every knob to fine-tune them |
|
|
84
|
+
| **One command sequences** | `RadarReel(chart, snapshots).play_on(self)` plays a whole reel, black gaps included |
|
|
85
|
+
| **3 styles × 5 themes** | `neo` (glow / rainbow outline / sweep beam), `classic` (the lean 1.0 look), `minimal` (light themes, reports) |
|
|
86
|
+
| **Odometer numbers** | digits roll continuously instead of snapping, with automatic `10+` overflow labels |
|
|
87
|
+
| **Real Manim mobjects** | the chart is a `VGroup`: `shift` / `move_to` / `scale` / `rotate` / `FadeIn` / `FadeOut` all behave |
|
|
88
|
+
| **Deep-space backdrop** | `DeepSpace` adds a radial glow, corner vignette, nebula blobs and drifting stars that tint with the chart |
|
|
89
|
+
| **Two generations included** | `RadarV1Scene` and `RadarV2Scene` rebuild the original 1.0 and 2.0 reels from the library |
|
|
90
|
+
| **Cross-platform fonts** | picks the first installed CJK / monospace font, works on macOS, Linux and Windows |
|
|
91
|
+
|
|
92
|
+
## Demos
|
|
93
|
+
|
|
94
|
+
Every GIF below was rendered straight from the matching example scene
|
|
95
|
+
(`manim -ql` + `ffmpeg`); they all live in [`docs/`](docs/).
|
|
96
|
+
|
|
97
|
+
| | |
|
|
98
|
+
|---|---|
|
|
99
|
+
|  | **Quickstart** — build → reveal → morph → fade, in ten lines. `examples/01_quickstart.py` |
|
|
100
|
+
|  | **Transitions** — smooth / shockwave / zoom / glitch / rim. `examples/02_morph_gallery.py` |
|
|
101
|
+
|  | **One-command reel** — a whole sequence, black gap included. `examples/03_reel.py` |
|
|
102
|
+
|  | **3 styles × 5 themes** — from `neo` glow to a light `paper` report. `examples/04_styles_themes.py` |
|
|
103
|
+
| 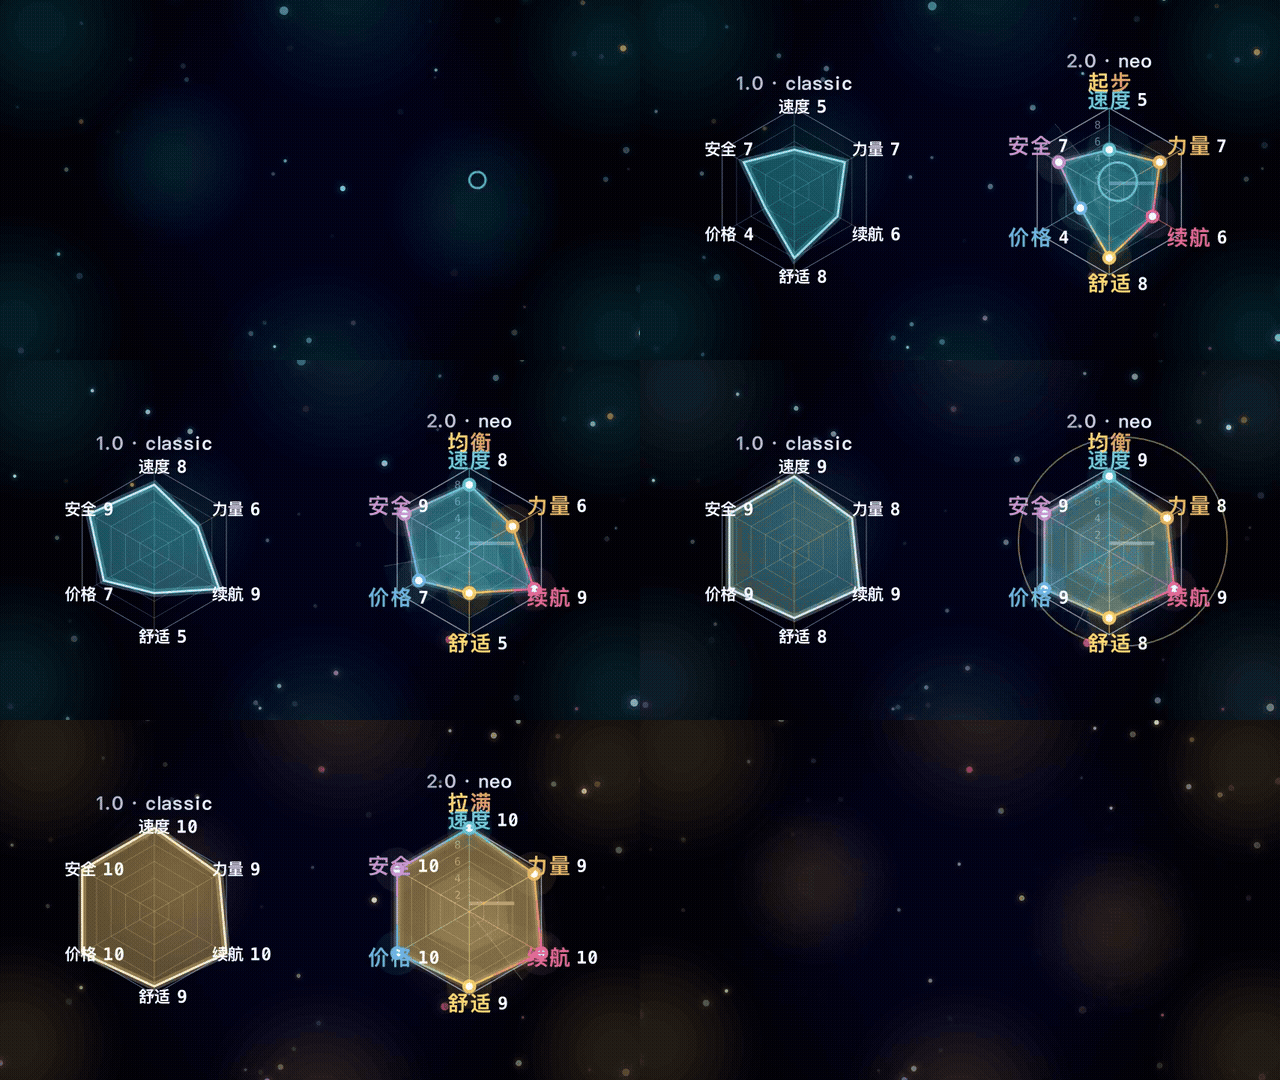 | **The two generations** — classic (1.0) vs neo (2.0), same data. `examples/05_two_styles.py` |
|
|
104
|
+
|
|
105
|
+
## The three objects
|
|
106
|
+
|
|
107
|
+
```python
|
|
108
|
+
from manim_radar import RadarChart, RadarData, RadarReel
|
|
109
|
+
```
|
|
110
|
+
|
|
111
|
+
**`RadarData`** — one snapshot: the axes and the value on each of them.
|
|
112
|
+
|
|
113
|
+
```python
|
|
114
|
+
RadarData(
|
|
115
|
+
axes=["A", "B", "C", "D", "E", "F"],
|
|
116
|
+
values=[8, 6, 7, 9, 5, 8],
|
|
117
|
+
name="Model A", # optional nameplate (morphed on every transition)
|
|
118
|
+
color="#17B8BA", # optional main colour (else the theme palette cycles)
|
|
119
|
+
max_value=10, # optional full scale; above it values render as "10+"
|
|
120
|
+
emphasis="rim", # "zoom" | "gap" | "rim" — used by RadarReel
|
|
121
|
+
hold=0.6, # seconds to hold on this snapshot (RadarReel)
|
|
122
|
+
transition="glitch", # per snapshot transition override
|
|
123
|
+
)
|
|
124
|
+
```
|
|
125
|
+
|
|
126
|
+
**`RadarChart`** — the mobject.
|
|
127
|
+
|
|
128
|
+
```python
|
|
129
|
+
chart = RadarChart(data_or_axes=..., style="neo", theme="midnight", radius=3.2)
|
|
130
|
+
|
|
131
|
+
chart.set_values([1, 2, 3, 4, 5, 6]) # instant, no animation
|
|
132
|
+
chart.set_main_color("#E868C8")
|
|
133
|
+
chart.set_rim(1.0) # orange/cyan emphasis outline
|
|
134
|
+
chart.set_radius(2.4)
|
|
135
|
+
chart.attach_backdrop(self) # shortcut for DeepSpace().link(chart)
|
|
136
|
+
|
|
137
|
+
self.play(chart.reveal()) # intro
|
|
138
|
+
self.play(chart.morph_to(other)) # the money shot
|
|
139
|
+
self.play(chart.glitch_in()) # glitchy re-entrance
|
|
140
|
+
self.play(chart.disappear()) # outro
|
|
141
|
+
```
|
|
142
|
+
|
|
143
|
+
**`RadarReel`** — the whole sequence in one line.
|
|
144
|
+
|
|
145
|
+
```python
|
|
146
|
+
RadarReel(
|
|
147
|
+
chart,
|
|
148
|
+
snapshots=[d1, d2, d3, d4], # list[RadarData]
|
|
149
|
+
hold=0.6, # default hold per snapshot
|
|
150
|
+
transition="shockwave", # default transition
|
|
151
|
+
backdrop=True, # starfield, auto-tinted
|
|
152
|
+
gap_hold=1.5, # length of a snapshot's "gap" black-out
|
|
153
|
+
).play_on(self)
|
|
154
|
+
```
|
|
155
|
+
|
|
156
|
+
## Transitions
|
|
157
|
+
|
|
158
|
+
| `transition=` | What it does |
|
|
159
|
+
|---|---|
|
|
160
|
+
| `None` *(default)* | dip below the target, then roll up (the signature `neo` move) |
|
|
161
|
+
| `"smooth"` | straight tween, no dip |
|
|
162
|
+
| `"shockwave"` | dip + an expanding ring that covers the shape change |
|
|
163
|
+
| `"zoom"` | shockwave + zoom & dim, then snap back (the "big transition") |
|
|
164
|
+
| `"glitch"` | chromatic split + flicker while the values change |
|
|
165
|
+
| `"stepped"` | values snap in integer steps (the `classic` feel) |
|
|
166
|
+
|
|
167
|
+
```python
|
|
168
|
+
self.play(chart.morph_to(target, transition="zoom", run_time=1.6))
|
|
169
|
+
```
|
|
170
|
+
|
|
171
|
+
## Styles and themes
|
|
172
|
+
|
|
173
|
+
```python
|
|
174
|
+
chart = RadarChart(data, style="neo", theme="midnight")
|
|
175
|
+
RadarChart(data, style="classic") # the 1.0 look
|
|
176
|
+
RadarChart(data, style="minimal", theme="paper") # light background
|
|
177
|
+
```
|
|
178
|
+
|
|
179
|
+
* **Styles** change *structure*: `neo`, `classic`, `minimal` (see `STYLES`).
|
|
180
|
+
* **Themes** change *colours*: `midnight`, `aurora`, `ember`, `violet`, `paper`.
|
|
181
|
+
|
|
182
|
+
Everything is a dataclass, so you can start from a preset and tweak:
|
|
183
|
+
|
|
184
|
+
```python
|
|
185
|
+
from manim_radar import RadarChart, RadarConfig, RadarTheme
|
|
186
|
+
|
|
187
|
+
cfg = RadarConfig(radius=2.4, levels=4, numbers="swap", sweep=False, rainbow_edges=False)
|
|
188
|
+
theme = RadarTheme(name="mine", grid="#8899AA", axis_colors=("#5EEAD4", "#F0ABFC") * 3)
|
|
189
|
+
chart = RadarChart(data, config=cfg, theme=theme)
|
|
190
|
+
```
|
|
191
|
+
|
|
192
|
+
`RadarConfig()` has ~60 documented fields: geometry, grid, polygon layers, fonts and
|
|
193
|
+
sizes, decorations, transition timings, title/nameplate placement. `RadarTheme`
|
|
194
|
+
holds every colour (grid, per-axis colours, palette, rims, star accents…).
|
|
195
|
+
|
|
196
|
+
## Reuse inside a bigger scene
|
|
197
|
+
|
|
198
|
+
Reveal a chart, then morph it while you write something else beside it:
|
|
199
|
+
|
|
200
|
+
```python
|
|
201
|
+
chart = RadarChart(AXES_DATA, radius=2.2)
|
|
202
|
+
chart.move_to(LEFT * 3.4)
|
|
203
|
+
self.play(chart.reveal())
|
|
204
|
+
self.play(chart.morph_to(next_data), Write(my_formula))
|
|
205
|
+
```
|
|
206
|
+
|
|
207
|
+
Because the chart is a plain `VGroup` whose geometry is recomputed in its own
|
|
208
|
+
coordinate frame every frame, moving or scaling it never breaks the drawing.
|
|
209
|
+
|
|
210
|
+
## Backdrop
|
|
211
|
+
|
|
212
|
+
```python
|
|
213
|
+
from manim_radar import DeepSpace, set_scene_background
|
|
214
|
+
|
|
215
|
+
set_scene_background("midnight") # flat background colour of the theme
|
|
216
|
+
backdrop = DeepSpace(theme="midnight", star_count=80, nebula_count=8)
|
|
217
|
+
backdrop.link(chart) # nebula / halos follow the chart colour
|
|
218
|
+
self.add(backdrop)
|
|
219
|
+
```
|
|
220
|
+
|
|
221
|
+
## The two generations
|
|
222
|
+
|
|
223
|
+
Both original looks ship as ready-to-run scenes, built on the same library:
|
|
224
|
+
|
|
225
|
+
```bash
|
|
226
|
+
manim -qh examples/legacy_v1.py RadarV1Scene # 1.0 : lean grid, snap-in numbers
|
|
227
|
+
manim -qh examples/legacy_v2.py RadarV2Scene # 2.0 : glow, rainbow outline, shockwaves
|
|
228
|
+
```
|
|
229
|
+
|
|
230
|
+
They play the bundled 23-snapshot demo reel (`manim_radar.legacy.REPLICA_TIMELINE`).
|
|
231
|
+
|
|
232
|
+
## CLI
|
|
233
|
+
|
|
234
|
+
```bash
|
|
235
|
+
manim-radar --version
|
|
236
|
+
manim-radar themes # list colour themes
|
|
237
|
+
manim-radar styles # list style presets
|
|
238
|
+
manim-radar template my_chart.py # write a starter scene
|
|
239
|
+
manim-radar demo --render # render the bundled demo reel
|
|
240
|
+
```
|
|
241
|
+
|
|
242
|
+
## Rendering
|
|
243
|
+
|
|
244
|
+
```bash
|
|
245
|
+
manim -ql scene.py MyScene # 480p15, fast preview
|
|
246
|
+
manim -qh scene.py MyScene # 1080p60, final
|
|
247
|
+
```
|
|
248
|
+
|
|
249
|
+
If you are driving Manim from another tool, pass `--media_dir` to keep the render
|
|
250
|
+
cache out of your source tree.
|
|
251
|
+
|
|
252
|
+
## Publishing notes
|
|
253
|
+
|
|
254
|
+
The package is a standard PEP 621 project using **hatchling**:
|
|
255
|
+
|
|
256
|
+
```bash
|
|
257
|
+
python -m build # -> dist/manim_radar-<version>-py3-none-any.whl + .tar.gz
|
|
258
|
+
twine check dist/* # optional sanity check
|
|
259
|
+
twine upload dist/* # or use the Release workflow (PyPI Trusted Publishing)
|
|
260
|
+
```
|
|
261
|
+
|
|
262
|
+
The distribution is registered as a Manim plugin (`manim.plugins` entry point), so
|
|
263
|
+
`manim plugins` lists it once installed.
|
|
264
|
+
|
|
265
|
+
## License
|
|
266
|
+
|
|
267
|
+
MIT — see [LICENSE](LICENSE).
|
|
268
|
+
|
|
269
|
+
---
|
|
270
|
+
|
|
271
|
+
Also by the same author: [`manim-handdraw`](https://github.com/FTZ-OPUS/manim-handdraw)
|
|
272
|
+
(turn line art into progressive hand-drawn animation).
|
|
@@ -0,0 +1,238 @@
|
|
|
1
|
+
# manim-radar
|
|
2
|
+
|
|
3
|
+
**Animated radar (spider) charts for [Manim](https://www.manim.community/) — build one, morph it into another, or play a whole sequence with a single command.**
|
|
4
|
+
|
|
5
|
+
[](https://pypi.org/project/manim-radar/)
|
|
6
|
+
[](https://pypi.org/project/manim-radar/)
|
|
7
|
+
[](LICENSE)
|
|
8
|
+
[](https://github.com/FTZ-OPUS/manim-radar/actions/workflows/ci.yml)
|
|
9
|
+
|
|
10
|
+

|
|
11
|
+
|
|
12
|
+
```python
|
|
13
|
+
from manim import *
|
|
14
|
+
from manim_radar import RadarChart, DeepSpace, set_scene_background
|
|
15
|
+
|
|
16
|
+
AXES = ["Speed", "Power", "Range", "Comfort", "Price", "Safety"]
|
|
17
|
+
|
|
18
|
+
class Demo(Scene):
|
|
19
|
+
def construct(self):
|
|
20
|
+
set_scene_background("midnight")
|
|
21
|
+
chart = RadarChart(axes=AXES, values=[8, 6, 7, 9, 5, 8], title="Six axes")
|
|
22
|
+
|
|
23
|
+
self.add(DeepSpace().link(chart)) # optional starfield
|
|
24
|
+
self.play(chart.reveal()) # grow out of the centre
|
|
25
|
+
self.play(chart.morph_to([5, 9, 5, 6, 9, 9], # one command = one morph
|
|
26
|
+
color="#FFB74D"))
|
|
27
|
+
self.play(chart.disappear())
|
|
28
|
+
```
|
|
29
|
+
|
|
30
|
+
```bash
|
|
31
|
+
manim -qh demo.py Demo # 1080p60
|
|
32
|
+
```
|
|
33
|
+
|
|
34
|
+
---
|
|
35
|
+
|
|
36
|
+
## Install
|
|
37
|
+
|
|
38
|
+
```bash
|
|
39
|
+
pip install manim_radar
|
|
40
|
+
```
|
|
41
|
+
|
|
42
|
+
Requires Python ≥ 3.9, `manim >= 0.18` and `numpy`. `pip` pulls those in for you.
|
|
43
|
+
|
|
44
|
+
## Features
|
|
45
|
+
|
|
46
|
+
| | |
|
|
47
|
+
|---|---|
|
|
48
|
+
| **One command morphing** | `chart.morph_to(...)` tweens values, full scale, colour, emphasis outline and opacity in a single pass |
|
|
49
|
+
| **Six transition presets** | `smooth`, `dip`, `shockwave`, `zoom`, `glitch`, `stepped` — plus every knob to fine-tune them |
|
|
50
|
+
| **One command sequences** | `RadarReel(chart, snapshots).play_on(self)` plays a whole reel, black gaps included |
|
|
51
|
+
| **3 styles × 5 themes** | `neo` (glow / rainbow outline / sweep beam), `classic` (the lean 1.0 look), `minimal` (light themes, reports) |
|
|
52
|
+
| **Odometer numbers** | digits roll continuously instead of snapping, with automatic `10+` overflow labels |
|
|
53
|
+
| **Real Manim mobjects** | the chart is a `VGroup`: `shift` / `move_to` / `scale` / `rotate` / `FadeIn` / `FadeOut` all behave |
|
|
54
|
+
| **Deep-space backdrop** | `DeepSpace` adds a radial glow, corner vignette, nebula blobs and drifting stars that tint with the chart |
|
|
55
|
+
| **Two generations included** | `RadarV1Scene` and `RadarV2Scene` rebuild the original 1.0 and 2.0 reels from the library |
|
|
56
|
+
| **Cross-platform fonts** | picks the first installed CJK / monospace font, works on macOS, Linux and Windows |
|
|
57
|
+
|
|
58
|
+
## Demos
|
|
59
|
+
|
|
60
|
+
Every GIF below was rendered straight from the matching example scene
|
|
61
|
+
(`manim -ql` + `ffmpeg`); they all live in [`docs/`](docs/).
|
|
62
|
+
|
|
63
|
+
| | |
|
|
64
|
+
|---|---|
|
|
65
|
+
|  | **Quickstart** — build → reveal → morph → fade, in ten lines. `examples/01_quickstart.py` |
|
|
66
|
+
|  | **Transitions** — smooth / shockwave / zoom / glitch / rim. `examples/02_morph_gallery.py` |
|
|
67
|
+
|  | **One-command reel** — a whole sequence, black gap included. `examples/03_reel.py` |
|
|
68
|
+
|  | **3 styles × 5 themes** — from `neo` glow to a light `paper` report. `examples/04_styles_themes.py` |
|
|
69
|
+
|  | **The two generations** — classic (1.0) vs neo (2.0), same data. `examples/05_two_styles.py` |
|
|
70
|
+
|
|
71
|
+
## The three objects
|
|
72
|
+
|
|
73
|
+
```python
|
|
74
|
+
from manim_radar import RadarChart, RadarData, RadarReel
|
|
75
|
+
```
|
|
76
|
+
|
|
77
|
+
**`RadarData`** — one snapshot: the axes and the value on each of them.
|
|
78
|
+
|
|
79
|
+
```python
|
|
80
|
+
RadarData(
|
|
81
|
+
axes=["A", "B", "C", "D", "E", "F"],
|
|
82
|
+
values=[8, 6, 7, 9, 5, 8],
|
|
83
|
+
name="Model A", # optional nameplate (morphed on every transition)
|
|
84
|
+
color="#17B8BA", # optional main colour (else the theme palette cycles)
|
|
85
|
+
max_value=10, # optional full scale; above it values render as "10+"
|
|
86
|
+
emphasis="rim", # "zoom" | "gap" | "rim" — used by RadarReel
|
|
87
|
+
hold=0.6, # seconds to hold on this snapshot (RadarReel)
|
|
88
|
+
transition="glitch", # per snapshot transition override
|
|
89
|
+
)
|
|
90
|
+
```
|
|
91
|
+
|
|
92
|
+
**`RadarChart`** — the mobject.
|
|
93
|
+
|
|
94
|
+
```python
|
|
95
|
+
chart = RadarChart(data_or_axes=..., style="neo", theme="midnight", radius=3.2)
|
|
96
|
+
|
|
97
|
+
chart.set_values([1, 2, 3, 4, 5, 6]) # instant, no animation
|
|
98
|
+
chart.set_main_color("#E868C8")
|
|
99
|
+
chart.set_rim(1.0) # orange/cyan emphasis outline
|
|
100
|
+
chart.set_radius(2.4)
|
|
101
|
+
chart.attach_backdrop(self) # shortcut for DeepSpace().link(chart)
|
|
102
|
+
|
|
103
|
+
self.play(chart.reveal()) # intro
|
|
104
|
+
self.play(chart.morph_to(other)) # the money shot
|
|
105
|
+
self.play(chart.glitch_in()) # glitchy re-entrance
|
|
106
|
+
self.play(chart.disappear()) # outro
|
|
107
|
+
```
|
|
108
|
+
|
|
109
|
+
**`RadarReel`** — the whole sequence in one line.
|
|
110
|
+
|
|
111
|
+
```python
|
|
112
|
+
RadarReel(
|
|
113
|
+
chart,
|
|
114
|
+
snapshots=[d1, d2, d3, d4], # list[RadarData]
|
|
115
|
+
hold=0.6, # default hold per snapshot
|
|
116
|
+
transition="shockwave", # default transition
|
|
117
|
+
backdrop=True, # starfield, auto-tinted
|
|
118
|
+
gap_hold=1.5, # length of a snapshot's "gap" black-out
|
|
119
|
+
).play_on(self)
|
|
120
|
+
```
|
|
121
|
+
|
|
122
|
+
## Transitions
|
|
123
|
+
|
|
124
|
+
| `transition=` | What it does |
|
|
125
|
+
|---|---|
|
|
126
|
+
| `None` *(default)* | dip below the target, then roll up (the signature `neo` move) |
|
|
127
|
+
| `"smooth"` | straight tween, no dip |
|
|
128
|
+
| `"shockwave"` | dip + an expanding ring that covers the shape change |
|
|
129
|
+
| `"zoom"` | shockwave + zoom & dim, then snap back (the "big transition") |
|
|
130
|
+
| `"glitch"` | chromatic split + flicker while the values change |
|
|
131
|
+
| `"stepped"` | values snap in integer steps (the `classic` feel) |
|
|
132
|
+
|
|
133
|
+
```python
|
|
134
|
+
self.play(chart.morph_to(target, transition="zoom", run_time=1.6))
|
|
135
|
+
```
|
|
136
|
+
|
|
137
|
+
## Styles and themes
|
|
138
|
+
|
|
139
|
+
```python
|
|
140
|
+
chart = RadarChart(data, style="neo", theme="midnight")
|
|
141
|
+
RadarChart(data, style="classic") # the 1.0 look
|
|
142
|
+
RadarChart(data, style="minimal", theme="paper") # light background
|
|
143
|
+
```
|
|
144
|
+
|
|
145
|
+
* **Styles** change *structure*: `neo`, `classic`, `minimal` (see `STYLES`).
|
|
146
|
+
* **Themes** change *colours*: `midnight`, `aurora`, `ember`, `violet`, `paper`.
|
|
147
|
+
|
|
148
|
+
Everything is a dataclass, so you can start from a preset and tweak:
|
|
149
|
+
|
|
150
|
+
```python
|
|
151
|
+
from manim_radar import RadarChart, RadarConfig, RadarTheme
|
|
152
|
+
|
|
153
|
+
cfg = RadarConfig(radius=2.4, levels=4, numbers="swap", sweep=False, rainbow_edges=False)
|
|
154
|
+
theme = RadarTheme(name="mine", grid="#8899AA", axis_colors=("#5EEAD4", "#F0ABFC") * 3)
|
|
155
|
+
chart = RadarChart(data, config=cfg, theme=theme)
|
|
156
|
+
```
|
|
157
|
+
|
|
158
|
+
`RadarConfig()` has ~60 documented fields: geometry, grid, polygon layers, fonts and
|
|
159
|
+
sizes, decorations, transition timings, title/nameplate placement. `RadarTheme`
|
|
160
|
+
holds every colour (grid, per-axis colours, palette, rims, star accents…).
|
|
161
|
+
|
|
162
|
+
## Reuse inside a bigger scene
|
|
163
|
+
|
|
164
|
+
Reveal a chart, then morph it while you write something else beside it:
|
|
165
|
+
|
|
166
|
+
```python
|
|
167
|
+
chart = RadarChart(AXES_DATA, radius=2.2)
|
|
168
|
+
chart.move_to(LEFT * 3.4)
|
|
169
|
+
self.play(chart.reveal())
|
|
170
|
+
self.play(chart.morph_to(next_data), Write(my_formula))
|
|
171
|
+
```
|
|
172
|
+
|
|
173
|
+
Because the chart is a plain `VGroup` whose geometry is recomputed in its own
|
|
174
|
+
coordinate frame every frame, moving or scaling it never breaks the drawing.
|
|
175
|
+
|
|
176
|
+
## Backdrop
|
|
177
|
+
|
|
178
|
+
```python
|
|
179
|
+
from manim_radar import DeepSpace, set_scene_background
|
|
180
|
+
|
|
181
|
+
set_scene_background("midnight") # flat background colour of the theme
|
|
182
|
+
backdrop = DeepSpace(theme="midnight", star_count=80, nebula_count=8)
|
|
183
|
+
backdrop.link(chart) # nebula / halos follow the chart colour
|
|
184
|
+
self.add(backdrop)
|
|
185
|
+
```
|
|
186
|
+
|
|
187
|
+
## The two generations
|
|
188
|
+
|
|
189
|
+
Both original looks ship as ready-to-run scenes, built on the same library:
|
|
190
|
+
|
|
191
|
+
```bash
|
|
192
|
+
manim -qh examples/legacy_v1.py RadarV1Scene # 1.0 : lean grid, snap-in numbers
|
|
193
|
+
manim -qh examples/legacy_v2.py RadarV2Scene # 2.0 : glow, rainbow outline, shockwaves
|
|
194
|
+
```
|
|
195
|
+
|
|
196
|
+
They play the bundled 23-snapshot demo reel (`manim_radar.legacy.REPLICA_TIMELINE`).
|
|
197
|
+
|
|
198
|
+
## CLI
|
|
199
|
+
|
|
200
|
+
```bash
|
|
201
|
+
manim-radar --version
|
|
202
|
+
manim-radar themes # list colour themes
|
|
203
|
+
manim-radar styles # list style presets
|
|
204
|
+
manim-radar template my_chart.py # write a starter scene
|
|
205
|
+
manim-radar demo --render # render the bundled demo reel
|
|
206
|
+
```
|
|
207
|
+
|
|
208
|
+
## Rendering
|
|
209
|
+
|
|
210
|
+
```bash
|
|
211
|
+
manim -ql scene.py MyScene # 480p15, fast preview
|
|
212
|
+
manim -qh scene.py MyScene # 1080p60, final
|
|
213
|
+
```
|
|
214
|
+
|
|
215
|
+
If you are driving Manim from another tool, pass `--media_dir` to keep the render
|
|
216
|
+
cache out of your source tree.
|
|
217
|
+
|
|
218
|
+
## Publishing notes
|
|
219
|
+
|
|
220
|
+
The package is a standard PEP 621 project using **hatchling**:
|
|
221
|
+
|
|
222
|
+
```bash
|
|
223
|
+
python -m build # -> dist/manim_radar-<version>-py3-none-any.whl + .tar.gz
|
|
224
|
+
twine check dist/* # optional sanity check
|
|
225
|
+
twine upload dist/* # or use the Release workflow (PyPI Trusted Publishing)
|
|
226
|
+
```
|
|
227
|
+
|
|
228
|
+
The distribution is registered as a Manim plugin (`manim.plugins` entry point), so
|
|
229
|
+
`manim plugins` lists it once installed.
|
|
230
|
+
|
|
231
|
+
## License
|
|
232
|
+
|
|
233
|
+
MIT — see [LICENSE](LICENSE).
|
|
234
|
+
|
|
235
|
+
---
|
|
236
|
+
|
|
237
|
+
Also by the same author: [`manim-handdraw`](https://github.com/FTZ-OPUS/manim-handdraw)
|
|
238
|
+
(turn line art into progressive hand-drawn animation).
|