latency-steps 0.1.1__tar.gz
This diff represents the content of publicly available package versions that have been released to one of the supported registries. The information contained in this diff is provided for informational purposes only and reflects changes between package versions as they appear in their respective public registries.
- latency_steps-0.1.1/.github/ISSUE_TEMPLATE/bug.yml +22 -0
- latency_steps-0.1.1/.github/ISSUE_TEMPLATE/question.yml +11 -0
- latency_steps-0.1.1/.github/workflows/ci.yml +32 -0
- latency_steps-0.1.1/.gitignore +38 -0
- latency_steps-0.1.1/.python-version +1 -0
- latency_steps-0.1.1/CHANGELOG.md +26 -0
- latency_steps-0.1.1/LICENSE +21 -0
- latency_steps-0.1.1/PKG-INFO +288 -0
- latency_steps-0.1.1/README.ko.md +263 -0
- latency_steps-0.1.1/README.md +264 -0
- latency_steps-0.1.1/SECURITY.md +7 -0
- latency_steps-0.1.1/docs/images/chart.en.svg +53 -0
- latency_steps-0.1.1/docs/images/chart.ko.svg +53 -0
- latency_steps-0.1.1/docs/images/ci-json.ko.png +0 -0
- latency_steps-0.1.1/docs/images/ci-json.png +0 -0
- latency_steps-0.1.1/docs/images/demo-table.ko.png +0 -0
- latency_steps-0.1.1/docs/images/demo-table.png +0 -0
- latency_steps-0.1.1/docs/images/dropped-rows.ko.png +0 -0
- latency_steps-0.1.1/docs/images/dropped-rows.png +0 -0
- latency_steps-0.1.1/docs/images/help.ko.png +0 -0
- latency_steps-0.1.1/docs/images/help.png +0 -0
- latency_steps-0.1.1/docs/images/stratify-rerank.ko.png +0 -0
- latency_steps-0.1.1/docs/images/stratify-rerank.png +0 -0
- latency_steps-0.1.1/pyproject.toml +44 -0
- latency_steps-0.1.1/src/latency_steps/__init__.py +3 -0
- latency_steps-0.1.1/src/latency_steps/__main__.py +3 -0
- latency_steps-0.1.1/src/latency_steps/analysis.py +86 -0
- latency_steps-0.1.1/src/latency_steps/cli.py +199 -0
- latency_steps-0.1.1/src/latency_steps/detect.py +290 -0
- latency_steps-0.1.1/src/latency_steps/errors.py +14 -0
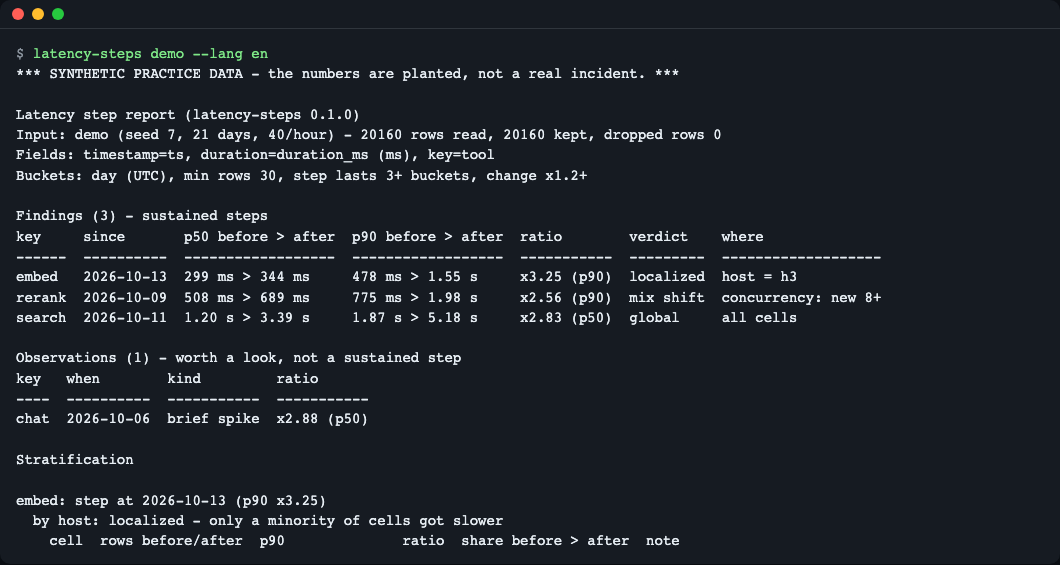
- latency_steps-0.1.1/src/latency_steps/i18n.py +311 -0
- latency_steps-0.1.1/src/latency_steps/ingest.py +293 -0
- latency_steps-0.1.1/src/latency_steps/model.py +141 -0
- latency_steps-0.1.1/src/latency_steps/render/__init__.py +0 -0
- latency_steps-0.1.1/src/latency_steps/render/common.py +81 -0
- latency_steps-0.1.1/src/latency_steps/render/jsonout.py +104 -0
- latency_steps-0.1.1/src/latency_steps/render/markdown.py +102 -0
- latency_steps-0.1.1/src/latency_steps/render/svg.py +98 -0
- latency_steps-0.1.1/src/latency_steps/render/table.py +118 -0
- latency_steps-0.1.1/src/latency_steps/series.py +61 -0
- latency_steps-0.1.1/src/latency_steps/stratify.py +204 -0
- latency_steps-0.1.1/src/latency_steps/synth.py +67 -0
- latency_steps-0.1.1/tests/conftest.py +44 -0
- latency_steps-0.1.1/tests/test_cli.py +133 -0
- latency_steps-0.1.1/tests/test_detect.py +117 -0
- latency_steps-0.1.1/tests/test_i18n.py +107 -0
- latency_steps-0.1.1/tests/test_ingest.py +212 -0
- latency_steps-0.1.1/tests/test_meta.py +48 -0
- latency_steps-0.1.1/tests/test_render.py +39 -0
- latency_steps-0.1.1/tests/test_series.py +69 -0
- latency_steps-0.1.1/tests/test_stratify.py +94 -0
- latency_steps-0.1.1/uv.lock +121 -0
|
@@ -0,0 +1,22 @@
|
|
|
1
|
+
name: 버그 / Bug
|
|
2
|
+
description: README대로 했는데 다르게 동작해요 / Something does not work as the README says
|
|
3
|
+
labels: [bug]
|
|
4
|
+
body:
|
|
5
|
+
- type: textarea
|
|
6
|
+
id: what
|
|
7
|
+
attributes:
|
|
8
|
+
label: 무엇이 일어났나요? / What happened?
|
|
9
|
+
description: 실행한 명령과 나온 메시지를 그대로 붙여 주세요. / Paste the command and the output.
|
|
10
|
+
validations:
|
|
11
|
+
required: true
|
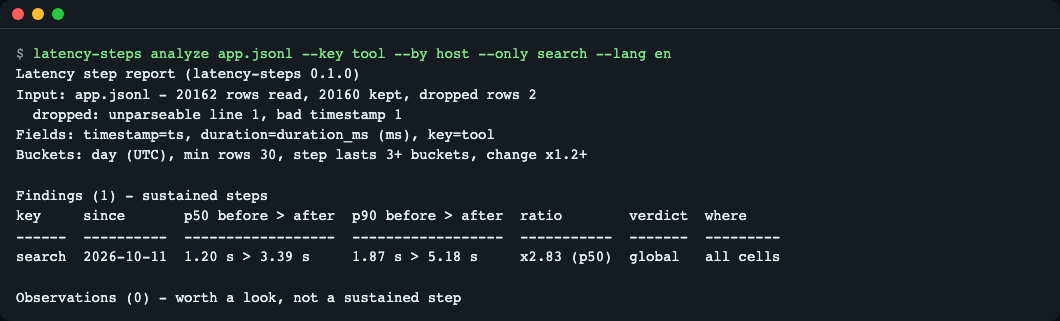
|
12
|
+
- type: textarea
|
|
13
|
+
id: expected
|
|
14
|
+
attributes:
|
|
15
|
+
label: 기대한 결과 / Expected
|
|
16
|
+
- type: input
|
|
17
|
+
id: env
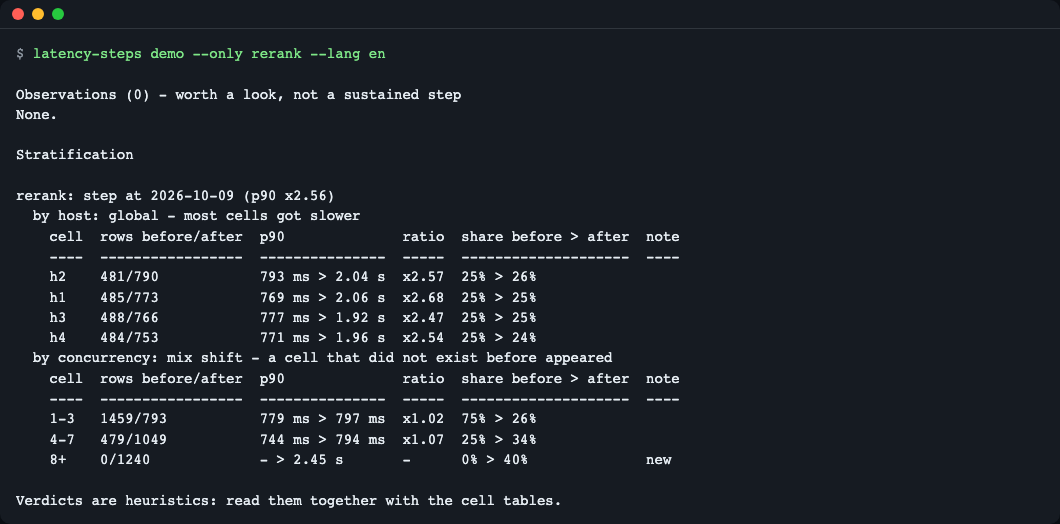
|
|
18
|
+
attributes:
|
|
19
|
+
label: 환경 / Environment
|
|
20
|
+
placeholder: "macOS 15 (M3) · Ubuntu 24.04 · Windows 11 / uv 0.x / mock or real mode"
|
|
21
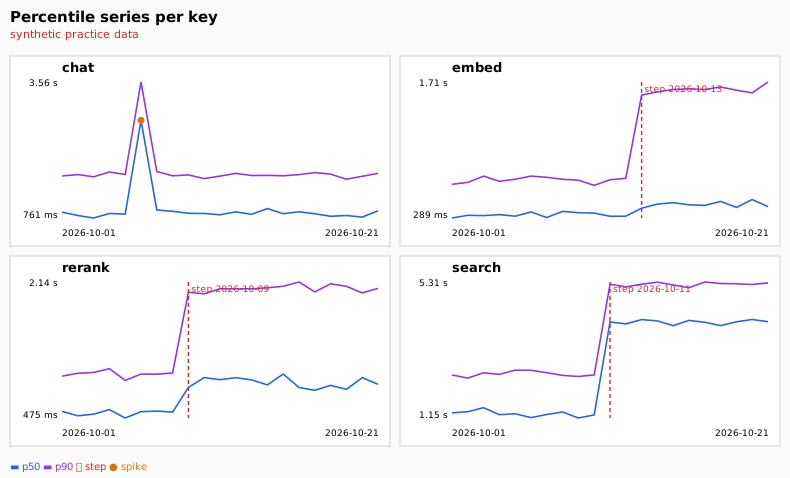
|
+
validations:
|
|
22
|
+
required: true
|
|
@@ -0,0 +1,11 @@
|
|
|
1
|
+
name: 질문 / Question
|
|
2
|
+
description: 이해가 안 되는 부분이나 더 알고 싶은 점 / Something unclear or worth explaining
|
|
3
|
+
labels: [question]
|
|
4
|
+
body:
|
|
5
|
+
- type: textarea
|
|
6
|
+
id: question
|
|
7
|
+
attributes:
|
|
8
|
+
label: 질문 / Question
|
|
9
|
+
description: README의 어느 부분(절 제목)에 대한 질문인지 알려 주세요. / Which README section is this about?
|
|
10
|
+
validations:
|
|
11
|
+
required: true
|
|
@@ -0,0 +1,32 @@
|
|
|
1
|
+
# Runs on synthetic logs only: no keys, no network access needed by the tests.
|
|
2
|
+
name: ci
|
|
3
|
+
on:
|
|
4
|
+
push:
|
|
5
|
+
pull_request:
|
|
6
|
+
schedule:
|
|
7
|
+
- cron: "17 3 * * 1" # weekly: catches dependency or runtime changes that break the tool
|
|
8
|
+
workflow_dispatch:
|
|
9
|
+
jobs:
|
|
10
|
+
test:
|
|
11
|
+
runs-on: ubuntu-latest
|
|
12
|
+
timeout-minutes: 10
|
|
13
|
+
strategy:
|
|
14
|
+
fail-fast: false
|
|
15
|
+
matrix:
|
|
16
|
+
python: ["3.11", "3.13"]
|
|
17
|
+
env:
|
|
18
|
+
UV_PYTHON: ${{ matrix.python }}
|
|
19
|
+
steps:
|
|
20
|
+
- uses: actions/checkout@v4
|
|
21
|
+
- uses: astral-sh/setup-uv@v6
|
|
22
|
+
- run: uv python install
|
|
23
|
+
- run: uv sync --locked
|
|
24
|
+
- run: uv run pytest -q
|
|
25
|
+
timeout-minutes: 8
|
|
26
|
+
- name: demo exits 1 when it finds a step
|
|
27
|
+
run: |
|
|
28
|
+
# The demo is expected to find steps, so exit code 1 is the pass condition.
|
|
29
|
+
# GitHub runs steps with bash -e, so the exit code is captured with ||.
|
|
30
|
+
code=0
|
|
31
|
+
uv run latency-steps demo --lang en --fail-on-step > /dev/null || code=$?
|
|
32
|
+
test "$code" -eq 1
|
|
@@ -0,0 +1,38 @@
|
|
|
1
|
+
# Python
|
|
2
|
+
__pycache__/
|
|
3
|
+
*.py[cod]
|
|
4
|
+
.venv/
|
|
5
|
+
.pytest_cache/
|
|
6
|
+
.ruff_cache/
|
|
7
|
+
.mypy_cache/
|
|
8
|
+
*.egg-info/
|
|
9
|
+
|
|
10
|
+
# Node
|
|
11
|
+
node_modules/
|
|
12
|
+
dist/
|
|
13
|
+
.next/
|
|
14
|
+
|
|
15
|
+
# 실행 산출물·모델·데이터 캐시
|
|
16
|
+
runs/
|
|
17
|
+
outputs/
|
|
18
|
+
.cache/
|
|
19
|
+
*.safetensors
|
|
20
|
+
*.gguf
|
|
21
|
+
*.bin
|
|
22
|
+
|
|
23
|
+
# 환경·비밀
|
|
24
|
+
.env
|
|
25
|
+
.env.*
|
|
26
|
+
!.env.example
|
|
27
|
+
|
|
28
|
+
# OS·에디터
|
|
29
|
+
.DS_Store
|
|
30
|
+
.vscode/
|
|
31
|
+
.idea/
|
|
32
|
+
|
|
33
|
+
# Flutter·Dart
|
|
34
|
+
.dart_tool/
|
|
35
|
+
build/
|
|
36
|
+
.flutter-plugins
|
|
37
|
+
.flutter-plugins-dependencies
|
|
38
|
+
coverage/
|
|
@@ -0,0 +1 @@
|
|
|
1
|
+
3.13
|
|
@@ -0,0 +1,26 @@
|
|
|
1
|
+
# Changelog
|
|
2
|
+
|
|
3
|
+
All notable changes to this project are documented in this file.
|
|
4
|
+
The format is based on [Keep a Changelog](https://keepachangelog.com/en/1.1.0/),
|
|
5
|
+
and this project adheres to [Semantic Versioning](https://semver.org/spec/v2.0.0.html).
|
|
6
|
+
|
|
7
|
+
## [Unreleased]
|
|
8
|
+
|
|
9
|
+
## [0.1.1] - 2026-11-13
|
|
10
|
+
|
|
11
|
+
### Fixed
|
|
12
|
+
- CSV files with a UTF-8 byte order mark (Excel "CSV UTF-8", Windows PowerShell exports) are read correctly; the first column name was not recognised before (plain, `.gz` and standard input).
|
|
13
|
+
|
|
14
|
+
### Known issues
|
|
15
|
+
- The screenshots `demo-table` and `dropped-rows` still show the version line `0.1.0`; they will be re-taken in a later release.
|
|
16
|
+
- Rows with invalid UTF-8 bytes are not yet counted in the dropped-rows summary.
|
|
17
|
+
|
|
18
|
+
## [0.1.0] - 2026-11-12
|
|
19
|
+
|
|
20
|
+
### Added
|
|
21
|
+
- `latency-steps analyze`: raw JSONL / CSV logs (optionally `.gz` / `.zst`, or standard input) to per-key p50 / p90 time series with a minimum-sample guard.
|
|
22
|
+
- Step detection on log-scale series by robust binary segmentation (pure Python), with `--min-run` and `--min-ratio` instead of a penalty value. Brief spikes, trailing shifts and speed-ups are reported as observations, not findings.
|
|
23
|
+
- Stratification of the windows before and after each step by `--by` dimensions (fields or numeric ranges) with `localized`, `mix_shift`, `global` and `inconclusive` verdicts and an evidence table per dimension.
|
|
24
|
+
- `latency-steps demo`: seeded synthetic practice log with planted steps, a one-host regression, a load-mix shift and a one-day spike.
|
|
25
|
+
- Output as terminal table, Markdown, SVG and JSON (`schema_version` 1); exit codes 0 / 1 (`--fail-on-step`) / 2.
|
|
26
|
+
- English and Korean interface (`--lang`, `LATENCY_STEPS_LANG`, `LC_ALL` / `LC_MESSAGES` / `LANG`).
|
|
@@ -0,0 +1,21 @@
|
|
|
1
|
+
MIT License
|
|
2
|
+
|
|
3
|
+
Copyright (c) 2026 LeeGyeongPil
|
|
4
|
+
|
|
5
|
+
Permission is hereby granted, free of charge, to any person obtaining a copy
|
|
6
|
+
of this software and associated documentation files (the "Software"), to deal
|
|
7
|
+
in the Software without restriction, including without limitation the rights
|
|
8
|
+
to use, copy, modify, merge, publish, distribute, sublicense, and/or sell
|
|
9
|
+
copies of the Software, and to permit persons to whom the Software is
|
|
10
|
+
furnished to do so, subject to the following conditions:
|
|
11
|
+
|
|
12
|
+
The above copyright notice and this permission notice shall be included in all
|
|
13
|
+
copies or substantial portions of the Software.
|
|
14
|
+
|
|
15
|
+
THE SOFTWARE IS PROVIDED "AS IS", WITHOUT WARRANTY OF ANY KIND, EXPRESS OR
|
|
16
|
+
IMPLIED, INCLUDING BUT NOT LIMITED TO THE WARRANTIES OF MERCHANTABILITY,
|
|
17
|
+
FITNESS FOR A PARTICULAR PURPOSE AND NONINFRINGEMENT. IN NO EVENT SHALL THE
|
|
18
|
+
AUTHORS OR COPYRIGHT HOLDERS BE LIABLE FOR ANY CLAIM, DAMAGES OR OTHER
|
|
19
|
+
LIABILITY, WHETHER IN AN ACTION OF CONTRACT, TORT OR OTHERWISE, ARISING FROM,
|
|
20
|
+
OUT OF OR IN CONNECTION WITH THE SOFTWARE OR THE USE OR OTHER DEALINGS IN THE
|
|
21
|
+
SOFTWARE.
|
|
@@ -0,0 +1,288 @@
|
|
|
1
|
+
Metadata-Version: 2.5
|
|
2
|
+
Name: latency-steps
|
|
3
|
+
Version: 0.1.1
|
|
4
|
+
Summary: Find when latency stepped up in raw event logs, then see whether it is one host, a load-mix shift, or everything.
|
|
5
|
+
Project-URL: Homepage, https://github.com/LeeGyeongPil/latency-steps
|
|
6
|
+
Project-URL: Issues, https://github.com/LeeGyeongPil/latency-steps/issues
|
|
7
|
+
Project-URL: Changelog, https://github.com/LeeGyeongPil/latency-steps/blob/main/CHANGELOG.md
|
|
8
|
+
Author: LeeGyeongPil
|
|
9
|
+
License-Expression: MIT
|
|
10
|
+
License-File: LICENSE
|
|
11
|
+
Keywords: change-point,cli,duckdb,latency,logs,percentiles,regression
|
|
12
|
+
Classifier: Development Status :: 3 - Alpha
|
|
13
|
+
Classifier: Environment :: Console
|
|
14
|
+
Classifier: Intended Audience :: Developers
|
|
15
|
+
Classifier: Programming Language :: Python :: 3
|
|
16
|
+
Classifier: Programming Language :: Python :: 3.11
|
|
17
|
+
Classifier: Programming Language :: Python :: 3.12
|
|
18
|
+
Classifier: Programming Language :: Python :: 3.13
|
|
19
|
+
Classifier: Topic :: System :: Logging
|
|
20
|
+
Classifier: Topic :: System :: Monitoring
|
|
21
|
+
Requires-Python: >=3.11
|
|
22
|
+
Requires-Dist: duckdb<3,>=2.0.0
|
|
23
|
+
Description-Content-Type: text/markdown
|
|
24
|
+
|
|
25
|
+
# latency-steps
|
|
26
|
+
|
|
27
|
+
**English** | [한국어](https://github.com/LeeGyeongPil/latency-steps/blob/v0.1.1/README.ko.md)
|
|
28
|
+
|
|
29
|
+
Someone says "it got slower". `latency-steps` reads your raw JSONL or CSV event log offline and tells you, per key (tool, endpoint, model), **when** latency stepped up and whether that step is **one host**, a **shift in the load mix**, or **everything**. It builds p50/p90 time series with DuckDB, finds sustained steps with a small pure-Python change-point detector, and then splits the windows before and after each step by the dimensions you name.
|
|
30
|
+
|
|
31
|
+
|
|
32
|
+
*One command on built-in synthetic practice data: three sustained steps (findings) and one one-day spike (observation).*
|
|
33
|
+
|
|
34
|
+
## Who it is for
|
|
35
|
+
- You run a backend or an agent and keep tool-call, API or model-response logs as files, and you get "it feels slower since last week".
|
|
36
|
+
- You want to know whether a slowdown is a bad host, a change in what kind of traffic arrives, or a global change, before the meeting.
|
|
37
|
+
- You want a nightly CI job that fails when a new latency step appears.
|
|
38
|
+
|
|
39
|
+
## Install
|
|
40
|
+
|
|
41
|
+
Needs Python 3.11 or newer (DuckDB 2.0 requires it) and [uv](https://docs.astral.sh/uv/).
|
|
42
|
+
|
|
43
|
+
```bash
|
|
44
|
+
curl -LsSf https://astral.sh/uv/install.sh | sh # installs uv (macOS / Linux)
|
|
45
|
+
git clone https://github.com/LeeGyeongPil/latency-steps
|
|
46
|
+
cd latency-steps
|
|
47
|
+
uv tool install . # puts `latency-steps` on your PATH
|
|
48
|
+
latency-steps --version
|
|
49
|
+
```
|
|
50
|
+
|
|
51
|
+
```text
|
|
52
|
+
latency-steps 0.1.1
|
|
53
|
+
```
|
|
54
|
+
|
|
55
|
+
On a minimal Linux image you also need `git` and `curl` (and `ca-certificates`). The only runtime dependency is `duckdb`.
|
|
56
|
+
|
|
57
|
+
Or run straight from the clone without installing: `uv run latency-steps demo`.
|
|
58
|
+
|
|
59
|
+
## Quick start: the practice mode
|
|
60
|
+
|
|
61
|
+
`demo` is a **practice (mock) mode**: it writes a seeded synthetic log (4 keys x 4 hosts x 21 days, about 20,000 rows) and analyzes it through the same code path as a real file. The numbers are planted, not a real incident, and the screen says so. Nothing else is faked, and no network or API key is involved.
|
|
62
|
+
|
|
63
|
+
```bash
|
|
64
|
+
latency-steps demo --lang en
|
|
65
|
+
```
|
|
66
|
+
|
|
67
|
+
```text
|
|
68
|
+
*** SYNTHETIC PRACTICE DATA - the numbers are planted, not a real incident. ***
|
|
69
|
+
|
|
70
|
+
Latency step report (latency-steps 0.1.1)
|
|
71
|
+
Input: demo (seed 7, 21 days, 40/hour) - 20160 rows read, 20160 kept, dropped rows 0
|
|
72
|
+
Fields: timestamp=ts, duration=duration_ms (ms), key=tool
|
|
73
|
+
Buckets: day (UTC), min rows 30, step lasts 3+ buckets, change x1.2+
|
|
74
|
+
|
|
75
|
+
Findings (3) - sustained steps
|
|
76
|
+
key since p50 before > after p90 before > after ratio verdict where
|
|
77
|
+
------ ---------- ------------------ ------------------ ----------- --------- -------------------
|
|
78
|
+
embed 2026-10-13 299 ms > 344 ms 478 ms > 1.55 s x3.25 (p90) localized host = h3
|
|
79
|
+
rerank 2026-10-09 508 ms > 689 ms 775 ms > 1.98 s x2.56 (p90) mix shift concurrency: new 8+
|
|
80
|
+
search 2026-10-11 1.20 s > 3.39 s 1.87 s > 5.18 s x2.83 (p50) global all cells
|
|
81
|
+
|
|
82
|
+
Observations (1) - worth a look, not a sustained step
|
|
83
|
+
key when kind ratio
|
|
84
|
+
---- ---------- ----------- -----------
|
|
85
|
+
chat 2026-10-06 brief spike x2.88 (p50)
|
|
86
|
+
```
|
|
87
|
+
|
|
88
|
+
(The full report continues with one evidence table per finding and dimension.) How to read it:
|
|
89
|
+
|
|
90
|
+
- **Findings** are steps that lasted at least 3 buckets and changed p50 or p90 by at least x1.2. `since` is the first bucket at the new level.
|
|
91
|
+
- `search` got slower everywhere (`global`), `embed` only on host `h3` (`localized`; its overall p50 barely moves, which is why the p90 column matters), `rerank` because a new kind of traffic appeared (`mix shift`).
|
|
92
|
+
- **Observations** are things that went back (`chat` was slow for one day only) or went the other way. They are shown but never counted as a step.
|
|
93
|
+
|
|
94
|
+
## Analyze your own logs
|
|
95
|
+
|
|
96
|
+
```bash
|
|
97
|
+
latency-steps analyze app.jsonl --key tool --by host --by concurrency:1-3,4-7,8+
|
|
98
|
+
```
|
|
99
|
+
|
|
100
|
+
| Option | What it does | Example |
|
|
101
|
+
|---|---|---|
|
|
102
|
+
| `path` | JSONL or CSV file (UTF-8 with BOM, e.g. Excel exports, is fine), `.gz` / `.zst` also work, `-` reads standard input | `app.jsonl.gz`, `-` |
|
|
103
|
+
| `--ts FIELD` | Timestamp field. Default: the first of `ts`, `timestamp`, `time`, ... that exists | `--ts time` |
|
|
104
|
+
| `--duration FIELD` | Latency field. Default: the first of `duration_ms`, `latency_ms`, `duration`, ... | `--duration elapsed` |
|
|
105
|
+
| `--duration-unit ms\|s\|us` | Unit of bare numbers (guessed from the field name, else ms). Values like `12ms` or `1.2s` are read as written | `--duration-unit s` |
|
|
106
|
+
| `--key FIELD` | One series per value of this field. Default: a single series | `--key endpoint` |
|
|
107
|
+
| `--by DIM` | Dimension to stratify by, repeatable: a field, or numeric ranges `field:1-3,4-7,8+` | `--by host` |
|
|
108
|
+
| `--bucket hour\|day\|auto` | Time bucket (`auto` = day when the log spans 14+ days) | `--bucket hour` |
|
|
109
|
+
| `--min-n N` | Buckets with fewer rows are left out of the series (default 30) | `--min-n 50` |
|
|
110
|
+
| `--min-run N` | A step must last this many buckets (default 3) | `--min-run 4` |
|
|
111
|
+
| `--min-ratio X` | A step must change p50 or p90 by this factor (default 1.2) | `--min-ratio 1.5` |
|
|
112
|
+
| `--metric p50\|p90\|both` | Which percentile series to inspect (default both) | `--metric p90` |
|
|
113
|
+
| `--tz ZONE` | Bucket time zone (default UTC) | `--tz Asia/Seoul` |
|
|
114
|
+
| `--only KEY` | Analyze only this key, repeatable | `--only search` |
|
|
115
|
+
| `--memory-limit SIZE` | DuckDB memory cap (default 1GB); raise it for very large inputs | `--memory-limit 4GB` |
|
|
116
|
+
| `--format table\|md\|svg\|json`, `--out FILE` | Output format and destination | `--format md --out report.md` |
|
|
117
|
+
| `--fail-on-step` | Exit with code 1 when a step is found | |
|
|
118
|
+
| `--lang en\|ko` | Screen language | `--lang ko` |
|
|
119
|
+
|
|
120
|
+
`latency-steps demo` takes the same output options plus `--seed`, `--per-hour` and `--save FILE` (keep the synthetic log as a JSONL file to experiment on).
|
|
121
|
+
|
|
122
|
+
### Messy logs are reported, not fatal
|
|
123
|
+
|
|
124
|
+
Broken lines, unparseable timestamps and values like `"12ms"` do not stop the run. Values are read as text and converted tolerantly; rows that cannot be interpreted are counted and shown. Here two bad lines were appended to a saved demo log:
|
|
125
|
+
|
|
126
|
+
```bash
|
|
127
|
+
latency-steps demo --save app.jsonl > /dev/null
|
|
128
|
+
printf 'not json at all\n{"ts":"yesterday-ish","duration_ms":"12ms","tool":"search","host":"h1","concurrency":2}\n' >> app.jsonl
|
|
129
|
+
latency-steps analyze app.jsonl --key tool --by host --only search --lang en | head -3
|
|
130
|
+
```
|
|
131
|
+
|
|
132
|
+
```text
|
|
133
|
+
Latency step report (latency-steps 0.1.1)
|
|
134
|
+
Input: app.jsonl - 20162 rows read, 20160 kept, dropped rows 2
|
|
135
|
+
dropped: unparseable line 1, bad timestamp 1
|
|
136
|
+
```
|
|
137
|
+
|
|
138
|
+
|
|
139
|
+
*Rows that could not be used are counted with a reason instead of silently vanishing.*
|
|
140
|
+
|
|
141
|
+
## How it decides
|
|
142
|
+
|
|
143
|
+
Think of a body-temperature chart. One hot afternoon is not a fever; a week at a higher level is.
|
|
144
|
+
|
|
145
|
+
1. **Percentiles, not averages.** For each key and time bucket it computes p50 (the typical request) and p90 (the slow tail). A regression that hits one host in four barely moves p50 but shows up in p90. Buckets with fewer than `--min-n` rows are skipped and reported, so a quiet night cannot fake a step.
|
|
146
|
+
2. **Change points on a log scale.** The series is split recursively where the medians on the two sides differ most, measured in units of how noisy the series is. Median-based, so a single odd day does not become a step. The log scale means "twice as slow" counts the same at 100 ms and at 3 s.
|
|
147
|
+
3. **Steps versus spikes.** Instead of tuning a penalty number, you say how long (`--min-run`) and how big (`--min-ratio`) a change must be. Short or reverting changes become observations.
|
|
148
|
+
4. **Stratify.** For every finding the windows before and after are split by each `--by` dimension, and each cell gets its row counts, before/after value, ratio and share of traffic.
|
|
149
|
+
|
|
150
|
+
## Reading the verdict
|
|
151
|
+
|
|
152
|
+
| Verdict | Meaning | Look at |
|
|
153
|
+
|---|---|---|
|
|
154
|
+
| `localized` | Only a few cells got slower | the host, region or version in the `where` column |
|
|
155
|
+
| `mix_shift` | Cell ratios are flat, or a cell that did not exist before appeared: the traffic changed, not the code path's speed | the `share before > after` column and `new` notes |
|
|
156
|
+
| `global` | At least 80% of cells got slower | a change that touches everything: deploy, dependency, shared service |
|
|
157
|
+
| `inconclusive` | Cells are too thin or two cells moved together | the table; collect more data |
|
|
158
|
+
|
|
159
|
+
With several `--by` dimensions the overall verdict is chosen in the order localized > mix shift > global > inconclusive. The `rerank` story in the demo is Simpson's paradox: judged by host every host is about x2.5 slower, yet by concurrency the old cells are flat and a cell `8+` that had no rows before carries the whole step.
|
|
160
|
+
|
|
161
|
+
```bash
|
|
162
|
+
latency-steps demo --only rerank --lang en
|
|
163
|
+
```
|
|
164
|
+
|
|
165
|
+
```text
|
|
166
|
+
by concurrency: mix shift - a cell that did not exist before appeared
|
|
167
|
+
cell rows before/after p90 ratio share before > after note
|
|
168
|
+
---- ----------------- --------------- ----- -------------------- ----
|
|
169
|
+
1-3 1459/793 779 ms > 797 ms x1.02 75% > 26%
|
|
170
|
+
4-7 479/1049 744 ms > 794 ms x1.07 25% > 34%
|
|
171
|
+
8+ 0/1240 - > 2.45 s - 0% > 40% new
|
|
172
|
+
```
|
|
173
|
+
|
|
174
|
+
|
|
175
|
+
*The verdicts are heuristics. Always read them together with the cell tables.*
|
|
176
|
+
|
|
177
|
+
## Reports
|
|
178
|
+
|
|
179
|
+
- `--format md --out report.md` writes Findings, Observations and the stratification tables as Markdown.
|
|
180
|
+
- `--format svg --out chart.svg` writes one small panel per key with p50 and p90 lines, a vertical line at each step and a dot on spikes.
|
|
181
|
+
|
|
182
|
+
```bash
|
|
183
|
+
latency-steps demo --format svg --out chart.svg --lang en
|
|
184
|
+
```
|
|
185
|
+
|
|
186
|
+
|
|
187
|
+
*The SVG report of the demo log.*
|
|
188
|
+
|
|
189
|
+
- `--format json` writes a stable structure with `"schema_version": 1`. Keys and verdict codes are always English; only the `summary` strings follow `--lang`.
|
|
190
|
+
|
|
191
|
+
## CI usage
|
|
192
|
+
|
|
193
|
+
Exit codes: `0` ok, `1` a step was found (only with `--fail-on-step`), `2` input or option error.
|
|
194
|
+
|
|
195
|
+
```bash
|
|
196
|
+
latency-steps demo --format json --fail-on-step --lang en > steps.json; echo "exit=$?"; grep -m 2 -E '"(schema_version|summary)"' steps.json | cut -c1-110
|
|
197
|
+
```
|
|
198
|
+
|
|
199
|
+
```text
|
|
200
|
+
exit=1
|
|
201
|
+
"schema_version": 1,
|
|
202
|
+
"summary": "embed: p90 went from 478 ms to 1.55 s (x3.25) starting 2026-10-13; verdict localized. rerank: p9
|
|
203
|
+
```
|
|
204
|
+
|
|
205
|
+

|
|
206
|
+
*In CI, replace `demo` with `analyze nightly.jsonl --key tool` and let the exit code fail the job.*
|
|
207
|
+
|
|
208
|
+
```yaml
|
|
209
|
+
- run: latency-steps analyze nightly.jsonl --key tool --by host --format json --fail-on-step > steps.json
|
|
210
|
+
```
|
|
211
|
+
|
|
212
|
+
## Language
|
|
213
|
+
|
|
214
|
+
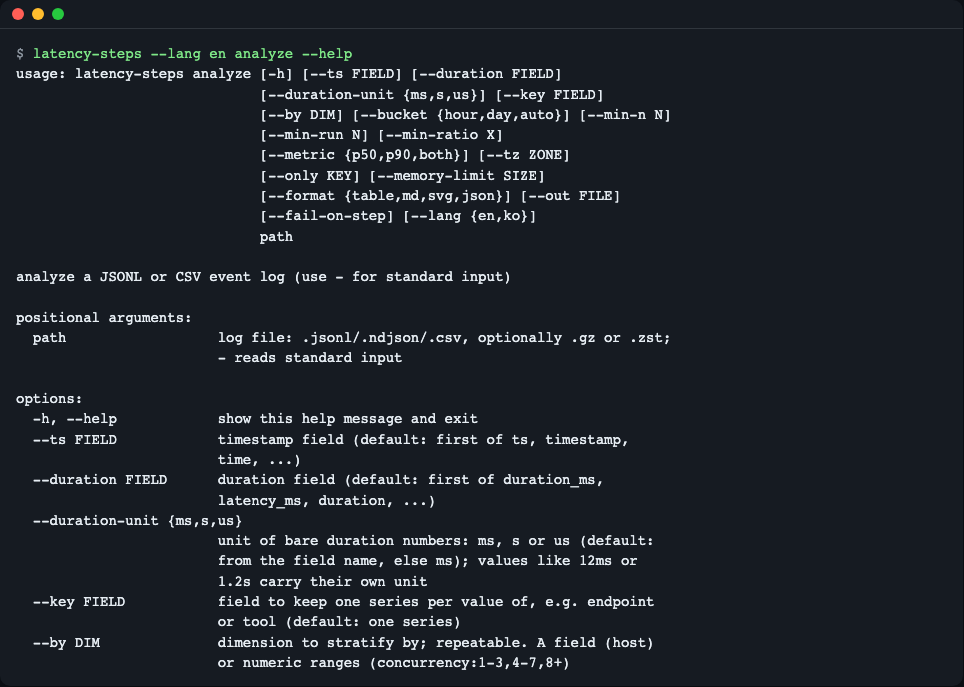
The screen is available in English and Korean. Priority: `--lang en|ko` > `LATENCY_STEPS_LANG` > `LC_ALL` / `LC_MESSAGES` / `LANG` (a value starting with `ko` selects Korean, anything else English). Help text, tables, Markdown and SVG labels follow it.
|
|
215
|
+
|
|
216
|
+
```bash
|
|
217
|
+
LATENCY_STEPS_LANG=ko latency-steps demo
|
|
218
|
+
```
|
|
219
|
+
|
|
220
|
+
|
|
221
|
+
*`latency-steps --lang en analyze --help`. The same screen exists in Korean.*
|
|
222
|
+
|
|
223
|
+
## How it works
|
|
224
|
+
|
|
225
|
+
```mermaid
|
|
226
|
+
flowchart LR
|
|
227
|
+
IN[JSONL / CSV / gz / stdin] --> ING[ingest<br/>tolerant parsing]
|
|
228
|
+
DEMO[demo<br/>synthetic log] --> ING
|
|
229
|
+
ING --> SER[series<br/>p50, p90 per key and bucket]
|
|
230
|
+
SER --> DET[detect<br/>robust binary segmentation]
|
|
231
|
+
DET -->|finding| STR[stratify<br/>cells before / after]
|
|
232
|
+
STR --> VER[verdict]
|
|
233
|
+
DET -->|observation| OUT
|
|
234
|
+
VER --> OUT[table, md, svg, json]
|
|
235
|
+
OUT --> EXIT[exit code 0 / 1 / 2]
|
|
236
|
+
```
|
|
237
|
+
|
|
238
|
+
Ingest and the percentile series run in DuckDB; detection and verdict rules are plain Python standard library (`math`), no numpy, scipy or ruptures.
|
|
239
|
+
|
|
240
|
+
## Limits
|
|
241
|
+
|
|
242
|
+
- Verdicts are heuristics read from cell tables. Two hosts degrading together, or thin cells, give `inconclusive`.
|
|
243
|
+
- A regression diluted across a large share of traffic is only caught through the p90 series. Per-dimension detection (`--detect-by`) is not in 0.1.1.
|
|
244
|
+
- Hourly buckets of a multi-day outage appear as a step up and a step down; use `--bucket day` for day-level questions.
|
|
245
|
+
- `.zst` input relies on DuckDB reading it and is not covered by an automated test.
|
|
246
|
+
- The field-name check for JSONL looks only at the first 50 non-blank lines, so a field that first appears later in the file is reported as missing; reorder the file or pass names that appear early.
|
|
247
|
+
- It answers "when" and "where", not "why". Pair the result with your deploy and config history.
|
|
248
|
+
|
|
249
|
+
## When to use it
|
|
250
|
+
|
|
251
|
+
- Good fit: you have raw event logs as files, you do not know when a slowdown started, and you want a first narrowing by host, region or load level without a server.
|
|
252
|
+
- Other tools for other jobs: change-point detection on already-aggregated benchmark metrics in a CI store, see [Apache Otava](https://github.com/apache/otava); change-point algorithms as a library, see [ruptures](https://github.com/deepcharles/ruptures); interactive exploration of live traces in a hosted service, see [Honeycomb BubbleUp](https://docs.honeycomb.io/investigate/analyze/identify-outliers/); browsing and querying log files, see [lnav](https://github.com/tstack/lnav).
|
|
253
|
+
|
|
254
|
+
## Troubleshooting
|
|
255
|
+
|
|
256
|
+
| Symptom | Cause | Fix |
|
|
257
|
+
|---|---|---|
|
|
258
|
+
| An installation error about the Python version | DuckDB 2.0 needs Python 3.11+ | Use `uv python install 3.13` or any 3.11+ interpreter |
|
|
259
|
+
| `error: input file not found` and exit code 2 | Wrong path | Check the path, or pass `-` to read standard input |
|
|
260
|
+
| `error: could not find the nosuch field. Fields seen: ts, duration_ms, ...` and exit code 2 | A `--key`, `--by`, `--ts` or `--duration` name does not exist in the file (checked in the first 50 non-blank lines of JSONL, and in the CSV header) | Use one of the names listed after `Fields seen:` |
|
|
261
|
+
| `error: the file is empty: no non-blank lines found.` and exit code 2 | The file has no content, for example a log rotation just happened | Point to the right file |
|
|
262
|
+
| No findings on a log you know regressed | Too few rows per bucket, or the step is shorter than `--min-run` buckets | Lower `--min-n`, use `--bucket hour`, or lower `--min-run` |
|
|
263
|
+
| Many "dropped rows" | The timestamp or duration field was picked wrongly | Pass `--ts` and `--duration` explicitly; see the `dropped:` reason line |
|
|
264
|
+
| Verdict `inconclusive` | Cells too thin or two cells moved together | Read the cell tables, add a better `--by` dimension |
|
|
265
|
+
|
|
266
|
+
## Development
|
|
267
|
+
|
|
268
|
+
```bash
|
|
269
|
+
uv sync
|
|
270
|
+
uv run pytest -q
|
|
271
|
+
```
|
|
272
|
+
|
|
273
|
+
```text
|
|
274
|
+
52 passed
|
|
275
|
+
```
|
|
276
|
+
|
|
277
|
+
Bugs and ideas are welcome as issues. Changes are listed in [CHANGELOG.md](https://github.com/LeeGyeongPil/latency-steps/blob/v0.1.1/CHANGELOG.md).
|
|
278
|
+
|
|
279
|
+
## More reading
|
|
280
|
+
|
|
281
|
+
- Apache Otava (change-point detection in performance results): https://github.com/apache/otava
|
|
282
|
+
- ruptures (change-point detection in Python): https://centre-borelli.github.io/ruptures-docs/
|
|
283
|
+
- DuckDB `quantile_cont`: https://duckdb.org/docs/2.0/sql/functions/aggregates.html
|
|
284
|
+
|
|
285
|
+
|
|
286
|
+
## License
|
|
287
|
+
|
|
288
|
+
MIT. All demo data is generated by the built-in generator.
|