labforge 0.1.1__tar.gz → 0.3.0__tar.gz
This diff represents the content of publicly available package versions that have been released to one of the supported registries. The information contained in this diff is provided for informational purposes only and reflects changes between package versions as they appear in their respective public registries.
- labforge-0.3.0/CHANGELOG.md +112 -0
- {labforge-0.1.1 → labforge-0.3.0}/PKG-INFO +48 -10
- {labforge-0.1.1 → labforge-0.3.0}/README.md +47 -9
- labforge-0.3.0/assets/multi_worker.png +0 -0
- labforge-0.3.0/assets/screenshot.png +0 -0
- labforge-0.3.0/assets/theme_glacier.png +0 -0
- labforge-0.3.0/assets/theme_instrument.png +0 -0
- labforge-0.3.0/assets/theme_lavender.png +0 -0
- labforge-0.3.0/assets/theme_mint.png +0 -0
- labforge-0.3.0/assets/theme_neon_gold.png +0 -0
- labforge-0.3.0/assets/theme_neon_violet.png +0 -0
- labforge-0.3.0/assets/theme_paper.png +0 -0
- labforge-0.3.0/assets/theme_retro_green.png +0 -0
- labforge-0.3.0/examples/demo_lab.py +271 -0
- labforge-0.3.0/examples/theory_gamma.md +37 -0
- {labforge-0.1.1 → labforge-0.3.0}/pyproject.toml +1 -1
- labforge-0.3.0/src/labforge/assets/fonts/Inter-OFL.txt +93 -0
- labforge-0.3.0/src/labforge/assets/fonts/Inter.ttf +0 -0
- labforge-0.3.0/src/labforge/assets/fonts/RobotoMono-OFL.txt +93 -0
- labforge-0.3.0/src/labforge/assets/fonts/RobotoMono.ttf +0 -0
- labforge-0.3.0/src/labforge/controls.py +365 -0
- labforge-0.3.0/src/labforge/lab.py +290 -0
- {labforge-0.1.1 → labforge-0.3.0}/src/labforge/mathtext.py +4 -0
- {labforge-0.1.1 → labforge-0.3.0}/src/labforge/pages/analysis.py +5 -4
- {labforge-0.1.1 → labforge-0.3.0}/src/labforge/pages/panel.py +47 -13
- {labforge-0.1.1 → labforge-0.3.0}/src/labforge/pages/scroll.py +33 -8
- labforge-0.3.0/src/labforge/pages/simulation.py +157 -0
- labforge-0.3.0/src/labforge/pages/theory.py +88 -0
- {labforge-0.1.1 → labforge-0.3.0}/src/labforge/pages/visualization.py +6 -5
- {labforge-0.1.1 → labforge-0.3.0}/src/labforge/param.py +35 -2
- labforge-0.3.0/src/labforge/registry.py +72 -0
- {labforge-0.1.1 → labforge-0.3.0}/src/labforge/scan.py +16 -3
- labforge-0.3.0/src/labforge/shell.py +351 -0
- labforge-0.3.0/src/labforge/state.py +207 -0
- {labforge-0.1.1 → labforge-0.3.0}/src/labforge/ui.py +56 -7
- {labforge-0.1.1 → labforge-0.3.0}/tests/stubs.py +7 -0
- labforge-0.3.0/tests/test_lab.py +235 -0
- {labforge-0.1.1 → labforge-0.3.0}/tests/test_param.py +38 -1
- {labforge-0.1.1 → labforge-0.3.0}/tests/test_scan.py +28 -0
- labforge-0.3.0/tests/test_smoke.py +366 -0
- labforge-0.1.1/CHANGELOG.md +0 -41
- labforge-0.1.1/assets/screenshot.png +0 -0
- labforge-0.1.1/assets/theme_glacier.png +0 -0
- labforge-0.1.1/assets/theme_instrument.png +0 -0
- labforge-0.1.1/assets/theme_lavender.png +0 -0
- labforge-0.1.1/assets/theme_mint.png +0 -0
- labforge-0.1.1/assets/theme_neon_gold.png +0 -0
- labforge-0.1.1/assets/theme_neon_violet.png +0 -0
- labforge-0.1.1/assets/theme_paper.png +0 -0
- labforge-0.1.1/assets/theme_retro_green.png +0 -0
- labforge-0.1.1/examples/demo_lab.py +0 -156
- labforge-0.1.1/src/labforge/controls.py +0 -278
- labforge-0.1.1/src/labforge/lab.py +0 -165
- labforge-0.1.1/src/labforge/pages/simulation.py +0 -71
- labforge-0.1.1/src/labforge/pages/theory.py +0 -40
- labforge-0.1.1/src/labforge/registry.py +0 -36
- labforge-0.1.1/src/labforge/shell.py +0 -220
- labforge-0.1.1/src/labforge/state.py +0 -74
- labforge-0.1.1/tests/test_lab.py +0 -77
- labforge-0.1.1/tests/test_smoke.py +0 -185
- {labforge-0.1.1 → labforge-0.3.0}/.gitignore +0 -0
- {labforge-0.1.1 → labforge-0.3.0}/LICENSE +0 -0
- {labforge-0.1.1 → labforge-0.3.0}/examples/theory.md +0 -0
- {labforge-0.1.1 → labforge-0.3.0}/src/labforge/__init__.py +0 -0
- {labforge-0.1.1 → labforge-0.3.0}/src/labforge/figures.py +0 -0
- {labforge-0.1.1 → labforge-0.3.0}/src/labforge/pages/__init__.py +0 -0
- {labforge-0.1.1 → labforge-0.3.0}/src/labforge/theme.py +0 -0
- {labforge-0.1.1 → labforge-0.3.0}/tests/test_render.py +0 -0
- {labforge-0.1.1 → labforge-0.3.0}/tests/test_theme.py +0 -0
|
@@ -0,0 +1,112 @@
|
|
|
1
|
+
# Changelog
|
|
2
|
+
|
|
3
|
+
Notable changes to labforge. Versions follow [semantic versioning](https://semver.org).
|
|
4
|
+
|
|
5
|
+
## 0.3.0 — 2026-07-22
|
|
6
|
+
|
|
7
|
+
- **Wordmark animation** — hovering the app title blows its letters apart and
|
|
8
|
+
keeps them floating until the pointer leaves; they spring back into the
|
|
9
|
+
wordmark on exit.
|
|
10
|
+
- **Motion** — rail navigation cross-fades between pages; a re-rendered figure
|
|
11
|
+
or recomputed result fades over its predecessor instead of flashing; the run
|
|
12
|
+
gate dissolves into the first output; the scan toggle fades between slider
|
|
13
|
+
and comma field; and the RUNNING status pulses gently while a run is in
|
|
14
|
+
flight.
|
|
15
|
+
- **Reading measure** — every page constrains its content to a 720 px column,
|
|
16
|
+
so prose keeps a comfortable line length and control rows stay compact
|
|
17
|
+
instead of stretching across the window. Displayed equations sit centered in
|
|
18
|
+
the measure, and figures scale down to fit it (staying crisp on high-dpi
|
|
19
|
+
screens) instead of clipping at the pane edge.
|
|
20
|
+
- **Uniform control rows** — text fields share the sliders' fixed label column
|
|
21
|
+
and the house field styling (hairline outline, square corners), and a new
|
|
22
|
+
`help` string on `Param` surfaces as a tooltip on the row label.
|
|
23
|
+
- **Parse feedback** — an unreadable text or comma-list entry now flags the
|
|
24
|
+
field ("invalid, kept ...") while the last good value stays live, instead of
|
|
25
|
+
falling back silently.
|
|
26
|
+
- **Error tone** — a worker, viz or analysis exception shows its status line in
|
|
27
|
+
the theme's error colour rather than the muted telemetry tone.
|
|
28
|
+
- **Scan progress** — a running scan reports `RUNNING · k/N` as the grid fills
|
|
29
|
+
in; `run_worker` and `LabState.run` accept an optional `progress(done, total)`
|
|
30
|
+
callback.
|
|
31
|
+
- **Explorable pre-run pages** — the Visualization and Analysis tabs, their
|
|
32
|
+
descriptions and controls now show before the first Run; the NO DATA card
|
|
33
|
+
sits only in the output slot. Tab labels speak the app's monospace voice.
|
|
34
|
+
- **Enter to run** — pressing Enter in any text field fires its section's
|
|
35
|
+
Run/Render/Compute action.
|
|
36
|
+
|
|
37
|
+
## 0.2.0 — 2026-07-22
|
|
38
|
+
|
|
39
|
+
- **`choice` param** — `Param(kind="choice", options=[...])` renders a Dropdown
|
|
40
|
+
and commits the selected string like any other control. The default must be
|
|
41
|
+
one of the options and the options must be non-empty (checked at registration);
|
|
42
|
+
a choice cannot be scanned.
|
|
43
|
+
- **Theory-page selector** — `set_theory_selector(name, param, theory)` puts a
|
|
44
|
+
`choice` control on the Theory page whose value both rebuilds the theory
|
|
45
|
+
markdown (via a `theory(selection) -> markdown` callback) and writes the lab's
|
|
46
|
+
shared context. The static `set_theory` behavior is unchanged; the selector
|
|
47
|
+
takes precedence when both are set.
|
|
48
|
+
- **Model-driven worker selector** — `set_theory_selector(..., selects_worker=True)`
|
|
49
|
+
makes the Theory dropdown the model switch: its options name registered workers,
|
|
50
|
+
and choosing one makes that worker active. The Simulation page then shows the
|
|
51
|
+
active worker as a single tab so it matches the tabbed Visualization and
|
|
52
|
+
Analysis pages.
|
|
53
|
+
- **Shared context** — a per-session lab-level context that the Theory selector
|
|
54
|
+
writes and any worker, viz or analysis reads by declaring a `context`
|
|
55
|
+
parameter (injected at call time, never rendered as a control). So a choice is
|
|
56
|
+
made once and every page sees it.
|
|
57
|
+
- **Multiple workers** — call `add_worker` more than once to build a lab with
|
|
58
|
+
several workers. Each worker keeps its own workspace (controls, last result,
|
|
59
|
+
and per-tab settings), and the `add_viz` / `add_analysis` calls after each
|
|
60
|
+
`add_worker` attach that worker's own tabs. Several workers need a way to choose
|
|
61
|
+
among them, checked at build: a `selects_worker` model selector, or
|
|
62
|
+
`worker_view="tabs"` to lay the workers out as Simulation-page tabs (sharing one
|
|
63
|
+
set of visualizations and analyses). There is no top-bar worker dropdown.
|
|
64
|
+
Single-worker labs are unchanged. (`worker_view` is `"panels"` by default, or
|
|
65
|
+
`"tabs"`.)
|
|
66
|
+
- **Bundled fonts** — the app now ships its typefaces (Inter and Roboto Mono),
|
|
67
|
+
so the browser view renders the same faces and weights as the desktop window
|
|
68
|
+
instead of falling back to the platform default.
|
|
69
|
+
- **Clearer theory errors** — `set_theory` now raises on a mistyped file path
|
|
70
|
+
(a missing `Path`, or a bare `".md"` string) instead of silently rendering the
|
|
71
|
+
path as a one-line page.
|
|
72
|
+
- **Non-blocking Run** — the worker now runs off the UI thread, so a slow worker
|
|
73
|
+
no longer freezes the window. Run shows a `RUNNING…` status and disables the
|
|
74
|
+
button until the run settles. Fast workers are unaffected.
|
|
75
|
+
|
|
76
|
+
## 0.1.1 — 2026-07-22
|
|
77
|
+
|
|
78
|
+
Packaging and documentation only; no functional change.
|
|
79
|
+
|
|
80
|
+
- Complete PyPI metadata: `readme`, keywords, trove classifiers, and project
|
|
81
|
+
URLs, so the project page renders the README and links back to the repository.
|
|
82
|
+
- README image links use absolute URLs, so screenshots and the theme gallery
|
|
83
|
+
render on the PyPI project page rather than showing as broken images.
|
|
84
|
+
|
|
85
|
+
## 0.1.0 — 2026-07-22
|
|
86
|
+
|
|
87
|
+
Initial release.
|
|
88
|
+
|
|
89
|
+
- **`Lab`** — register plain Python functions (one worker, any number of
|
|
90
|
+
visualization and analysis functions) and a markdown theory source, then
|
|
91
|
+
`open()` the assembled app: as a native desktop window or served to the
|
|
92
|
+
browser, laid out as four rail-navigated pages or one continuous scrolling
|
|
93
|
+
page. All registration is validated on the spot, so a malformed app fails at
|
|
94
|
+
assembly rather than mid-navigation.
|
|
95
|
+
- **`Param` specs** — each worker/viz/analysis kwarg gets a UI control from its
|
|
96
|
+
`Param` (or a shorthand string such as `"int"` or `"scalar or array"`);
|
|
97
|
+
bounded params render as sliders with live readouts, unbounded ones as
|
|
98
|
+
validated text fields, tuples as per-element fields. Defaults are inferred
|
|
99
|
+
from the function signature.
|
|
100
|
+
- **Parameter scans** — a kwarg declared `scan=True` accepts comma-separated
|
|
101
|
+
values; the worker runs once per point of the cartesian grid and downstream
|
|
102
|
+
functions receive a `ScanResult` of `(params, result)` records.
|
|
103
|
+
- **Analysis dispatch** — an analysis may return a dict (two-column table), a
|
|
104
|
+
list of dicts or a DataFrame (table), a string (markdown), or a matplotlib
|
|
105
|
+
figure; the return shape picks the rendering.
|
|
106
|
+
- **Themes** — eight palettes selected by `open(theme=...)`, four dark and
|
|
107
|
+
four light; chrome, plot palette and equation ink move together, and
|
|
108
|
+
`labforge.palette()` / `labforge.style(fig, ax)` let an author's figures
|
|
109
|
+
follow the active theme.
|
|
110
|
+
- **LaTeX theory** — `$$...$$` blocks in the theory markdown render as crisp
|
|
111
|
+
equation images via system LaTeX, falling back to matplotlib mathtext.
|
|
112
|
+
- **MIT licensed.**
|
|
@@ -1,6 +1,6 @@
|
|
|
1
1
|
Metadata-Version: 2.4
|
|
2
2
|
Name: labforge
|
|
3
|
-
Version: 0.
|
|
3
|
+
Version: 0.3.0
|
|
4
4
|
Summary: Wrap plain Python functions into a small scientific Flet desktop app: theory, simulation, visualization, analysis.
|
|
5
5
|
Project-URL: Homepage, https://github.com/laroccod/labforge
|
|
6
6
|
Project-URL: Repository, https://github.com/laroccod/labforge
|
|
@@ -35,15 +35,15 @@ Description-Content-Type: text/markdown
|
|
|
35
35
|
|
|
36
36
|
*By Daniel La Rocco*
|
|
37
37
|
|
|
38
|
-
## **Turn plain Python scripts into
|
|
38
|
+
## **Turn plain Python scripts into small scientific desktop apps.**
|
|
39
39
|
|
|
40
|
-
labforge wraps a simulation you already have — a function that produces data,
|
|
40
|
+
`labforge` wraps a simulation you already have — a function that produces data,
|
|
41
41
|
a function that plots it, a function that summarizes it — into a polished
|
|
42
42
|
four-section app following the **theory → simulation → visualization →
|
|
43
43
|
analysis** workflow. Pure Python, rendered with [Flet](https://flet.dev); no
|
|
44
44
|
HTML, no JavaScript, no callbacks to wire up.
|
|
45
45
|
|
|
46
|
-
You provide the science and labforge supplies the app shell, the parameter controls
|
|
46
|
+
You provide the science and `labforge` supplies the app shell, the parameter controls
|
|
47
47
|
generated from your function signatures, the parameter-scan engine,
|
|
48
48
|
LaTeX rendering for your theory notes, and eight instrument-panel themes, four
|
|
49
49
|
dark and four light.
|
|
@@ -69,7 +69,7 @@ def sample(mu=0.0, sigma=1.0, n=2000, seed=42):
|
|
|
69
69
|
|
|
70
70
|
|
|
71
71
|
lab.add_worker(sample, {
|
|
72
|
-
"mu": Param(default=0.0, bounds=(-5, 5), scan=True),
|
|
72
|
+
"mu": Param(default=0.0, bounds=(-5, 5), scan=True, help="Mean of the distribution"),
|
|
73
73
|
"sigma": Param(default=1.0, bounds=(0.1, 4), scan=True),
|
|
74
74
|
"n": Param(kind="int", default=2000, bounds=(10, 100_000)),
|
|
75
75
|
"seed": "int",
|
|
@@ -108,7 +108,9 @@ lab.open()
|
|
|
108
108
|
That is the whole app. `lab.open()` opens a native window with four pages —
|
|
109
109
|
Theory, Simulation, Visualization, Analysis — a slider for every bounded
|
|
110
110
|
parameter, a Run button, and tabs for each registered visualization and
|
|
111
|
-
analysis.
|
|
111
|
+
analysis. Content keeps a book-like reading measure, navigation and result
|
|
112
|
+
updates cross-fade rather than cut, and every page is explorable before the
|
|
113
|
+
first Run.
|
|
112
114
|
|
|
113
115
|
An extended version of this example — same lab plus a fitted-density overlay
|
|
114
116
|
and a Q-Q plot tab — lives at [`examples/demo_lab.py`](examples/demo_lab.py):
|
|
@@ -133,21 +135,28 @@ spec nothing:
|
|
|
133
135
|
| `Param(default=1.0)` / `"scalar"` / `"int"` | validated text field |
|
|
134
136
|
| `Param(..., scan=True)` / `"scalar or array"` / `"int or array"` | scannable (see below) |
|
|
135
137
|
| `"N-tuple"` (e.g. `"2-tuple"`) | one field per element |
|
|
138
|
+
| `Param(kind="choice", options=["a", "b"])` | dropdown |
|
|
139
|
+
|
|
140
|
+
Every `Param` also takes `label=` to rename its control and `help=` for a
|
|
141
|
+
tooltip on the control's label. Pressing Enter in any text field runs the
|
|
142
|
+
section it belongs to, and an entry that fails to parse flags the field while
|
|
143
|
+
the last good value stays live.
|
|
136
144
|
|
|
137
145
|
Validation happens at registration: unknown spec keys, defaults outside
|
|
138
146
|
bounds, or a scan spec on a non-worker function raise `ValueError` when the
|
|
139
147
|
app is assembled, never mid-use.
|
|
140
148
|
|
|
141
149
|
**Parameter scans.** A kwarg declared `scan=True` gets a scan toggle (bounded)
|
|
142
|
-
or a comma-separated field (unbounded). Enter `0, 1, 2` and labforge calls the
|
|
150
|
+
or a comma-separated field (unbounded). Enter `0, 1, 2` and `labforge` calls the
|
|
143
151
|
worker once per point of the cartesian grid across all scanned parameters —
|
|
144
|
-
the worker itself always receives scalars.
|
|
152
|
+
the worker itself always receives scalars. A long scan reports its progress in
|
|
153
|
+
the status line as the grid fills in. Downstream functions then receive a
|
|
145
154
|
`ScanResult`: a list of `(params, result)` records with `keys`, `values()` and
|
|
146
155
|
`axis(name)` helpers, distinguished with `isinstance(data, ScanResult)`.
|
|
147
156
|
|
|
148
157
|
**Visualizations.** Functions `viz(data, **kwargs)` returning a matplotlib
|
|
149
158
|
figure (bare or `(fig, ax)`). Each gets a tab with its own controls and a
|
|
150
|
-
Render button. Figures are yours — labforge only serializes them; the house
|
|
159
|
+
Render button. Figures are yours — `labforge` only serializes them; the house
|
|
151
160
|
style (`labforge.style(fig, ax)`) is strictly opt-in.
|
|
152
161
|
|
|
153
162
|
**Analyses.** Functions `analysis(data, **kwargs)` — the return shape picks
|
|
@@ -161,6 +170,35 @@ the rendering:
|
|
|
161
170
|
| Figure or `(fig, ax)` | image |
|
|
162
171
|
| anything else | its `repr` |
|
|
163
172
|
|
|
173
|
+
**Multiple workers.** Call `add_worker` more than once for a lab with several
|
|
174
|
+
workers. Each worker keeps its own workspace — its controls, its last result and
|
|
175
|
+
its per-tab settings — and the `add_viz` / `add_analysis` calls after each
|
|
176
|
+
`add_worker` attach that worker's own tabs, so switching workers and back
|
|
177
|
+
restores exactly what was there. Several workers need a way to choose among them
|
|
178
|
+
(checked at build): a `selects_worker` model selector, or `worker_view="tabs"`
|
|
179
|
+
to lay the workers out as Simulation-page tabs.
|
|
180
|
+
|
|
181
|
+
The clean way is a Theory-page selector with `selects_worker=True`: its options
|
|
182
|
+
name the workers, so choosing one both swaps the theory and makes that worker
|
|
183
|
+
active. There is no top-bar dropdown; the Simulation page shows the active
|
|
184
|
+
worker as a single tab, matching the tabbed Visualization and Analysis pages.
|
|
185
|
+
The demo (`examples/demo_lab.py`) uses this to switch between a normal and a
|
|
186
|
+
gamma model:
|
|
187
|
+
|
|
188
|
+
```python
|
|
189
|
+
lab.set_theory_selector(
|
|
190
|
+
"model",
|
|
191
|
+
Param(kind="choice", options=["Normal", "Gamma"]),
|
|
192
|
+
theory_for, # theory_for(selection) -> markdown
|
|
193
|
+
label="Distribution",
|
|
194
|
+
selects_worker=True,
|
|
195
|
+
)
|
|
196
|
+
lab.add_worker(sample, {...}, name="Normal") # its own viz/analysis tabs
|
|
197
|
+
lab.add_worker(sample_gamma, {...}, name="Gamma")
|
|
198
|
+
```
|
|
199
|
+
|
|
200
|
+
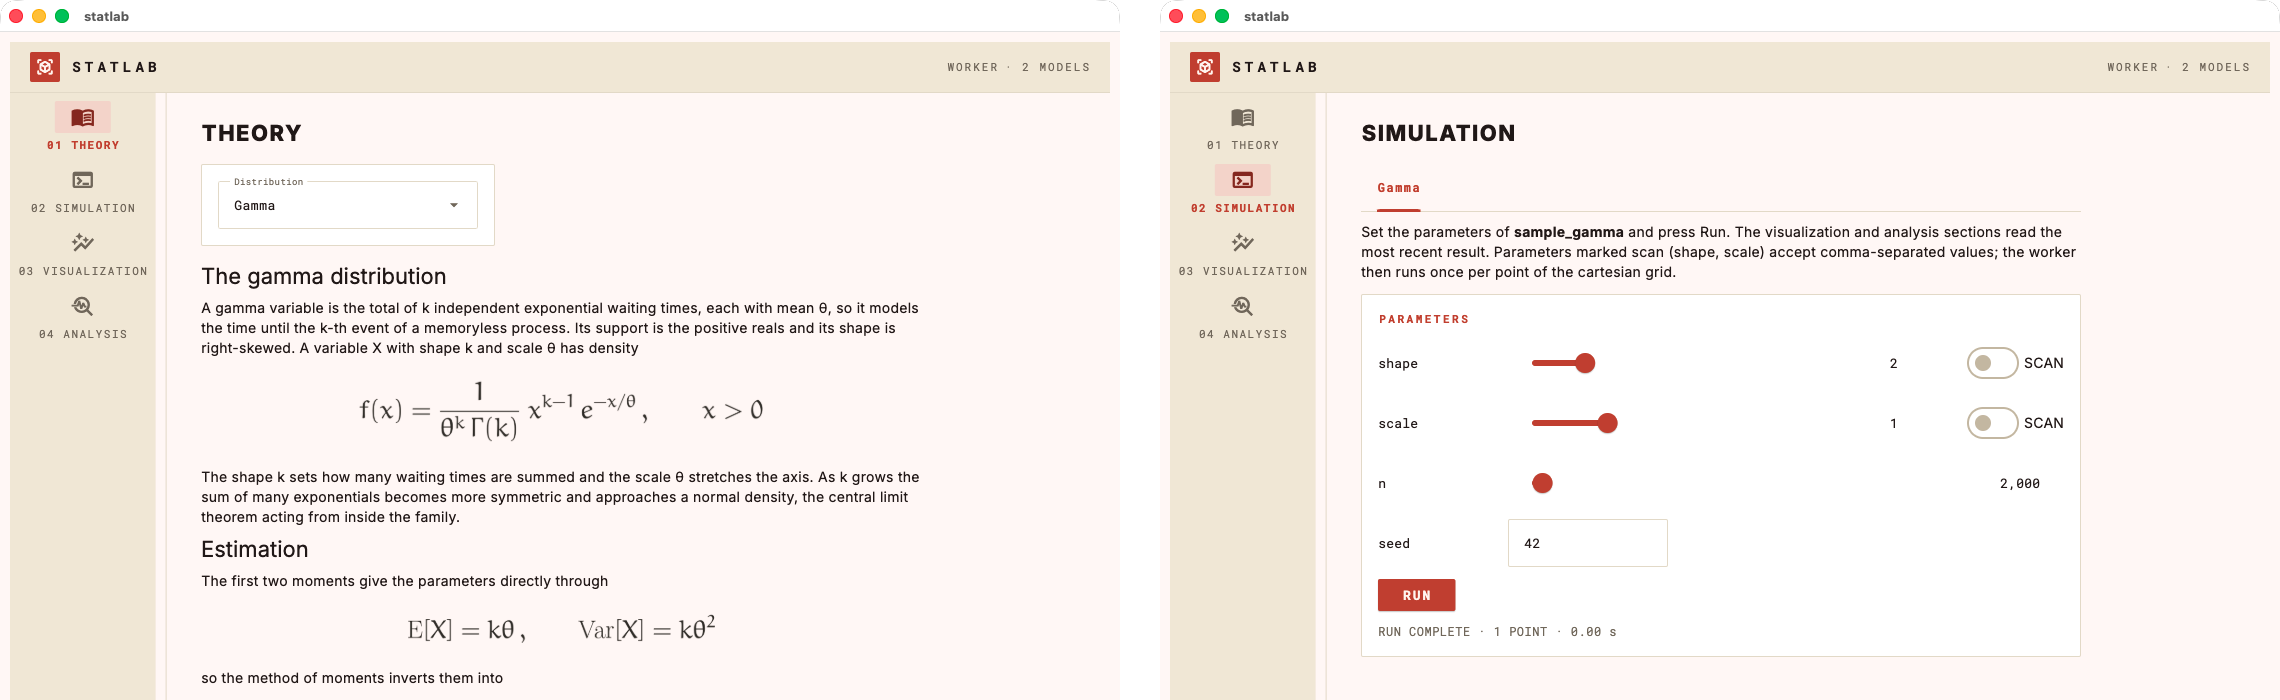
|
|
201
|
+
|
|
164
202
|
**Theory.** A markdown file or string. Displayed `$$...$$` equations render as
|
|
165
203
|
crisp images — through your system LaTeX toolchain when one is installed
|
|
166
204
|
(with the Euler math font), falling back to matplotlib's mathtext otherwise.
|
|
@@ -209,7 +247,7 @@ Requires Python ≥ 3.10.
|
|
|
209
247
|
pip install labforge
|
|
210
248
|
```
|
|
211
249
|
|
|
212
|
-
Or from a clone, to
|
|
250
|
+
Or from a clone, if you want to work on the code directly:
|
|
213
251
|
|
|
214
252
|
```bash
|
|
215
253
|
git clone https://github.com/laroccod/labforge.git
|
|
@@ -2,15 +2,15 @@
|
|
|
2
2
|
|
|
3
3
|
*By Daniel La Rocco*
|
|
4
4
|
|
|
5
|
-
## **Turn plain Python scripts into
|
|
5
|
+
## **Turn plain Python scripts into small scientific desktop apps.**
|
|
6
6
|
|
|
7
|
-
labforge wraps a simulation you already have — a function that produces data,
|
|
7
|
+
`labforge` wraps a simulation you already have — a function that produces data,
|
|
8
8
|
a function that plots it, a function that summarizes it — into a polished
|
|
9
9
|
four-section app following the **theory → simulation → visualization →
|
|
10
10
|
analysis** workflow. Pure Python, rendered with [Flet](https://flet.dev); no
|
|
11
11
|
HTML, no JavaScript, no callbacks to wire up.
|
|
12
12
|
|
|
13
|
-
You provide the science and labforge supplies the app shell, the parameter controls
|
|
13
|
+
You provide the science and `labforge` supplies the app shell, the parameter controls
|
|
14
14
|
generated from your function signatures, the parameter-scan engine,
|
|
15
15
|
LaTeX rendering for your theory notes, and eight instrument-panel themes, four
|
|
16
16
|
dark and four light.
|
|
@@ -36,7 +36,7 @@ def sample(mu=0.0, sigma=1.0, n=2000, seed=42):
|
|
|
36
36
|
|
|
37
37
|
|
|
38
38
|
lab.add_worker(sample, {
|
|
39
|
-
"mu": Param(default=0.0, bounds=(-5, 5), scan=True),
|
|
39
|
+
"mu": Param(default=0.0, bounds=(-5, 5), scan=True, help="Mean of the distribution"),
|
|
40
40
|
"sigma": Param(default=1.0, bounds=(0.1, 4), scan=True),
|
|
41
41
|
"n": Param(kind="int", default=2000, bounds=(10, 100_000)),
|
|
42
42
|
"seed": "int",
|
|
@@ -75,7 +75,9 @@ lab.open()
|
|
|
75
75
|
That is the whole app. `lab.open()` opens a native window with four pages —
|
|
76
76
|
Theory, Simulation, Visualization, Analysis — a slider for every bounded
|
|
77
77
|
parameter, a Run button, and tabs for each registered visualization and
|
|
78
|
-
analysis.
|
|
78
|
+
analysis. Content keeps a book-like reading measure, navigation and result
|
|
79
|
+
updates cross-fade rather than cut, and every page is explorable before the
|
|
80
|
+
first Run.
|
|
79
81
|
|
|
80
82
|
An extended version of this example — same lab plus a fitted-density overlay
|
|
81
83
|
and a Q-Q plot tab — lives at [`examples/demo_lab.py`](examples/demo_lab.py):
|
|
@@ -100,21 +102,28 @@ spec nothing:
|
|
|
100
102
|
| `Param(default=1.0)` / `"scalar"` / `"int"` | validated text field |
|
|
101
103
|
| `Param(..., scan=True)` / `"scalar or array"` / `"int or array"` | scannable (see below) |
|
|
102
104
|
| `"N-tuple"` (e.g. `"2-tuple"`) | one field per element |
|
|
105
|
+
| `Param(kind="choice", options=["a", "b"])` | dropdown |
|
|
106
|
+
|
|
107
|
+
Every `Param` also takes `label=` to rename its control and `help=` for a
|
|
108
|
+
tooltip on the control's label. Pressing Enter in any text field runs the
|
|
109
|
+
section it belongs to, and an entry that fails to parse flags the field while
|
|
110
|
+
the last good value stays live.
|
|
103
111
|
|
|
104
112
|
Validation happens at registration: unknown spec keys, defaults outside
|
|
105
113
|
bounds, or a scan spec on a non-worker function raise `ValueError` when the
|
|
106
114
|
app is assembled, never mid-use.
|
|
107
115
|
|
|
108
116
|
**Parameter scans.** A kwarg declared `scan=True` gets a scan toggle (bounded)
|
|
109
|
-
or a comma-separated field (unbounded). Enter `0, 1, 2` and labforge calls the
|
|
117
|
+
or a comma-separated field (unbounded). Enter `0, 1, 2` and `labforge` calls the
|
|
110
118
|
worker once per point of the cartesian grid across all scanned parameters —
|
|
111
|
-
the worker itself always receives scalars.
|
|
119
|
+
the worker itself always receives scalars. A long scan reports its progress in
|
|
120
|
+
the status line as the grid fills in. Downstream functions then receive a
|
|
112
121
|
`ScanResult`: a list of `(params, result)` records with `keys`, `values()` and
|
|
113
122
|
`axis(name)` helpers, distinguished with `isinstance(data, ScanResult)`.
|
|
114
123
|
|
|
115
124
|
**Visualizations.** Functions `viz(data, **kwargs)` returning a matplotlib
|
|
116
125
|
figure (bare or `(fig, ax)`). Each gets a tab with its own controls and a
|
|
117
|
-
Render button. Figures are yours — labforge only serializes them; the house
|
|
126
|
+
Render button. Figures are yours — `labforge` only serializes them; the house
|
|
118
127
|
style (`labforge.style(fig, ax)`) is strictly opt-in.
|
|
119
128
|
|
|
120
129
|
**Analyses.** Functions `analysis(data, **kwargs)` — the return shape picks
|
|
@@ -128,6 +137,35 @@ the rendering:
|
|
|
128
137
|
| Figure or `(fig, ax)` | image |
|
|
129
138
|
| anything else | its `repr` |
|
|
130
139
|
|
|
140
|
+
**Multiple workers.** Call `add_worker` more than once for a lab with several
|
|
141
|
+
workers. Each worker keeps its own workspace — its controls, its last result and
|
|
142
|
+
its per-tab settings — and the `add_viz` / `add_analysis` calls after each
|
|
143
|
+
`add_worker` attach that worker's own tabs, so switching workers and back
|
|
144
|
+
restores exactly what was there. Several workers need a way to choose among them
|
|
145
|
+
(checked at build): a `selects_worker` model selector, or `worker_view="tabs"`
|
|
146
|
+
to lay the workers out as Simulation-page tabs.
|
|
147
|
+
|
|
148
|
+
The clean way is a Theory-page selector with `selects_worker=True`: its options
|
|
149
|
+
name the workers, so choosing one both swaps the theory and makes that worker
|
|
150
|
+
active. There is no top-bar dropdown; the Simulation page shows the active
|
|
151
|
+
worker as a single tab, matching the tabbed Visualization and Analysis pages.
|
|
152
|
+
The demo (`examples/demo_lab.py`) uses this to switch between a normal and a
|
|
153
|
+
gamma model:
|
|
154
|
+
|
|
155
|
+
```python
|
|
156
|
+
lab.set_theory_selector(
|
|
157
|
+
"model",
|
|
158
|
+
Param(kind="choice", options=["Normal", "Gamma"]),
|
|
159
|
+
theory_for, # theory_for(selection) -> markdown
|
|
160
|
+
label="Distribution",
|
|
161
|
+
selects_worker=True,
|
|
162
|
+
)
|
|
163
|
+
lab.add_worker(sample, {...}, name="Normal") # its own viz/analysis tabs
|
|
164
|
+
lab.add_worker(sample_gamma, {...}, name="Gamma")
|
|
165
|
+
```
|
|
166
|
+
|
|
167
|
+

|
|
168
|
+
|
|
131
169
|
**Theory.** A markdown file or string. Displayed `$$...$$` equations render as
|
|
132
170
|
crisp images — through your system LaTeX toolchain when one is installed
|
|
133
171
|
(with the Euler math font), falling back to matplotlib's mathtext otherwise.
|
|
@@ -176,7 +214,7 @@ Requires Python ≥ 3.10.
|
|
|
176
214
|
pip install labforge
|
|
177
215
|
```
|
|
178
216
|
|
|
179
|
-
Or from a clone, to
|
|
217
|
+
Or from a clone, if you want to work on the code directly:
|
|
180
218
|
|
|
181
219
|
```bash
|
|
182
220
|
git clone https://github.com/laroccod/labforge.git
|
|
Binary file
|
|
Binary file
|
|
Binary file
|
|
Binary file
|
|
Binary file
|
|
Binary file
|
|
Binary file
|
|
Binary file
|
|
Binary file
|
|
Binary file
|
|
@@ -0,0 +1,271 @@
|
|
|
1
|
+
"""
|
|
2
|
+
Demo lab
|
|
3
|
+
|
|
4
|
+
Two samplers on one lab, to show off multiple workers and the Theory-page model
|
|
5
|
+
selector. A normal worker carries a histogram (with fitted density), a Q-Q plot
|
|
6
|
+
and a moments table; a gamma worker carries its own histogram and a
|
|
7
|
+
method-of-moments fit. The Theory-page dropdown is the single model switch
|
|
8
|
+
(selects_worker=True): choosing Normal or Gamma swaps the theory math and makes
|
|
9
|
+
that worker active, so the Simulation page shows its parameters as one tab and
|
|
10
|
+
the Visualization and Analysis pages show its own tabs. No top-bar worker
|
|
11
|
+
dropdown is needed. Each worker handles both a single run and a parameter scan.
|
|
12
|
+
Launch with `python examples/demo_lab.py`; add `--browser [port]` to serve it to
|
|
13
|
+
the default web browser instead, `--scroll` for one continuous scrolling page
|
|
14
|
+
instead of four, and/or `--theme <name>` to try a colour scheme (see
|
|
15
|
+
labforge.themes()).
|
|
16
|
+
"""
|
|
17
|
+
|
|
18
|
+
import argparse
|
|
19
|
+
from math import gamma as gamma_func
|
|
20
|
+
from pathlib import Path
|
|
21
|
+
from statistics import NormalDist
|
|
22
|
+
|
|
23
|
+
import matplotlib.pyplot as plt
|
|
24
|
+
import numpy as np
|
|
25
|
+
|
|
26
|
+
import labforge
|
|
27
|
+
from labforge import Lab, Param, ScanResult
|
|
28
|
+
|
|
29
|
+
lab = Lab("statlab")
|
|
30
|
+
|
|
31
|
+
# The Theory page carries a dropdown that swaps the whole page between the two
|
|
32
|
+
# families; each option maps to its own markdown source.
|
|
33
|
+
THEORY = {
|
|
34
|
+
"Normal": Path(__file__).with_name("theory.md").read_text(encoding="utf-8"),
|
|
35
|
+
"Gamma": Path(__file__).with_name("theory_gamma.md").read_text(encoding="utf-8"),
|
|
36
|
+
}
|
|
37
|
+
|
|
38
|
+
|
|
39
|
+
def theory_for(model):
|
|
40
|
+
"""The theory markdown for the selected distribution."""
|
|
41
|
+
return THEORY[model]
|
|
42
|
+
|
|
43
|
+
|
|
44
|
+
lab.set_theory_selector(
|
|
45
|
+
"model",
|
|
46
|
+
Param(kind="choice", options=["Normal", "Gamma"], default="Normal"),
|
|
47
|
+
theory_for,
|
|
48
|
+
label="Distribution",
|
|
49
|
+
selects_worker=True,
|
|
50
|
+
)
|
|
51
|
+
|
|
52
|
+
|
|
53
|
+
def sample(mu=0.0, sigma=1.0, n=2000, seed=42):
|
|
54
|
+
"""Draw n normal variates; reproducible for a given seed."""
|
|
55
|
+
return np.random.default_rng(seed).normal(mu, sigma, n)
|
|
56
|
+
|
|
57
|
+
|
|
58
|
+
lab.add_worker(
|
|
59
|
+
sample,
|
|
60
|
+
{
|
|
61
|
+
"mu": Param(default=0.0, bounds=(-5, 5), scan=True, help="Mean of the distribution"),
|
|
62
|
+
"sigma": Param(
|
|
63
|
+
default=1.0, bounds=(0.1, 4), scan=True, help="Standard deviation of the distribution"
|
|
64
|
+
),
|
|
65
|
+
"n": Param(kind="int", default=2000, bounds=(10, 100_000), help="Sample size of the draw"),
|
|
66
|
+
"seed": Param(kind="int", help="Seed of the random generator"),
|
|
67
|
+
},
|
|
68
|
+
name="Normal",
|
|
69
|
+
)
|
|
70
|
+
|
|
71
|
+
|
|
72
|
+
def histogram(data, bins=40):
|
|
73
|
+
"""Density histogram of the draw; a scan overlays one histogram per point."""
|
|
74
|
+
fig, ax = plt.subplots(figsize=(7, 3.4))
|
|
75
|
+
if isinstance(data, ScanResult):
|
|
76
|
+
for params, draws in data:
|
|
77
|
+
label = ", ".join(f"{key} = {params[key]:g}" for key in data.keys)
|
|
78
|
+
ax.hist(draws, bins=bins, density=True, alpha=0.5, label=label)
|
|
79
|
+
else:
|
|
80
|
+
colors = labforge.palette()
|
|
81
|
+
ax.hist(data, bins=bins, density=True, color=colors.data, label="draw")
|
|
82
|
+
# The density fitted by maximum likelihood, over the sample's own range.
|
|
83
|
+
mean, std = np.mean(data), np.std(data, ddof=1)
|
|
84
|
+
x = np.linspace(np.min(data), np.max(data), 400)
|
|
85
|
+
pdf = np.exp(-((x - mean) ** 2) / (2 * std**2)) / (std * np.sqrt(2 * np.pi))
|
|
86
|
+
ax.plot(x, pdf, color=colors.model, linewidth=1.6, label="fitted density")
|
|
87
|
+
ax.legend()
|
|
88
|
+
ax.set_xlabel("x")
|
|
89
|
+
ax.set_ylabel("density")
|
|
90
|
+
labforge.style(fig, ax)
|
|
91
|
+
return fig, ax
|
|
92
|
+
|
|
93
|
+
|
|
94
|
+
lab.add_viz(
|
|
95
|
+
histogram,
|
|
96
|
+
"Histogram",
|
|
97
|
+
"Density-normalized histogram of the most recent draw, with the "
|
|
98
|
+
"maximum-likelihood normal density on top. On a scan, one translucent "
|
|
99
|
+
"histogram per grid point shows how μ shifts and σ stretches the density.",
|
|
100
|
+
{"bins": Param(kind="int", default=40, bounds=(5, 200))},
|
|
101
|
+
)
|
|
102
|
+
|
|
103
|
+
|
|
104
|
+
def qq_plot(data):
|
|
105
|
+
"""Standardized order statistics against normal quantiles; scans overlay grid points."""
|
|
106
|
+
fig, ax = plt.subplots(figsize=(7, 3.4))
|
|
107
|
+
colors = labforge.palette()
|
|
108
|
+
|
|
109
|
+
def quantiles(draws):
|
|
110
|
+
draws = np.asarray(draws)
|
|
111
|
+
probs = (np.arange(1, len(draws) + 1) - 0.5) / len(draws)
|
|
112
|
+
theory = np.array([NormalDist().inv_cdf(p) for p in probs])
|
|
113
|
+
sample = np.sort((draws - np.mean(draws)) / np.std(draws, ddof=1))
|
|
114
|
+
return theory, sample
|
|
115
|
+
|
|
116
|
+
if isinstance(data, ScanResult):
|
|
117
|
+
for params, draws in data:
|
|
118
|
+
theory, sample = quantiles(draws)
|
|
119
|
+
label = ", ".join(f"{key} = {params[key]:g}" for key in data.keys)
|
|
120
|
+
ax.plot(theory, sample, linewidth=1.2, alpha=0.7, label=label)
|
|
121
|
+
else:
|
|
122
|
+
theory, sample = quantiles(data)
|
|
123
|
+
ax.plot(theory, sample, linewidth=0, marker=".", markersize=3, color=colors.data)
|
|
124
|
+
lims = ax.get_xlim()
|
|
125
|
+
ax.plot(lims, lims, color=colors.model, linewidth=1.2, linestyle="--", label="diagonal")
|
|
126
|
+
ax.legend()
|
|
127
|
+
ax.set_xlabel("normal quantile")
|
|
128
|
+
ax.set_ylabel("sample quantile")
|
|
129
|
+
labforge.style(fig, ax)
|
|
130
|
+
return fig, ax
|
|
131
|
+
|
|
132
|
+
|
|
133
|
+
lab.add_viz(
|
|
134
|
+
qq_plot,
|
|
135
|
+
"Q-Q plot",
|
|
136
|
+
"Standardized order statistics of the draw against standard-normal "
|
|
137
|
+
"quantiles. A Gaussian sample lies on the dashed diagonal, and "
|
|
138
|
+
"standardizing collapses every grid point of a scan onto the same line.",
|
|
139
|
+
)
|
|
140
|
+
|
|
141
|
+
|
|
142
|
+
def moments(data):
|
|
143
|
+
"""Sample moments and the standard error of the mean; one row per grid point on a scan."""
|
|
144
|
+
|
|
145
|
+
def row(draws):
|
|
146
|
+
mean, std = float(np.mean(draws)), float(np.std(draws, ddof=1))
|
|
147
|
+
return {"mean": mean, "std": std, "se(mean)": std / np.sqrt(len(draws))}
|
|
148
|
+
|
|
149
|
+
if isinstance(data, ScanResult):
|
|
150
|
+
return [{**params, **row(draws)} for params, draws in data]
|
|
151
|
+
return row(data)
|
|
152
|
+
|
|
153
|
+
|
|
154
|
+
lab.add_analysis(
|
|
155
|
+
moments,
|
|
156
|
+
"Moments",
|
|
157
|
+
"The sample mean and standard deviation estimate μ and σ directly, and "
|
|
158
|
+
"for the normal family they are also the maximum-likelihood estimators. "
|
|
159
|
+
"The standard error of the mean shrinks like 1/√n.",
|
|
160
|
+
)
|
|
161
|
+
|
|
162
|
+
|
|
163
|
+
# The gamma worker. Registering a second worker turns the top bar into a model
|
|
164
|
+
# selector, and add_viz/add_analysis below attach to this worker, not the normal
|
|
165
|
+
# one, so each model owns its own tabs.
|
|
166
|
+
def sample_gamma(shape=2.0, scale=1.0, n=2000, seed=42):
|
|
167
|
+
"""Draw n gamma variates; reproducible for a given seed."""
|
|
168
|
+
return np.random.default_rng(seed).gamma(shape, scale, n)
|
|
169
|
+
|
|
170
|
+
|
|
171
|
+
lab.add_worker(
|
|
172
|
+
sample_gamma,
|
|
173
|
+
{
|
|
174
|
+
"shape": Param(default=2.0, bounds=(0.5, 10), scan=True, help="Shape parameter k"),
|
|
175
|
+
"scale": Param(default=1.0, bounds=(0.1, 4), scan=True, help="Scale parameter θ"),
|
|
176
|
+
"n": Param(kind="int", default=2000, bounds=(10, 100_000), help="Sample size of the draw"),
|
|
177
|
+
"seed": Param(kind="int", help="Seed of the random generator"),
|
|
178
|
+
},
|
|
179
|
+
name="Gamma",
|
|
180
|
+
)
|
|
181
|
+
|
|
182
|
+
|
|
183
|
+
def gamma_density(x, shape, scale):
|
|
184
|
+
"""The gamma density at x for shape k and scale θ."""
|
|
185
|
+
return x ** (shape - 1) * np.exp(-x / scale) / (scale**shape * gamma_func(shape))
|
|
186
|
+
|
|
187
|
+
|
|
188
|
+
def gamma_histogram(data, bins=40):
|
|
189
|
+
"""Density histogram of the draw; a scan overlays one histogram per point."""
|
|
190
|
+
fig, ax = plt.subplots(figsize=(7, 3.4))
|
|
191
|
+
if isinstance(data, ScanResult):
|
|
192
|
+
for params, draws in data:
|
|
193
|
+
label = ", ".join(f"{key} = {params[key]:g}" for key in data.keys)
|
|
194
|
+
ax.hist(draws, bins=bins, density=True, alpha=0.5, label=label)
|
|
195
|
+
else:
|
|
196
|
+
colors = labforge.palette()
|
|
197
|
+
ax.hist(data, bins=bins, density=True, color=colors.data, label="draw")
|
|
198
|
+
# The method-of-moments fit: shape and scale from the sample mean and variance.
|
|
199
|
+
mean, var = np.mean(data), np.var(data, ddof=1)
|
|
200
|
+
shape, scale = mean**2 / var, var / mean
|
|
201
|
+
x = np.linspace(np.min(data), np.max(data), 400)
|
|
202
|
+
ax.plot(
|
|
203
|
+
x,
|
|
204
|
+
gamma_density(x, shape, scale),
|
|
205
|
+
color=colors.model,
|
|
206
|
+
linewidth=1.6,
|
|
207
|
+
label="fitted density",
|
|
208
|
+
)
|
|
209
|
+
ax.legend()
|
|
210
|
+
ax.set_xlabel("x")
|
|
211
|
+
ax.set_ylabel("density")
|
|
212
|
+
labforge.style(fig, ax)
|
|
213
|
+
return fig, ax
|
|
214
|
+
|
|
215
|
+
|
|
216
|
+
lab.add_viz(
|
|
217
|
+
gamma_histogram,
|
|
218
|
+
"Histogram",
|
|
219
|
+
"Density-normalized histogram of the most recent draw, with the "
|
|
220
|
+
"method-of-moments gamma density on top. On a scan, one translucent "
|
|
221
|
+
"histogram per grid point shows how the shape sharpens and the scale "
|
|
222
|
+
"stretches the density.",
|
|
223
|
+
{"bins": Param(kind="int", default=40, bounds=(5, 200))},
|
|
224
|
+
)
|
|
225
|
+
|
|
226
|
+
|
|
227
|
+
def gamma_fit(data):
|
|
228
|
+
"""Method-of-moments shape and scale from the sample moments; one row per grid point on a scan."""
|
|
229
|
+
|
|
230
|
+
def row(draws):
|
|
231
|
+
mean, var = float(np.mean(draws)), float(np.var(draws, ddof=1))
|
|
232
|
+
return {"shape": mean**2 / var, "scale": var / mean, "mean": mean}
|
|
233
|
+
|
|
234
|
+
if isinstance(data, ScanResult):
|
|
235
|
+
return [{**params, **row(draws)} for params, draws in data]
|
|
236
|
+
return row(data)
|
|
237
|
+
|
|
238
|
+
|
|
239
|
+
lab.add_analysis(
|
|
240
|
+
gamma_fit,
|
|
241
|
+
"Fit",
|
|
242
|
+
"The mean is kθ and the variance is kθ², so the method of moments recovers "
|
|
243
|
+
"the shape as X̄²/s² and the scale as s²/X̄. The maximum-likelihood shape "
|
|
244
|
+
"has no closed form for this family, so the sample moments are the quick "
|
|
245
|
+
"estimate.",
|
|
246
|
+
)
|
|
247
|
+
|
|
248
|
+
|
|
249
|
+
if __name__ == "__main__":
|
|
250
|
+
parser = argparse.ArgumentParser(description="Run the labforge Gaussian demo.")
|
|
251
|
+
parser.add_argument(
|
|
252
|
+
"--browser",
|
|
253
|
+
nargs="?",
|
|
254
|
+
const=0,
|
|
255
|
+
type=int,
|
|
256
|
+
metavar="PORT",
|
|
257
|
+
help="serve to the default web browser (0 picks a free port)",
|
|
258
|
+
)
|
|
259
|
+
parser.add_argument("--scroll", action="store_true", help="one scrolling page, no rail")
|
|
260
|
+
parser.add_argument("--theme", choices=labforge.themes(), help="colour scheme")
|
|
261
|
+
args = parser.parse_args()
|
|
262
|
+
|
|
263
|
+
# Only pass theme when --theme asks for one: open() already defaults to it,
|
|
264
|
+
# so the demo never carries its own copy to drift.
|
|
265
|
+
opts = {"layout": "scroll" if args.scroll else "pages"}
|
|
266
|
+
if args.theme:
|
|
267
|
+
opts["theme"] = args.theme
|
|
268
|
+
if args.browser is not None:
|
|
269
|
+
lab.open("browser", port=args.browser, **opts)
|
|
270
|
+
else:
|
|
271
|
+
lab.open(**opts)
|