labforge 0.1.0__tar.gz
This diff represents the content of publicly available package versions that have been released to one of the supported registries. The information contained in this diff is provided for informational purposes only and reflects changes between package versions as they appear in their respective public registries.
- labforge-0.1.0/.gitignore +11 -0
- labforge-0.1.0/CHANGELOG.md +32 -0
- labforge-0.1.0/LICENSE +21 -0
- labforge-0.1.0/PKG-INFO +232 -0
- labforge-0.1.0/README.md +199 -0
- labforge-0.1.0/assets/screenshot.png +0 -0
- labforge-0.1.0/assets/theme_glacier.png +0 -0
- labforge-0.1.0/assets/theme_instrument.png +0 -0
- labforge-0.1.0/assets/theme_lavender.png +0 -0
- labforge-0.1.0/assets/theme_mint.png +0 -0
- labforge-0.1.0/assets/theme_neon_gold.png +0 -0
- labforge-0.1.0/assets/theme_neon_violet.png +0 -0
- labforge-0.1.0/assets/theme_paper.png +0 -0
- labforge-0.1.0/assets/theme_retro_green.png +0 -0
- labforge-0.1.0/examples/demo_lab.py +156 -0
- labforge-0.1.0/examples/theory.md +41 -0
- labforge-0.1.0/pyproject.toml +60 -0
- labforge-0.1.0/src/labforge/__init__.py +17 -0
- labforge-0.1.0/src/labforge/controls.py +278 -0
- labforge-0.1.0/src/labforge/figures.py +92 -0
- labforge-0.1.0/src/labforge/lab.py +165 -0
- labforge-0.1.0/src/labforge/mathtext.py +140 -0
- labforge-0.1.0/src/labforge/pages/__init__.py +6 -0
- labforge-0.1.0/src/labforge/pages/analysis.py +99 -0
- labforge-0.1.0/src/labforge/pages/panel.py +109 -0
- labforge-0.1.0/src/labforge/pages/scroll.py +61 -0
- labforge-0.1.0/src/labforge/pages/simulation.py +71 -0
- labforge-0.1.0/src/labforge/pages/theory.py +40 -0
- labforge-0.1.0/src/labforge/pages/visualization.py +30 -0
- labforge-0.1.0/src/labforge/param.py +186 -0
- labforge-0.1.0/src/labforge/registry.py +36 -0
- labforge-0.1.0/src/labforge/scan.py +75 -0
- labforge-0.1.0/src/labforge/shell.py +220 -0
- labforge-0.1.0/src/labforge/state.py +74 -0
- labforge-0.1.0/src/labforge/theme.py +323 -0
- labforge-0.1.0/src/labforge/ui.py +167 -0
- labforge-0.1.0/tests/stubs.py +129 -0
- labforge-0.1.0/tests/test_lab.py +77 -0
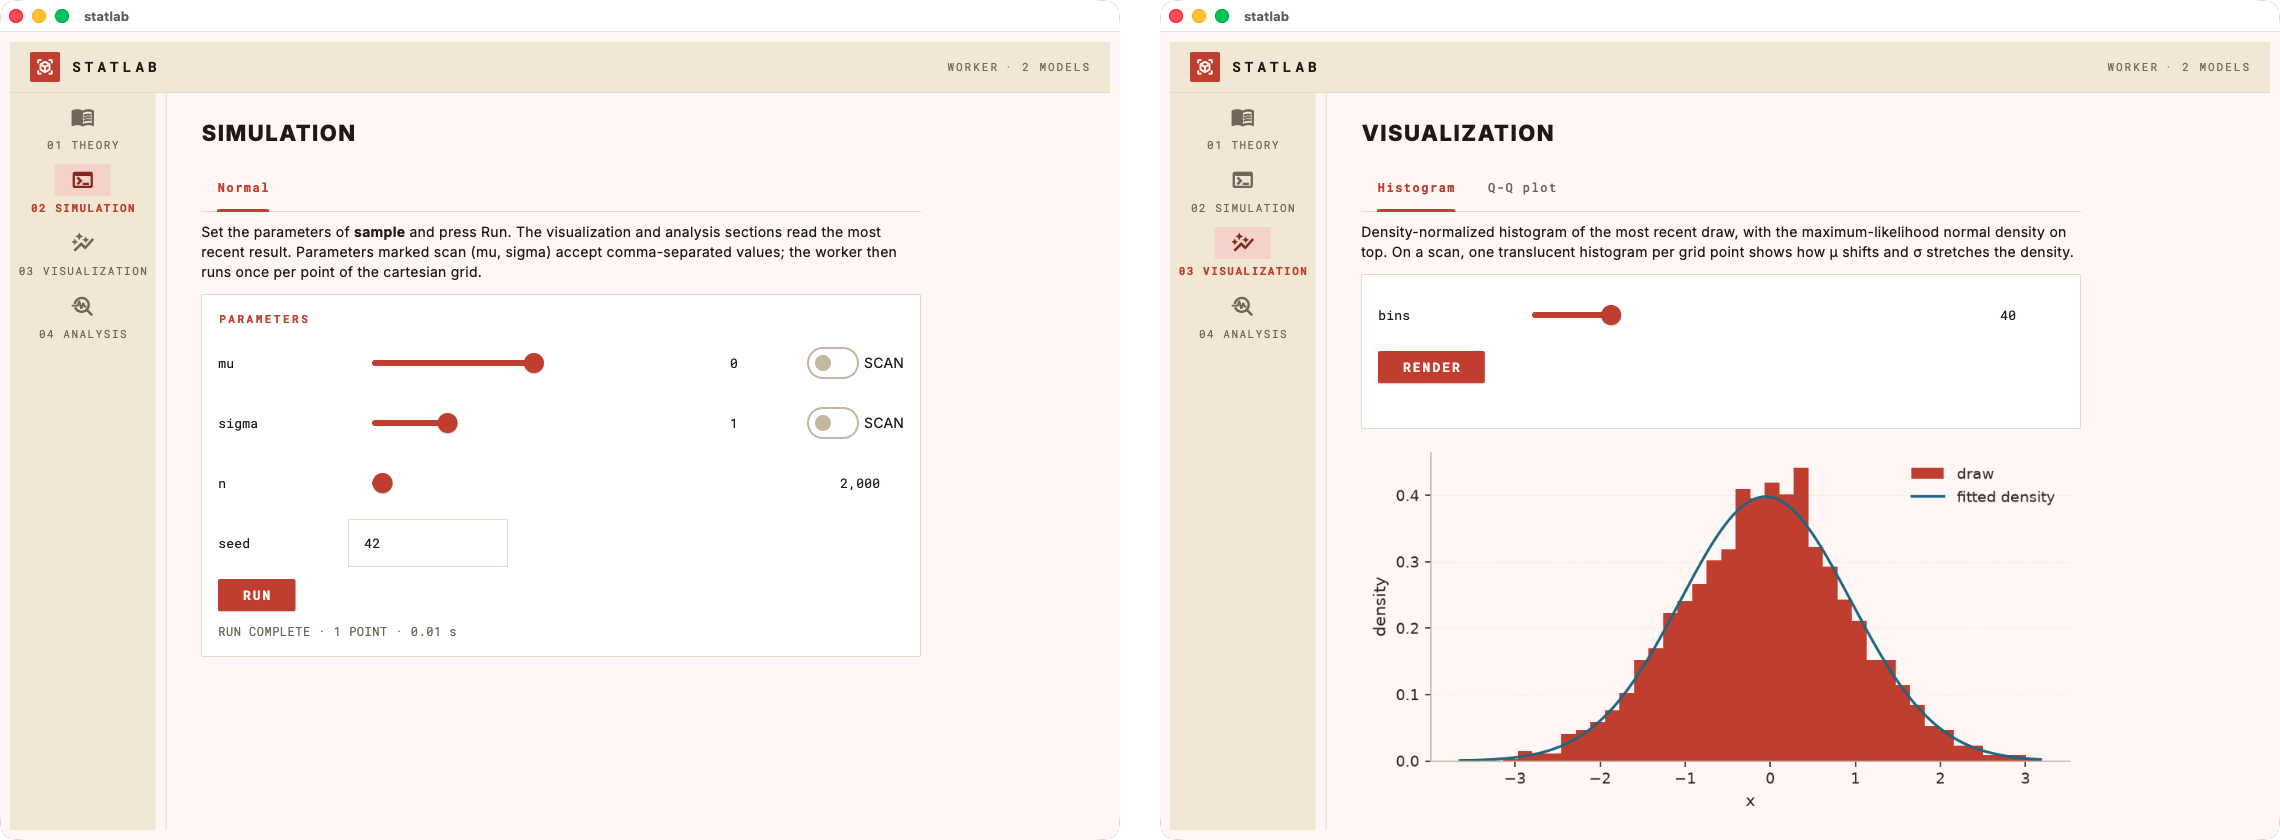
- labforge-0.1.0/tests/test_param.py +78 -0
- labforge-0.1.0/tests/test_render.py +77 -0
- labforge-0.1.0/tests/test_scan.py +39 -0
- labforge-0.1.0/tests/test_smoke.py +185 -0
- labforge-0.1.0/tests/test_theme.py +68 -0
|
@@ -0,0 +1,32 @@
|
|
|
1
|
+
# Changelog
|
|
2
|
+
|
|
3
|
+
Notable changes to labforge. Versions follow [semantic versioning](https://semver.org).
|
|
4
|
+
|
|
5
|
+
## 0.1.0 — unreleased
|
|
6
|
+
|
|
7
|
+
Initial release.
|
|
8
|
+
|
|
9
|
+
- **`Lab`** — register plain Python functions (one worker, any number of
|
|
10
|
+
visualization and analysis functions) and a markdown theory source, then
|
|
11
|
+
`open()` the assembled app: as a native desktop window or served to the
|
|
12
|
+
browser, laid out as four rail-navigated pages or one continuous scrolling
|
|
13
|
+
page. All registration is validated on the spot, so a malformed app fails at
|
|
14
|
+
assembly rather than mid-navigation.
|
|
15
|
+
- **`Param` specs** — each worker/viz/analysis kwarg gets a UI control from its
|
|
16
|
+
`Param` (or a shorthand string such as `"int"` or `"scalar or array"`);
|
|
17
|
+
bounded params render as sliders with live readouts, unbounded ones as
|
|
18
|
+
validated text fields, tuples as per-element fields. Defaults are inferred
|
|
19
|
+
from the function signature.
|
|
20
|
+
- **Parameter scans** — a kwarg declared `scan=True` accepts comma-separated
|
|
21
|
+
values; the worker runs once per point of the cartesian grid and downstream
|
|
22
|
+
functions receive a `ScanResult` of `(params, result)` records.
|
|
23
|
+
- **Analysis dispatch** — an analysis may return a dict (two-column table), a
|
|
24
|
+
list of dicts or a DataFrame (table), a string (markdown), or a matplotlib
|
|
25
|
+
figure; the return shape picks the rendering.
|
|
26
|
+
- **Themes** — eight palettes selected by `open(theme=...)`, four dark and
|
|
27
|
+
four light; chrome, plot palette and equation ink move together, and
|
|
28
|
+
`labforge.palette()` / `labforge.style(fig, ax)` let an author's figures
|
|
29
|
+
follow the active theme.
|
|
30
|
+
- **LaTeX theory** — `$$...$$` blocks in the theory markdown render as crisp
|
|
31
|
+
equation images via system LaTeX, falling back to matplotlib mathtext.
|
|
32
|
+
- **MIT licensed.**
|
labforge-0.1.0/LICENSE
ADDED
|
@@ -0,0 +1,21 @@
|
|
|
1
|
+
MIT License
|
|
2
|
+
|
|
3
|
+
Copyright (c) 2026 Daniel La Rocco
|
|
4
|
+
|
|
5
|
+
Permission is hereby granted, free of charge, to any person obtaining a copy
|
|
6
|
+
of this software and associated documentation files (the "Software"), to deal
|
|
7
|
+
in the Software without restriction, including without limitation the rights
|
|
8
|
+
to use, copy, modify, merge, publish, distribute, sublicense, and/or sell
|
|
9
|
+
copies of the Software, and to permit persons to whom the Software is
|
|
10
|
+
furnished to do so, subject to the following conditions:
|
|
11
|
+
|
|
12
|
+
The above copyright notice and this permission notice shall be included in all
|
|
13
|
+
copies or substantial portions of the Software.
|
|
14
|
+
|
|
15
|
+
THE SOFTWARE IS PROVIDED "AS IS", WITHOUT WARRANTY OF ANY KIND, EXPRESS OR
|
|
16
|
+
IMPLIED, INCLUDING BUT NOT LIMITED TO THE WARRANTIES OF MERCHANTABILITY,
|
|
17
|
+
FITNESS FOR A PARTICULAR PURPOSE AND NONINFRINGEMENT. IN NO EVENT SHALL THE
|
|
18
|
+
AUTHORS OR COPYRIGHT HOLDERS BE LIABLE FOR ANY CLAIM, DAMAGES OR OTHER
|
|
19
|
+
LIABILITY, WHETHER IN AN ACTION OF CONTRACT, TORT OR OTHERWISE, ARISING FROM,
|
|
20
|
+
OUT OF OR IN CONNECTION WITH THE SOFTWARE OR THE USE OR OTHER DEALINGS IN THE
|
|
21
|
+
SOFTWARE.
|
labforge-0.1.0/PKG-INFO
ADDED
|
@@ -0,0 +1,232 @@
|
|
|
1
|
+
Metadata-Version: 2.4
|
|
2
|
+
Name: labforge
|
|
3
|
+
Version: 0.1.0
|
|
4
|
+
Summary: Wrap plain Python functions into a small scientific Flet desktop app: theory, simulation, visualization, analysis.
|
|
5
|
+
Project-URL: Homepage, https://github.com/laroccod/labforge
|
|
6
|
+
Project-URL: Repository, https://github.com/laroccod/labforge
|
|
7
|
+
Project-URL: Issues, https://github.com/laroccod/labforge/issues
|
|
8
|
+
Project-URL: Changelog, https://github.com/laroccod/labforge/blob/main/CHANGELOG.md
|
|
9
|
+
Author: Daniel La Rocco
|
|
10
|
+
License-Expression: MIT
|
|
11
|
+
License-File: LICENSE
|
|
12
|
+
Keywords: desktop-app,flet,gui,matplotlib,scientific-computing,simulation,visualization
|
|
13
|
+
Classifier: Development Status :: 3 - Alpha
|
|
14
|
+
Classifier: Intended Audience :: Developers
|
|
15
|
+
Classifier: Intended Audience :: Science/Research
|
|
16
|
+
Classifier: Operating System :: MacOS
|
|
17
|
+
Classifier: Operating System :: Microsoft :: Windows
|
|
18
|
+
Classifier: Programming Language :: Python :: 3
|
|
19
|
+
Classifier: Programming Language :: Python :: 3.10
|
|
20
|
+
Classifier: Programming Language :: Python :: 3.11
|
|
21
|
+
Classifier: Programming Language :: Python :: 3.12
|
|
22
|
+
Classifier: Programming Language :: Python :: 3.13
|
|
23
|
+
Classifier: Topic :: Scientific/Engineering
|
|
24
|
+
Classifier: Topic :: Scientific/Engineering :: Visualization
|
|
25
|
+
Requires-Python: >=3.10
|
|
26
|
+
Requires-Dist: flet==0.86.0
|
|
27
|
+
Requires-Dist: matplotlib>=3.8
|
|
28
|
+
Requires-Dist: numpy>=2.0
|
|
29
|
+
Provides-Extra: dev
|
|
30
|
+
Requires-Dist: black>=24.0; extra == 'dev'
|
|
31
|
+
Requires-Dist: pytest>=8.0; extra == 'dev'
|
|
32
|
+
Description-Content-Type: text/markdown
|
|
33
|
+
|
|
34
|
+
# `labforge`
|
|
35
|
+
|
|
36
|
+
*By Daniel La Rocco*
|
|
37
|
+
|
|
38
|
+
## **Turn plain Python scripts into a small scientific desktop app.**
|
|
39
|
+
|
|
40
|
+
labforge wraps a simulation you already have — a function that produces data,
|
|
41
|
+
a function that plots it, a function that summarizes it — into a polished
|
|
42
|
+
four-section app following the **theory → simulation → visualization →
|
|
43
|
+
analysis** workflow. Pure Python, rendered with [Flet](https://flet.dev); no
|
|
44
|
+
HTML, no JavaScript, no callbacks to wire up.
|
|
45
|
+
|
|
46
|
+
You provide the science and labforge supplies the app shell, the parameter controls
|
|
47
|
+
generated from your function signatures, the parameter-scan engine,
|
|
48
|
+
LaTeX rendering for your theory notes, and eight instrument-panel themes, four
|
|
49
|
+
dark and four light.
|
|
50
|
+
|
|
51
|
+
|
|
52
|
+
|
|
53
|
+
## Quick start
|
|
54
|
+
|
|
55
|
+
```python
|
|
56
|
+
import matplotlib.pyplot as plt
|
|
57
|
+
import numpy as np
|
|
58
|
+
|
|
59
|
+
import labforge
|
|
60
|
+
from labforge import Lab, Param, ScanResult
|
|
61
|
+
|
|
62
|
+
lab = Lab("gausslab")
|
|
63
|
+
lab.set_theory("theory.md") # markdown file or string; $$...$$ becomes LaTeX
|
|
64
|
+
|
|
65
|
+
|
|
66
|
+
def sample(mu=0.0, sigma=1.0, n=2000, seed=42):
|
|
67
|
+
"""Draw n Gaussian variates; reproducible for a given seed."""
|
|
68
|
+
return np.random.default_rng(seed).normal(mu, sigma, n)
|
|
69
|
+
|
|
70
|
+
|
|
71
|
+
lab.add_worker(sample, {
|
|
72
|
+
"mu": Param(default=0.0, bounds=(-5, 5), scan=True),
|
|
73
|
+
"sigma": Param(default=1.0, bounds=(0.1, 4), scan=True),
|
|
74
|
+
"n": Param(kind="int", default=2000, bounds=(10, 100_000)),
|
|
75
|
+
"seed": "int",
|
|
76
|
+
})
|
|
77
|
+
|
|
78
|
+
|
|
79
|
+
def histogram(data, bins=40):
|
|
80
|
+
fig, ax = plt.subplots(figsize=(7, 3.4))
|
|
81
|
+
if isinstance(data, ScanResult): # a parameter scan: one histogram per grid point
|
|
82
|
+
for params, draws in data:
|
|
83
|
+
ax.hist(draws, bins=bins, density=True, alpha=0.5,
|
|
84
|
+
label=", ".join(f"{k} = {params[k]:g}" for k in data.keys))
|
|
85
|
+
ax.legend()
|
|
86
|
+
else:
|
|
87
|
+
ax.hist(data, bins=bins, density=True, color=labforge.palette().data)
|
|
88
|
+
labforge.style(fig, ax) # optional house treatment
|
|
89
|
+
return fig, ax
|
|
90
|
+
|
|
91
|
+
|
|
92
|
+
lab.add_viz(histogram, "Histogram", "Density histogram of the draw.",
|
|
93
|
+
{"bins": Param(kind="int", default=40, bounds=(5, 200))})
|
|
94
|
+
|
|
95
|
+
|
|
96
|
+
def moments(data):
|
|
97
|
+
if isinstance(data, ScanResult): # one table row per grid point
|
|
98
|
+
return [{**params, "mean": float(np.mean(d)), "std": float(np.std(d))}
|
|
99
|
+
for params, d in data]
|
|
100
|
+
return {"mean": float(np.mean(data)), "std": float(np.std(data, ddof=1))}
|
|
101
|
+
|
|
102
|
+
|
|
103
|
+
lab.add_analysis(moments, "Moments", "Sample moments of the draw.")
|
|
104
|
+
|
|
105
|
+
lab.open()
|
|
106
|
+
```
|
|
107
|
+
|
|
108
|
+
That is the whole app. `lab.open()` opens a native window with four pages —
|
|
109
|
+
Theory, Simulation, Visualization, Analysis — a slider for every bounded
|
|
110
|
+
parameter, a Run button, and tabs for each registered visualization and
|
|
111
|
+
analysis.
|
|
112
|
+
|
|
113
|
+
An extended version of this example — same lab plus a fitted-density overlay
|
|
114
|
+
and a Q-Q plot tab — lives at [`examples/demo_lab.py`](examples/demo_lab.py):
|
|
115
|
+
|
|
116
|
+
```bash
|
|
117
|
+
python examples/demo_lab.py # native window
|
|
118
|
+
python examples/demo_lab.py --browser 8550 # serve at http://localhost:8550
|
|
119
|
+
python examples/demo_lab.py --scroll # one continuous scrolling page
|
|
120
|
+
python examples/demo_lab.py --theme lavender
|
|
121
|
+
```
|
|
122
|
+
|
|
123
|
+
## Concepts
|
|
124
|
+
|
|
125
|
+
**Worker.** One function produces the data. Each keyword argument gets a UI
|
|
126
|
+
control from its `Param` spec — or from the signature default alone, if you
|
|
127
|
+
spec nothing:
|
|
128
|
+
|
|
129
|
+
| spec | control |
|
|
130
|
+
| --- | --- |
|
|
131
|
+
| `Param(default=1.0, bounds=(0, 5))` | slider with live readout |
|
|
132
|
+
| `Param(kind="int", default=100, bounds=(10, 1000))` | integer slider |
|
|
133
|
+
| `Param(default=1.0)` / `"scalar"` / `"int"` | validated text field |
|
|
134
|
+
| `Param(..., scan=True)` / `"scalar or array"` / `"int or array"` | scannable (see below) |
|
|
135
|
+
| `"N-tuple"` (e.g. `"2-tuple"`) | one field per element |
|
|
136
|
+
|
|
137
|
+
Validation happens at registration: unknown spec keys, defaults outside
|
|
138
|
+
bounds, or a scan spec on a non-worker function raise `ValueError` when the
|
|
139
|
+
app is assembled, never mid-use.
|
|
140
|
+
|
|
141
|
+
**Parameter scans.** A kwarg declared `scan=True` gets a scan toggle (bounded)
|
|
142
|
+
or a comma-separated field (unbounded). Enter `0, 1, 2` and labforge calls the
|
|
143
|
+
worker once per point of the cartesian grid across all scanned parameters —
|
|
144
|
+
the worker itself always receives scalars. Downstream functions then receive a
|
|
145
|
+
`ScanResult`: a list of `(params, result)` records with `keys`, `values()` and
|
|
146
|
+
`axis(name)` helpers, distinguished with `isinstance(data, ScanResult)`.
|
|
147
|
+
|
|
148
|
+
**Visualizations.** Functions `viz(data, **kwargs)` returning a matplotlib
|
|
149
|
+
figure (bare or `(fig, ax)`). Each gets a tab with its own controls and a
|
|
150
|
+
Render button. Figures are yours — labforge only serializes them; the house
|
|
151
|
+
style (`labforge.style(fig, ax)`) is strictly opt-in.
|
|
152
|
+
|
|
153
|
+
**Analyses.** Functions `analysis(data, **kwargs)` — the return shape picks
|
|
154
|
+
the rendering:
|
|
155
|
+
|
|
156
|
+
| return | rendered as |
|
|
157
|
+
| --- | --- |
|
|
158
|
+
| `dict` | two-column quantity/value table |
|
|
159
|
+
| `list` of `dict`s, or a DataFrame | full table |
|
|
160
|
+
| `str` | markdown |
|
|
161
|
+
| Figure or `(fig, ax)` | image |
|
|
162
|
+
| anything else | its `repr` |
|
|
163
|
+
|
|
164
|
+
**Theory.** A markdown file or string. Displayed `$$...$$` equations render as
|
|
165
|
+
crisp images — through your system LaTeX toolchain when one is installed
|
|
166
|
+
(with the Euler math font), falling back to matplotlib's mathtext otherwise.
|
|
167
|
+
|
|
168
|
+
## Layouts, views and themes
|
|
169
|
+
|
|
170
|
+
`lab.open()` takes four independent knobs:
|
|
171
|
+
|
|
172
|
+
- `view="app"` (native window, default) or `"browser"` — serve the same app
|
|
173
|
+
and open it in your web browser; with a fixed `port` the URL is stable
|
|
174
|
+
across relaunches, and every browser tab gets its own isolated session.
|
|
175
|
+
- `layout="pages"` (rail navigation, default) or `"scroll"` — the whole lab
|
|
176
|
+
as one continuous scrolling page.
|
|
177
|
+
- `theme` — one of eight palettes, four dark and four light. A theme sets the
|
|
178
|
+
chrome, the plot palette and the equation ink together, so figures never
|
|
179
|
+
drift from the app around them. Colour your own figures with
|
|
180
|
+
`labforge.palette().data`, `.model`, `.highlight`; list the options with
|
|
181
|
+
`labforge.themes()`:
|
|
182
|
+
|
|
183
|
+
| name | mode | look |
|
|
184
|
+
| --- | --- | --- |
|
|
185
|
+
| `paper` | light | warm paper surfaces, graphite ink, vermilion accent (default) |
|
|
186
|
+
| `mint` | light | light mint greens on white |
|
|
187
|
+
| `glacier` | light | pale glacier blues, deep slate accent |
|
|
188
|
+
| `lavender` | light | soft lavender neutrals, deep violet accent |
|
|
189
|
+
| `retro_green` | dark | matrix mood, calmer green, legible olive card |
|
|
190
|
+
| `instrument` | dark | near-black teal-tinted surfaces, one electric accent |
|
|
191
|
+
| `neon_violet` | dark | violet chrome, hot-pink data |
|
|
192
|
+
| `neon_gold` | dark | the violet palette with pale gold as the accent |
|
|
193
|
+
|
|
194
|
+
The Theory page under each theme — the equations are real LaTeX, rendered in
|
|
195
|
+
the theme's ink:
|
|
196
|
+
|
|
197
|
+
| | |
|
|
198
|
+
| --- | --- |
|
|
199
|
+
| `paper` 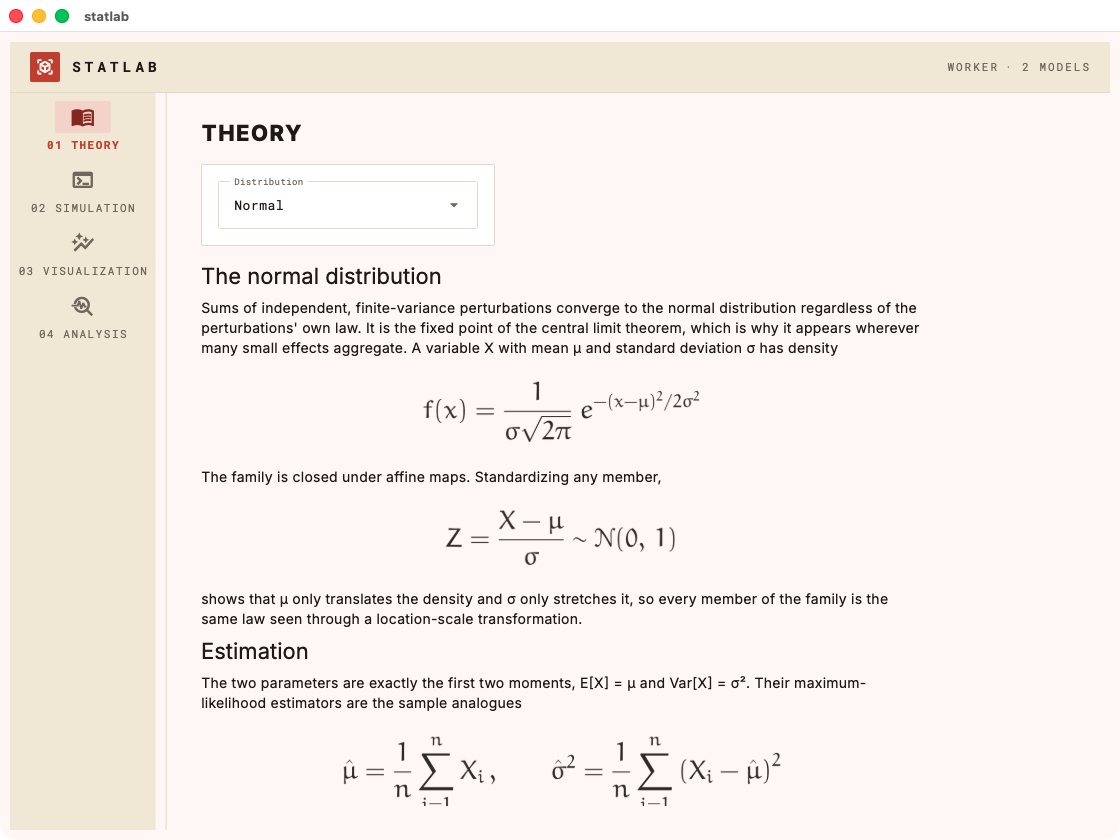 | `mint` 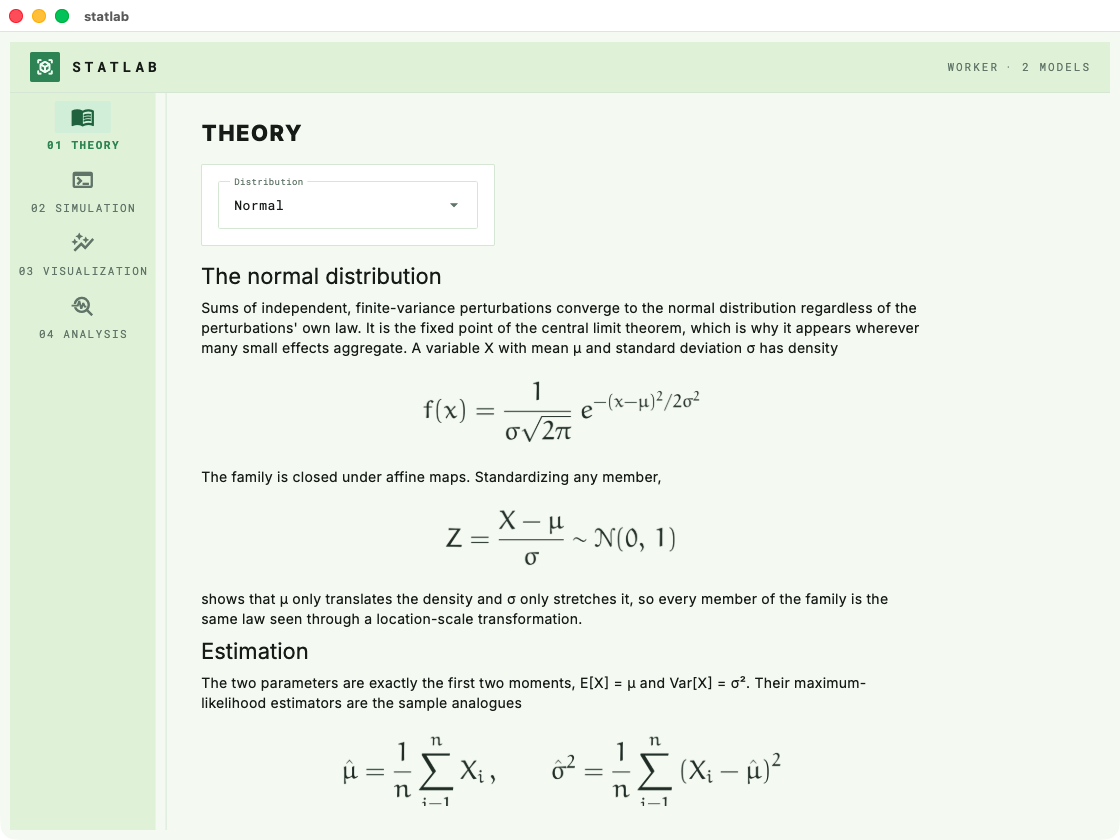 |
|
|
200
|
+
| `glacier` 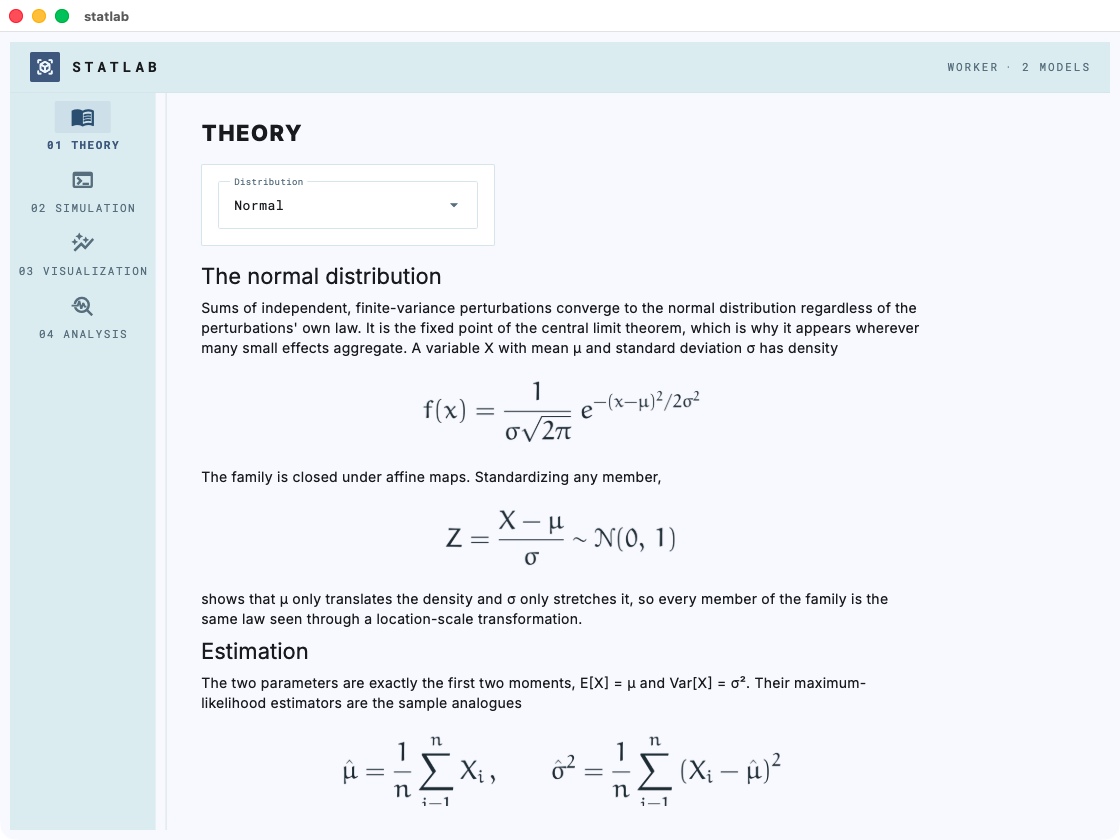 | `lavender` 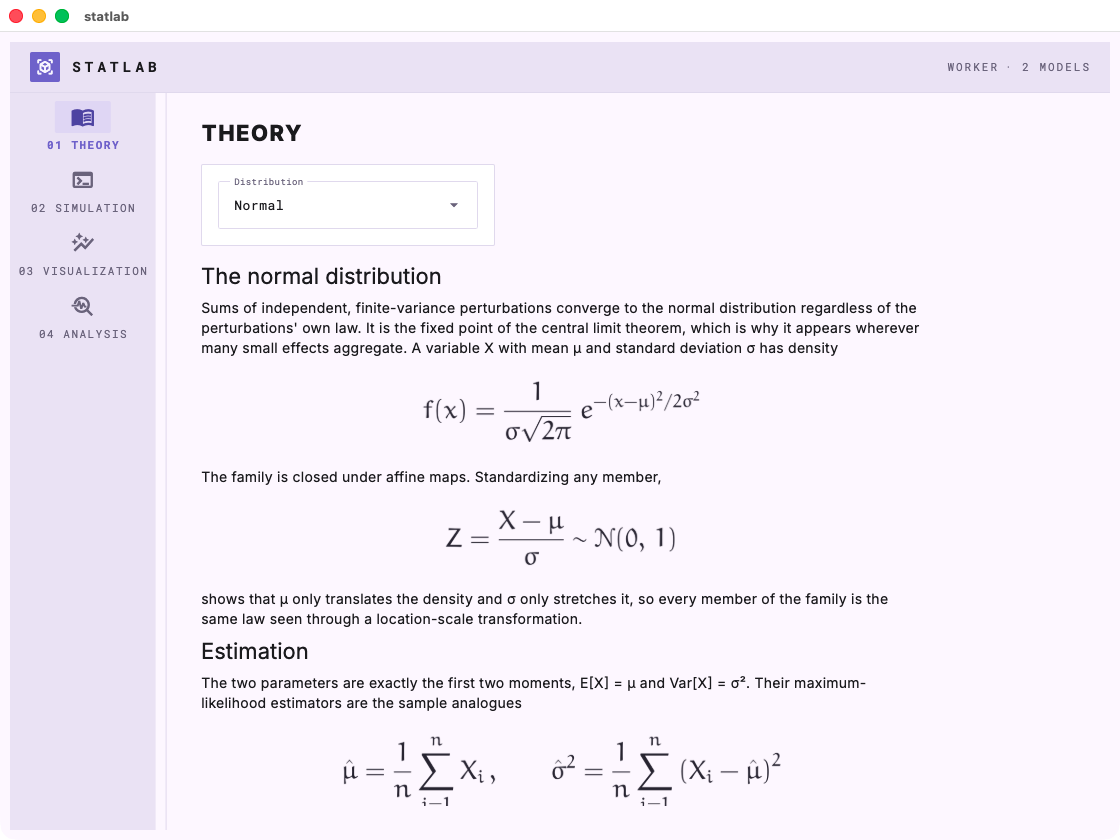 |
|
|
201
|
+
| `retro_green` 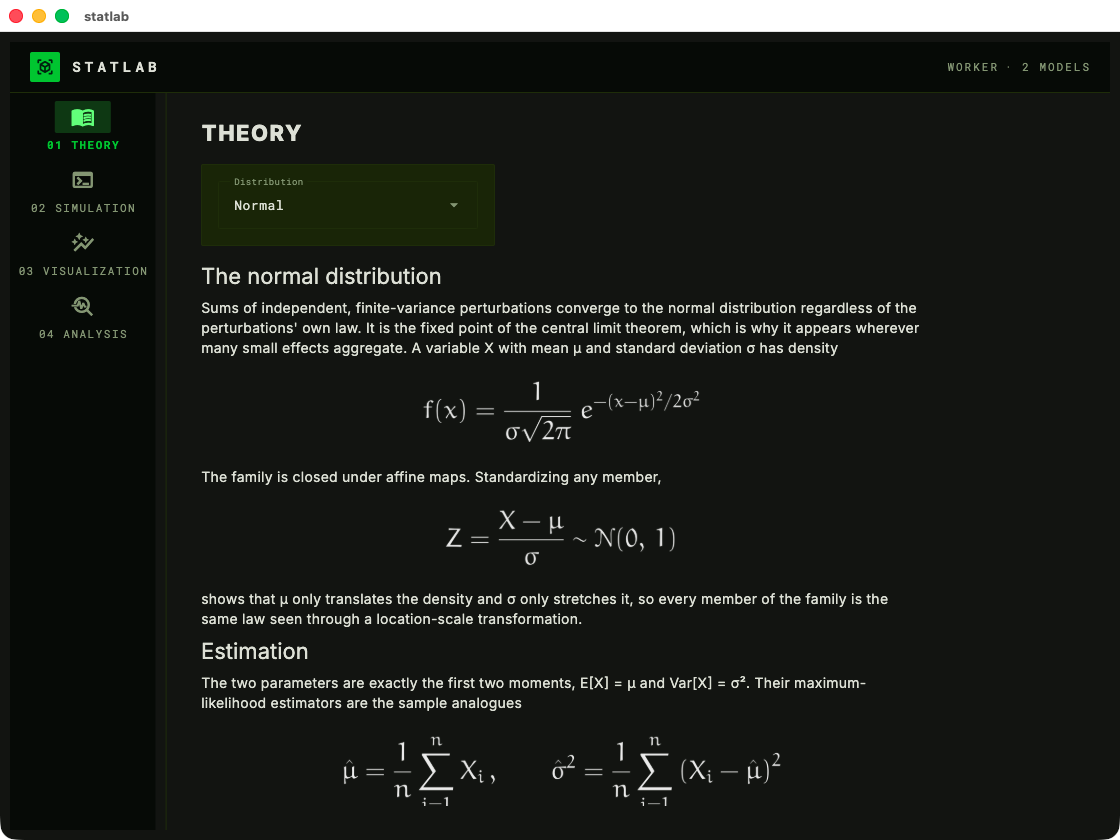 | `instrument` 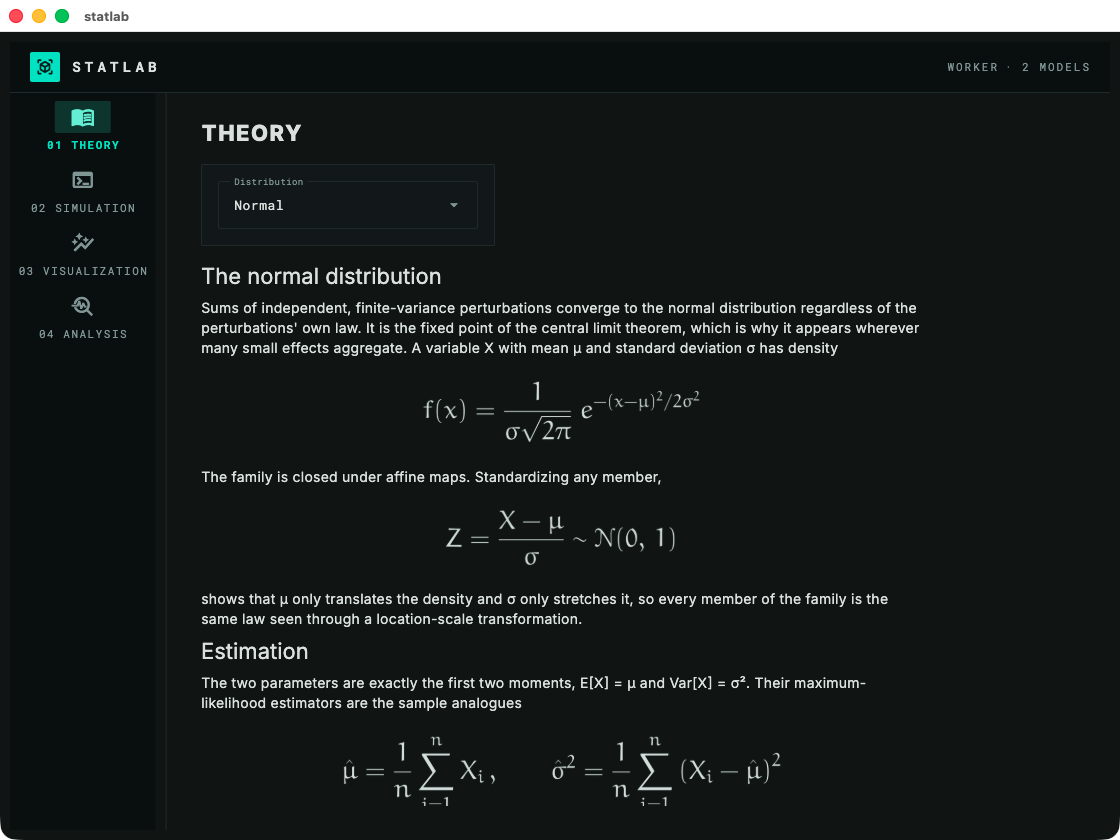 |
|
|
202
|
+
| `neon_violet` 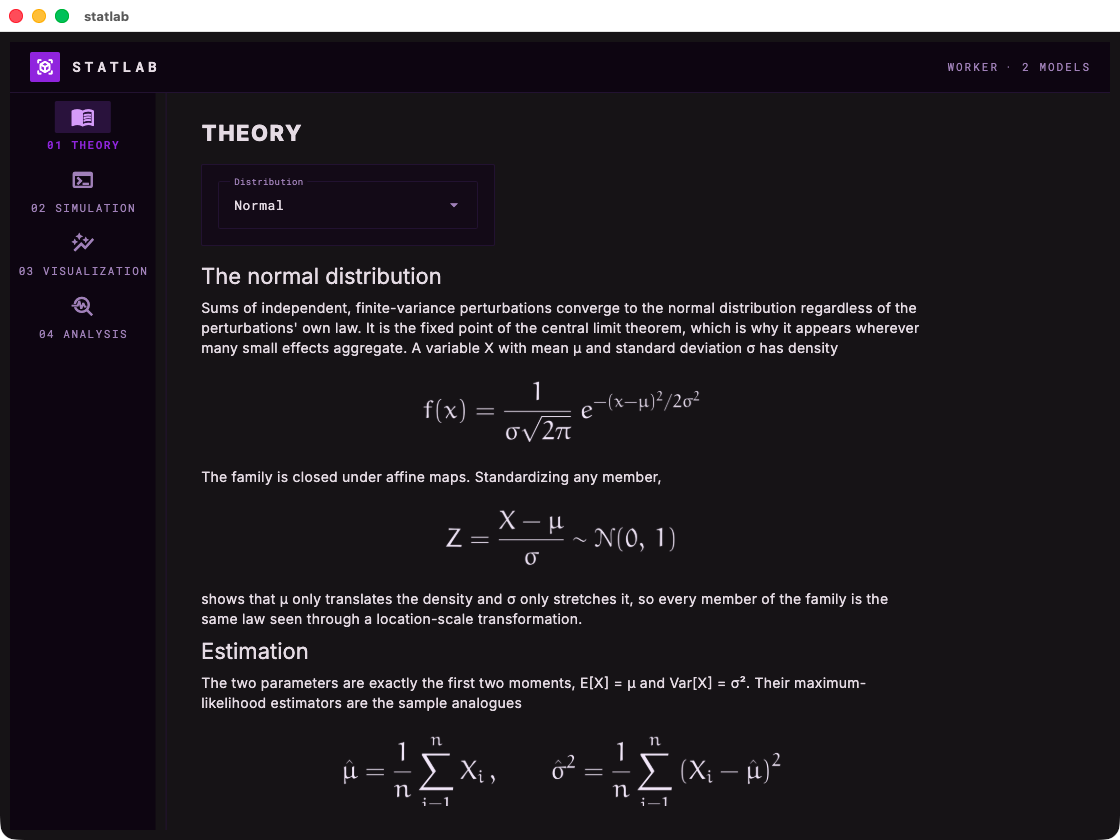 | `neon_gold` 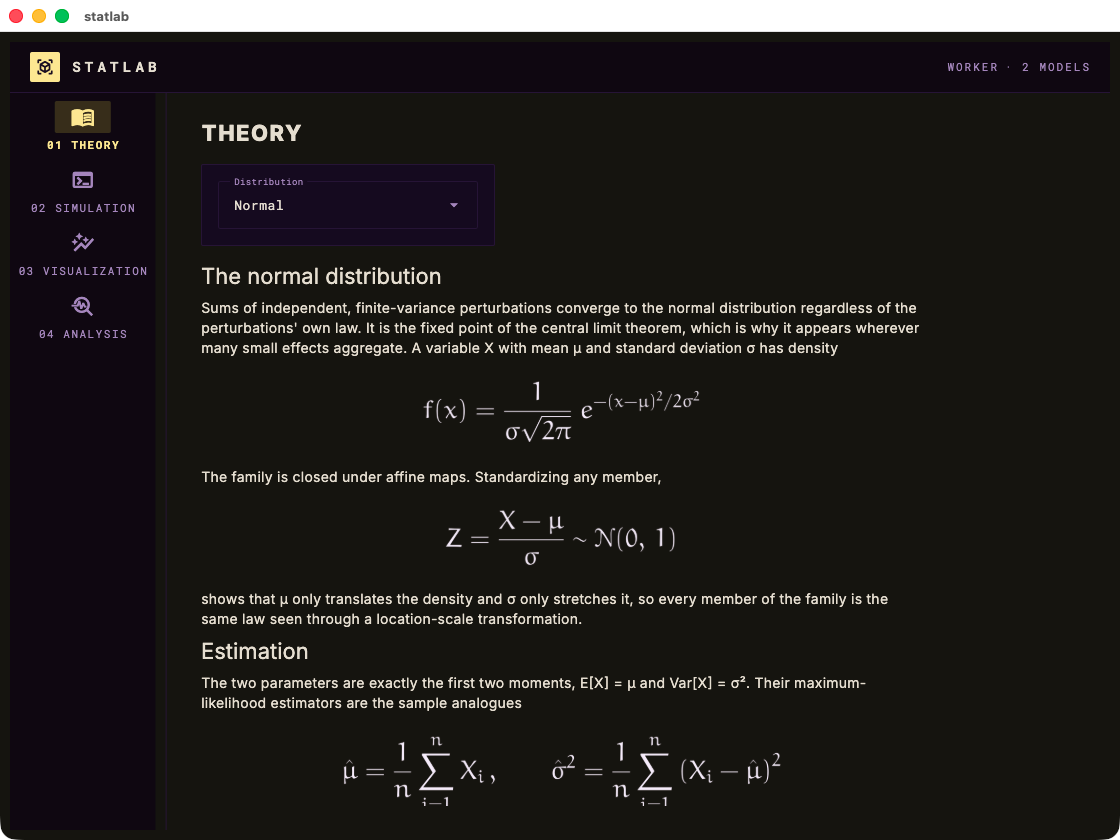 |
|
|
203
|
+
|
|
204
|
+
## Install
|
|
205
|
+
|
|
206
|
+
Requires Python ≥ 3.10. Not yet on PyPI — install from a clone:
|
|
207
|
+
|
|
208
|
+
```bash
|
|
209
|
+
git clone https://github.com/laroccod/labforge.git
|
|
210
|
+
cd labforge
|
|
211
|
+
pip install -e .
|
|
212
|
+
```
|
|
213
|
+
|
|
214
|
+
Dependencies: `flet` (pinned), `numpy`, `matplotlib`. A system LaTeX
|
|
215
|
+
toolchain (`latex` + `dvipng`) is optional and only affects equation
|
|
216
|
+
typography.
|
|
217
|
+
|
|
218
|
+
## Development
|
|
219
|
+
|
|
220
|
+
```bash
|
|
221
|
+
pip install -e ".[dev]"
|
|
222
|
+
pytest # unit + offline page-tree smoke tests
|
|
223
|
+
black --check --line-length 100 src tests examples
|
|
224
|
+
```
|
|
225
|
+
|
|
226
|
+
The test suite builds every page and layout headlessly — no window needed —
|
|
227
|
+
and asserts that equations and figures actually rendered, so most mistakes are
|
|
228
|
+
caught without launching the app.
|
|
229
|
+
|
|
230
|
+
## License
|
|
231
|
+
|
|
232
|
+
[MIT](LICENSE)
|
labforge-0.1.0/README.md
ADDED
|
@@ -0,0 +1,199 @@
|
|
|
1
|
+
# `labforge`
|
|
2
|
+
|
|
3
|
+
*By Daniel La Rocco*
|
|
4
|
+
|
|
5
|
+
## **Turn plain Python scripts into a small scientific desktop app.**
|
|
6
|
+
|
|
7
|
+
labforge wraps a simulation you already have — a function that produces data,
|
|
8
|
+
a function that plots it, a function that summarizes it — into a polished
|
|
9
|
+
four-section app following the **theory → simulation → visualization →
|
|
10
|
+
analysis** workflow. Pure Python, rendered with [Flet](https://flet.dev); no
|
|
11
|
+
HTML, no JavaScript, no callbacks to wire up.
|
|
12
|
+
|
|
13
|
+
You provide the science and labforge supplies the app shell, the parameter controls
|
|
14
|
+
generated from your function signatures, the parameter-scan engine,
|
|
15
|
+
LaTeX rendering for your theory notes, and eight instrument-panel themes, four
|
|
16
|
+
dark and four light.
|
|
17
|
+
|
|
18
|
+

|
|
19
|
+
|
|
20
|
+
## Quick start
|
|
21
|
+
|
|
22
|
+
```python
|
|
23
|
+
import matplotlib.pyplot as plt
|
|
24
|
+
import numpy as np
|
|
25
|
+
|
|
26
|
+
import labforge
|
|
27
|
+
from labforge import Lab, Param, ScanResult
|
|
28
|
+
|
|
29
|
+
lab = Lab("gausslab")
|
|
30
|
+
lab.set_theory("theory.md") # markdown file or string; $$...$$ becomes LaTeX
|
|
31
|
+
|
|
32
|
+
|
|
33
|
+
def sample(mu=0.0, sigma=1.0, n=2000, seed=42):
|
|
34
|
+
"""Draw n Gaussian variates; reproducible for a given seed."""
|
|
35
|
+
return np.random.default_rng(seed).normal(mu, sigma, n)
|
|
36
|
+
|
|
37
|
+
|
|
38
|
+
lab.add_worker(sample, {
|
|
39
|
+
"mu": Param(default=0.0, bounds=(-5, 5), scan=True),
|
|
40
|
+
"sigma": Param(default=1.0, bounds=(0.1, 4), scan=True),
|
|
41
|
+
"n": Param(kind="int", default=2000, bounds=(10, 100_000)),
|
|
42
|
+
"seed": "int",
|
|
43
|
+
})
|
|
44
|
+
|
|
45
|
+
|
|
46
|
+
def histogram(data, bins=40):
|
|
47
|
+
fig, ax = plt.subplots(figsize=(7, 3.4))
|
|
48
|
+
if isinstance(data, ScanResult): # a parameter scan: one histogram per grid point
|
|
49
|
+
for params, draws in data:
|
|
50
|
+
ax.hist(draws, bins=bins, density=True, alpha=0.5,
|
|
51
|
+
label=", ".join(f"{k} = {params[k]:g}" for k in data.keys))
|
|
52
|
+
ax.legend()
|
|
53
|
+
else:
|
|
54
|
+
ax.hist(data, bins=bins, density=True, color=labforge.palette().data)
|
|
55
|
+
labforge.style(fig, ax) # optional house treatment
|
|
56
|
+
return fig, ax
|
|
57
|
+
|
|
58
|
+
|
|
59
|
+
lab.add_viz(histogram, "Histogram", "Density histogram of the draw.",
|
|
60
|
+
{"bins": Param(kind="int", default=40, bounds=(5, 200))})
|
|
61
|
+
|
|
62
|
+
|
|
63
|
+
def moments(data):
|
|
64
|
+
if isinstance(data, ScanResult): # one table row per grid point
|
|
65
|
+
return [{**params, "mean": float(np.mean(d)), "std": float(np.std(d))}
|
|
66
|
+
for params, d in data]
|
|
67
|
+
return {"mean": float(np.mean(data)), "std": float(np.std(data, ddof=1))}
|
|
68
|
+
|
|
69
|
+
|
|
70
|
+
lab.add_analysis(moments, "Moments", "Sample moments of the draw.")
|
|
71
|
+
|
|
72
|
+
lab.open()
|
|
73
|
+
```
|
|
74
|
+
|
|
75
|
+
That is the whole app. `lab.open()` opens a native window with four pages —
|
|
76
|
+
Theory, Simulation, Visualization, Analysis — a slider for every bounded
|
|
77
|
+
parameter, a Run button, and tabs for each registered visualization and
|
|
78
|
+
analysis.
|
|
79
|
+
|
|
80
|
+
An extended version of this example — same lab plus a fitted-density overlay
|
|
81
|
+
and a Q-Q plot tab — lives at [`examples/demo_lab.py`](examples/demo_lab.py):
|
|
82
|
+
|
|
83
|
+
```bash
|
|
84
|
+
python examples/demo_lab.py # native window
|
|
85
|
+
python examples/demo_lab.py --browser 8550 # serve at http://localhost:8550
|
|
86
|
+
python examples/demo_lab.py --scroll # one continuous scrolling page
|
|
87
|
+
python examples/demo_lab.py --theme lavender
|
|
88
|
+
```
|
|
89
|
+
|
|
90
|
+
## Concepts
|
|
91
|
+
|
|
92
|
+
**Worker.** One function produces the data. Each keyword argument gets a UI
|
|
93
|
+
control from its `Param` spec — or from the signature default alone, if you
|
|
94
|
+
spec nothing:
|
|
95
|
+
|
|
96
|
+
| spec | control |
|
|
97
|
+
| --- | --- |
|
|
98
|
+
| `Param(default=1.0, bounds=(0, 5))` | slider with live readout |
|
|
99
|
+
| `Param(kind="int", default=100, bounds=(10, 1000))` | integer slider |
|
|
100
|
+
| `Param(default=1.0)` / `"scalar"` / `"int"` | validated text field |
|
|
101
|
+
| `Param(..., scan=True)` / `"scalar or array"` / `"int or array"` | scannable (see below) |
|
|
102
|
+
| `"N-tuple"` (e.g. `"2-tuple"`) | one field per element |
|
|
103
|
+
|
|
104
|
+
Validation happens at registration: unknown spec keys, defaults outside
|
|
105
|
+
bounds, or a scan spec on a non-worker function raise `ValueError` when the
|
|
106
|
+
app is assembled, never mid-use.
|
|
107
|
+
|
|
108
|
+
**Parameter scans.** A kwarg declared `scan=True` gets a scan toggle (bounded)
|
|
109
|
+
or a comma-separated field (unbounded). Enter `0, 1, 2` and labforge calls the
|
|
110
|
+
worker once per point of the cartesian grid across all scanned parameters —
|
|
111
|
+
the worker itself always receives scalars. Downstream functions then receive a
|
|
112
|
+
`ScanResult`: a list of `(params, result)` records with `keys`, `values()` and
|
|
113
|
+
`axis(name)` helpers, distinguished with `isinstance(data, ScanResult)`.
|
|
114
|
+
|
|
115
|
+
**Visualizations.** Functions `viz(data, **kwargs)` returning a matplotlib
|
|
116
|
+
figure (bare or `(fig, ax)`). Each gets a tab with its own controls and a
|
|
117
|
+
Render button. Figures are yours — labforge only serializes them; the house
|
|
118
|
+
style (`labforge.style(fig, ax)`) is strictly opt-in.
|
|
119
|
+
|
|
120
|
+
**Analyses.** Functions `analysis(data, **kwargs)` — the return shape picks
|
|
121
|
+
the rendering:
|
|
122
|
+
|
|
123
|
+
| return | rendered as |
|
|
124
|
+
| --- | --- |
|
|
125
|
+
| `dict` | two-column quantity/value table |
|
|
126
|
+
| `list` of `dict`s, or a DataFrame | full table |
|
|
127
|
+
| `str` | markdown |
|
|
128
|
+
| Figure or `(fig, ax)` | image |
|
|
129
|
+
| anything else | its `repr` |
|
|
130
|
+
|
|
131
|
+
**Theory.** A markdown file or string. Displayed `$$...$$` equations render as
|
|
132
|
+
crisp images — through your system LaTeX toolchain when one is installed
|
|
133
|
+
(with the Euler math font), falling back to matplotlib's mathtext otherwise.
|
|
134
|
+
|
|
135
|
+
## Layouts, views and themes
|
|
136
|
+
|
|
137
|
+
`lab.open()` takes four independent knobs:
|
|
138
|
+
|
|
139
|
+
- `view="app"` (native window, default) or `"browser"` — serve the same app
|
|
140
|
+
and open it in your web browser; with a fixed `port` the URL is stable
|
|
141
|
+
across relaunches, and every browser tab gets its own isolated session.
|
|
142
|
+
- `layout="pages"` (rail navigation, default) or `"scroll"` — the whole lab
|
|
143
|
+
as one continuous scrolling page.
|
|
144
|
+
- `theme` — one of eight palettes, four dark and four light. A theme sets the
|
|
145
|
+
chrome, the plot palette and the equation ink together, so figures never
|
|
146
|
+
drift from the app around them. Colour your own figures with
|
|
147
|
+
`labforge.palette().data`, `.model`, `.highlight`; list the options with
|
|
148
|
+
`labforge.themes()`:
|
|
149
|
+
|
|
150
|
+
| name | mode | look |
|
|
151
|
+
| --- | --- | --- |
|
|
152
|
+
| `paper` | light | warm paper surfaces, graphite ink, vermilion accent (default) |
|
|
153
|
+
| `mint` | light | light mint greens on white |
|
|
154
|
+
| `glacier` | light | pale glacier blues, deep slate accent |
|
|
155
|
+
| `lavender` | light | soft lavender neutrals, deep violet accent |
|
|
156
|
+
| `retro_green` | dark | matrix mood, calmer green, legible olive card |
|
|
157
|
+
| `instrument` | dark | near-black teal-tinted surfaces, one electric accent |
|
|
158
|
+
| `neon_violet` | dark | violet chrome, hot-pink data |
|
|
159
|
+
| `neon_gold` | dark | the violet palette with pale gold as the accent |
|
|
160
|
+
|
|
161
|
+
The Theory page under each theme — the equations are real LaTeX, rendered in
|
|
162
|
+
the theme's ink:
|
|
163
|
+
|
|
164
|
+
| | |
|
|
165
|
+
| --- | --- |
|
|
166
|
+
| `paper`  | `mint`  |
|
|
167
|
+
| `glacier`  | `lavender`  |
|
|
168
|
+
| `retro_green`  | `instrument`  |
|
|
169
|
+
| `neon_violet`  | `neon_gold`  |
|
|
170
|
+
|
|
171
|
+
## Install
|
|
172
|
+
|
|
173
|
+
Requires Python ≥ 3.10. Not yet on PyPI — install from a clone:
|
|
174
|
+
|
|
175
|
+
```bash
|
|
176
|
+
git clone https://github.com/laroccod/labforge.git
|
|
177
|
+
cd labforge
|
|
178
|
+
pip install -e .
|
|
179
|
+
```
|
|
180
|
+
|
|
181
|
+
Dependencies: `flet` (pinned), `numpy`, `matplotlib`. A system LaTeX
|
|
182
|
+
toolchain (`latex` + `dvipng`) is optional and only affects equation
|
|
183
|
+
typography.
|
|
184
|
+
|
|
185
|
+
## Development
|
|
186
|
+
|
|
187
|
+
```bash
|
|
188
|
+
pip install -e ".[dev]"
|
|
189
|
+
pytest # unit + offline page-tree smoke tests
|
|
190
|
+
black --check --line-length 100 src tests examples
|
|
191
|
+
```
|
|
192
|
+
|
|
193
|
+
The test suite builds every page and layout headlessly — no window needed —
|
|
194
|
+
and asserts that equations and figures actually rendered, so most mistakes are
|
|
195
|
+
caught without launching the app.
|
|
196
|
+
|
|
197
|
+
## License
|
|
198
|
+
|
|
199
|
+
[MIT](LICENSE)
|
|
Binary file
|
|
Binary file
|
|
Binary file
|
|
Binary file
|
|
Binary file
|
|
Binary file
|
|
Binary file
|
|
Binary file
|
|
Binary file
|
|
@@ -0,0 +1,156 @@
|
|
|
1
|
+
"""
|
|
2
|
+
Demo lab
|
|
3
|
+
|
|
4
|
+
The labforge README example in runnable form: a Gaussian sampler worker, a
|
|
5
|
+
histogram (with fitted density) and Q-Q plot visualization, and a moments
|
|
6
|
+
analysis, each handling both a single run and a parameter scan. Launch with
|
|
7
|
+
`python examples/demo_lab.py`; add `--browser [port]` to serve it to the
|
|
8
|
+
default web browser instead, `--scroll` for one continuous scrolling page
|
|
9
|
+
instead of four, and/or `--theme <name>` to try a colour scheme (see
|
|
10
|
+
labforge.themes()).
|
|
11
|
+
"""
|
|
12
|
+
|
|
13
|
+
import argparse
|
|
14
|
+
from pathlib import Path
|
|
15
|
+
from statistics import NormalDist
|
|
16
|
+
|
|
17
|
+
import matplotlib.pyplot as plt
|
|
18
|
+
import numpy as np
|
|
19
|
+
|
|
20
|
+
import labforge
|
|
21
|
+
from labforge import Lab, Param, ScanResult
|
|
22
|
+
|
|
23
|
+
lab = Lab("gausslab")
|
|
24
|
+
lab.set_theory(Path(__file__).with_name("theory.md"))
|
|
25
|
+
|
|
26
|
+
|
|
27
|
+
def sample(mu=0.0, sigma=1.0, n=2000, seed=42):
|
|
28
|
+
"""Draw n Gaussian variates; reproducible for a given seed."""
|
|
29
|
+
return np.random.default_rng(seed).normal(mu, sigma, n)
|
|
30
|
+
|
|
31
|
+
|
|
32
|
+
lab.add_worker(
|
|
33
|
+
sample,
|
|
34
|
+
{
|
|
35
|
+
"mu": Param(default=0.0, bounds=(-5, 5), scan=True),
|
|
36
|
+
"sigma": Param(default=1.0, bounds=(0.1, 4), scan=True),
|
|
37
|
+
"n": Param(kind="int", default=2000, bounds=(10, 100_000)),
|
|
38
|
+
"seed": "int",
|
|
39
|
+
},
|
|
40
|
+
)
|
|
41
|
+
|
|
42
|
+
|
|
43
|
+
def histogram(data, bins=40):
|
|
44
|
+
"""Density histogram of the draw; a scan overlays one histogram per point."""
|
|
45
|
+
fig, ax = plt.subplots(figsize=(7, 3.4))
|
|
46
|
+
if isinstance(data, ScanResult):
|
|
47
|
+
for params, draws in data:
|
|
48
|
+
label = ", ".join(f"{key} = {params[key]:g}" for key in data.keys)
|
|
49
|
+
ax.hist(draws, bins=bins, density=True, alpha=0.5, label=label)
|
|
50
|
+
else:
|
|
51
|
+
colors = labforge.palette()
|
|
52
|
+
ax.hist(data, bins=bins, density=True, color=colors.data, label="draw")
|
|
53
|
+
# The density fitted by maximum likelihood, over the sample's own range.
|
|
54
|
+
mean, std = np.mean(data), np.std(data, ddof=1)
|
|
55
|
+
x = np.linspace(np.min(data), np.max(data), 400)
|
|
56
|
+
pdf = np.exp(-((x - mean) ** 2) / (2 * std**2)) / (std * np.sqrt(2 * np.pi))
|
|
57
|
+
ax.plot(x, pdf, color=colors.model, linewidth=1.6, label="fitted density")
|
|
58
|
+
ax.legend()
|
|
59
|
+
ax.set_xlabel("x")
|
|
60
|
+
ax.set_ylabel("density")
|
|
61
|
+
labforge.style(fig, ax)
|
|
62
|
+
return fig, ax
|
|
63
|
+
|
|
64
|
+
|
|
65
|
+
lab.add_viz(
|
|
66
|
+
histogram,
|
|
67
|
+
"Histogram",
|
|
68
|
+
"Density-normalized histogram of the most recent draw, with the "
|
|
69
|
+
"maximum-likelihood normal density on top. On a scan, one translucent "
|
|
70
|
+
"histogram per grid point shows how μ shifts and σ stretches the density.",
|
|
71
|
+
{"bins": Param(kind="int", default=40, bounds=(5, 200))},
|
|
72
|
+
)
|
|
73
|
+
|
|
74
|
+
|
|
75
|
+
def qq_plot(data):
|
|
76
|
+
"""Standardized order statistics against normal quantiles; scans overlay grid points."""
|
|
77
|
+
fig, ax = plt.subplots(figsize=(7, 3.4))
|
|
78
|
+
colors = labforge.palette()
|
|
79
|
+
|
|
80
|
+
def quantiles(draws):
|
|
81
|
+
draws = np.asarray(draws)
|
|
82
|
+
probs = (np.arange(1, len(draws) + 1) - 0.5) / len(draws)
|
|
83
|
+
theory = np.array([NormalDist().inv_cdf(p) for p in probs])
|
|
84
|
+
sample = np.sort((draws - np.mean(draws)) / np.std(draws, ddof=1))
|
|
85
|
+
return theory, sample
|
|
86
|
+
|
|
87
|
+
if isinstance(data, ScanResult):
|
|
88
|
+
for params, draws in data:
|
|
89
|
+
theory, sample = quantiles(draws)
|
|
90
|
+
label = ", ".join(f"{key} = {params[key]:g}" for key in data.keys)
|
|
91
|
+
ax.plot(theory, sample, linewidth=1.2, alpha=0.7, label=label)
|
|
92
|
+
else:
|
|
93
|
+
theory, sample = quantiles(data)
|
|
94
|
+
ax.plot(theory, sample, linewidth=0, marker=".", markersize=3, color=colors.data)
|
|
95
|
+
lims = ax.get_xlim()
|
|
96
|
+
ax.plot(lims, lims, color=colors.model, linewidth=1.2, linestyle="--", label="diagonal")
|
|
97
|
+
ax.legend()
|
|
98
|
+
ax.set_xlabel("normal quantile")
|
|
99
|
+
ax.set_ylabel("sample quantile")
|
|
100
|
+
labforge.style(fig, ax)
|
|
101
|
+
return fig, ax
|
|
102
|
+
|
|
103
|
+
|
|
104
|
+
lab.add_viz(
|
|
105
|
+
qq_plot,
|
|
106
|
+
"Q-Q plot",
|
|
107
|
+
"Standardized order statistics of the draw against standard-normal "
|
|
108
|
+
"quantiles. A Gaussian sample lies on the dashed diagonal, and "
|
|
109
|
+
"standardizing collapses every grid point of a scan onto the same line.",
|
|
110
|
+
)
|
|
111
|
+
|
|
112
|
+
|
|
113
|
+
def moments(data):
|
|
114
|
+
"""Sample moments and the standard error of the mean; one row per grid point on a scan."""
|
|
115
|
+
|
|
116
|
+
def row(draws):
|
|
117
|
+
mean, std = float(np.mean(draws)), float(np.std(draws, ddof=1))
|
|
118
|
+
return {"mean": mean, "std": std, "se(mean)": std / np.sqrt(len(draws))}
|
|
119
|
+
|
|
120
|
+
if isinstance(data, ScanResult):
|
|
121
|
+
return [{**params, **row(draws)} for params, draws in data]
|
|
122
|
+
return row(data)
|
|
123
|
+
|
|
124
|
+
|
|
125
|
+
lab.add_analysis(
|
|
126
|
+
moments,
|
|
127
|
+
"Moments",
|
|
128
|
+
"The sample mean and standard deviation estimate μ and σ directly, and "
|
|
129
|
+
"for the normal family they are also the maximum-likelihood estimators. "
|
|
130
|
+
"The standard error of the mean shrinks like 1/√n.",
|
|
131
|
+
)
|
|
132
|
+
|
|
133
|
+
|
|
134
|
+
if __name__ == "__main__":
|
|
135
|
+
parser = argparse.ArgumentParser(description="Run the labforge Gaussian demo.")
|
|
136
|
+
parser.add_argument(
|
|
137
|
+
"--browser",
|
|
138
|
+
nargs="?",
|
|
139
|
+
const=0,
|
|
140
|
+
type=int,
|
|
141
|
+
metavar="PORT",
|
|
142
|
+
help="serve to the default web browser (0 picks a free port)",
|
|
143
|
+
)
|
|
144
|
+
parser.add_argument("--scroll", action="store_true", help="one scrolling page, no rail")
|
|
145
|
+
parser.add_argument("--theme", choices=labforge.themes(), help="colour scheme")
|
|
146
|
+
args = parser.parse_args()
|
|
147
|
+
|
|
148
|
+
# Only pass theme when --theme asks for one: open() already defaults to it,
|
|
149
|
+
# so the demo never carries its own copy to drift.
|
|
150
|
+
opts = {"layout": "scroll" if args.scroll else "pages"}
|
|
151
|
+
if args.theme:
|
|
152
|
+
opts["theme"] = args.theme
|
|
153
|
+
if args.browser is not None:
|
|
154
|
+
lab.open("browser", port=args.browser, **opts)
|
|
155
|
+
else:
|
|
156
|
+
lab.open(**opts)
|