ibis-profiling 0.1.0__tar.gz
This diff represents the content of publicly available package versions that have been released to one of the supported registries. The information contained in this diff is provided for informational purposes only and reflects changes between package versions as they appear in their respective public registries.
- ibis_profiling-0.1.0/.gitignore +13 -0
- ibis_profiling-0.1.0/LICENSE +21 -0
- ibis_profiling-0.1.0/PKG-INFO +292 -0
- ibis_profiling-0.1.0/README.md +261 -0
- ibis_profiling-0.1.0/pyproject.toml +80 -0
- ibis_profiling-0.1.0/src/ibis_profiling/__init__.py +333 -0
- ibis_profiling-0.1.0/src/ibis_profiling/assets/img/ibis-profiling-icon.png +0 -0
- ibis_profiling-0.1.0/src/ibis_profiling/assets/img/ibis-profiling-logo.png +0 -0
- ibis_profiling-0.1.0/src/ibis_profiling/assets/img/report_missing.png +0 -0
- ibis_profiling-0.1.0/src/ibis_profiling/assets/img/report_overview.png +0 -0
- ibis_profiling-0.1.0/src/ibis_profiling/assets/img/report_preview.png +0 -0
- ibis_profiling-0.1.0/src/ibis_profiling/assets/img/report_variables.png +0 -0
- ibis_profiling-0.1.0/src/ibis_profiling/engine.py +46 -0
- ibis_profiling-0.1.0/src/ibis_profiling/inspector.py +39 -0
- ibis_profiling-0.1.0/src/ibis_profiling/metrics.py +129 -0
- ibis_profiling-0.1.0/src/ibis_profiling/planner.py +99 -0
- ibis_profiling-0.1.0/src/ibis_profiling/report/__init__.py +1 -0
- ibis_profiling-0.1.0/src/ibis_profiling/report/model/__init__.py +0 -0
- ibis_profiling-0.1.0/src/ibis_profiling/report/model/alerts.py +58 -0
- ibis_profiling-0.1.0/src/ibis_profiling/report/model/correlations.py +80 -0
- ibis_profiling-0.1.0/src/ibis_profiling/report/model/interactions.py +69 -0
- ibis_profiling-0.1.0/src/ibis_profiling/report/model/missing.py +69 -0
- ibis_profiling-0.1.0/src/ibis_profiling/report/model/summary.py +70 -0
- ibis_profiling-0.1.0/src/ibis_profiling/report/report.py +383 -0
- ibis_profiling-0.1.0/src/ibis_profiling/templates/default.html +1382 -0
- ibis_profiling-0.1.0/src/ibis_profiling/templates/ydata-like.html +917 -0
|
@@ -0,0 +1,21 @@
|
|
|
1
|
+
MIT License
|
|
2
|
+
|
|
3
|
+
Copyright (c) 2026 David Beall
|
|
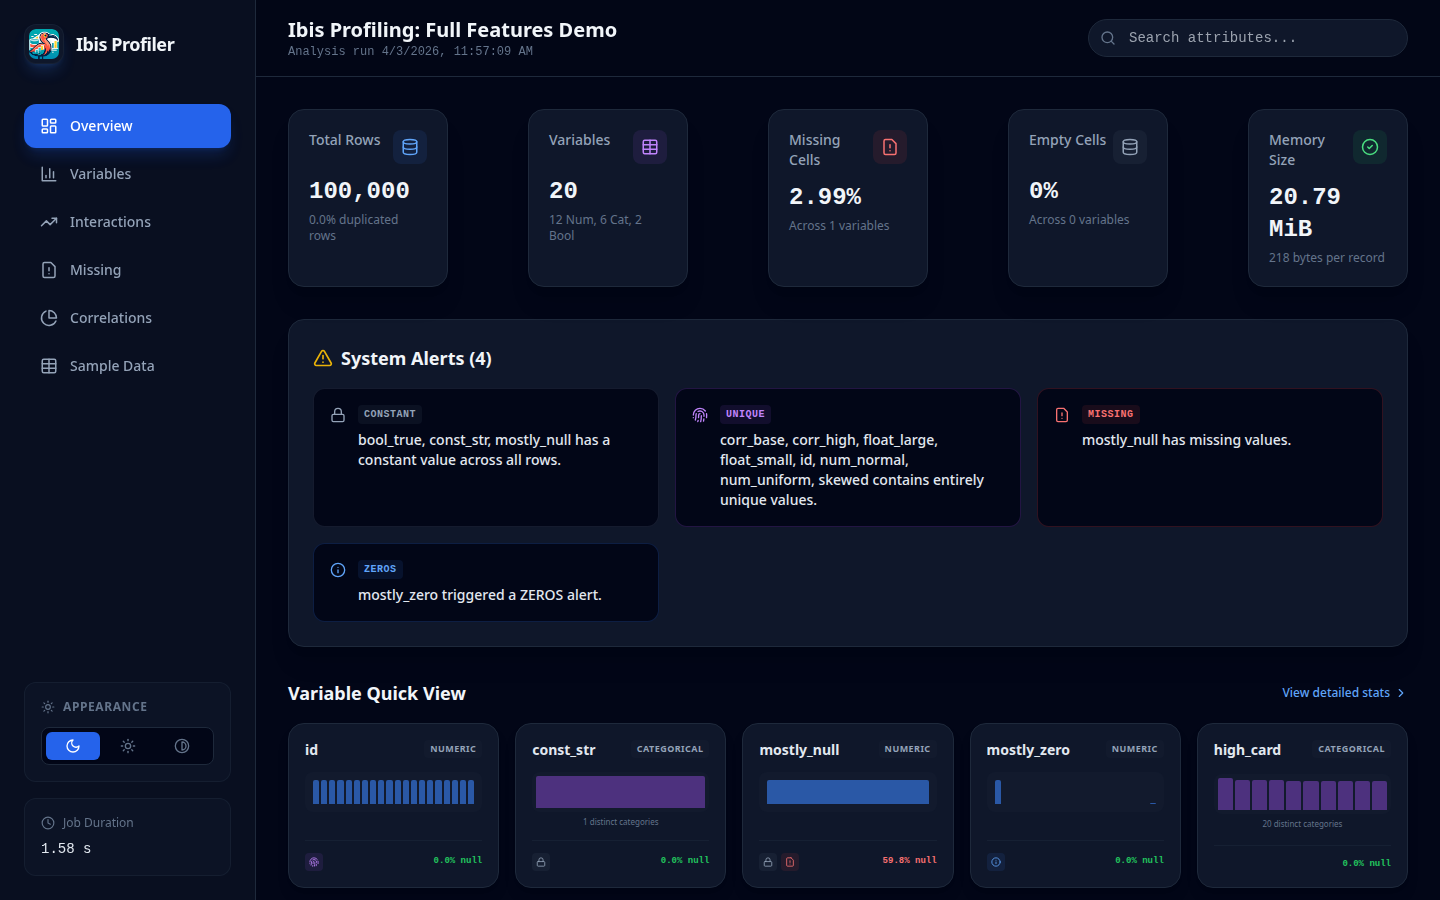
4
|
+
|
|
5
|
+
Permission is hereby granted, free of charge, to any person obtaining a copy
|
|
6
|
+
of this software and associated documentation files (the "Software"), to deal
|
|
7
|
+
in the Software without restriction, including without limitation the rights
|
|
8
|
+
to use, copy, modify, merge, publish, distribute, sublicense, and/or sell
|
|
9
|
+
copies of the Software, and to permit persons to whom the Software is
|
|
10
|
+
furnished to do so, subject to the following conditions:
|
|
11
|
+
|
|
12
|
+
The above copyright notice and this permission notice shall be included in all
|
|
13
|
+
copies or substantial portions of the Software.
|
|
14
|
+
|
|
15
|
+
THE SOFTWARE IS PROVIDED "AS IS", WITHOUT WARRANTY OF ANY KIND, EXPRESS OR
|
|
16
|
+
IMPLIED, INCLUDING BUT NOT LIMITED TO THE WARRANTIES OF MERCHANTABILITY,
|
|
17
|
+
FITNESS FOR A PARTICULAR PURPOSE AND NONINFRINGEMENT. IN NO EVENT SHALL THE
|
|
18
|
+
AUTHORS OR COPYRIGHT HOLDERS BE LIABLE FOR ANY CLAIM, DAMAGES OR OTHER
|
|
19
|
+
LIABILITY, WHETHER IN AN ACTION OF CONTRACT, TORT OR OTHERWISE, ARISING FROM,
|
|
20
|
+
OUT OF OR IN CONNECTION WITH THE SOFTWARE OR THE USE OR OTHER DEALINGS IN THE
|
|
21
|
+
SOFTWARE.
|
|
@@ -0,0 +1,292 @@
|
|
|
1
|
+
Metadata-Version: 2.4
|
|
2
|
+
Name: ibis-profiling
|
|
3
|
+
Version: 0.1.0
|
|
4
|
+
Summary: Ultra-high-performance data profiling natively for Ibis
|
|
5
|
+
Project-URL: Homepage, https://github.com/beallio/ibis-profiling
|
|
6
|
+
Project-URL: Repository, https://github.com/beallio/ibis-profiling
|
|
7
|
+
Project-URL: Issues, https://github.com/beallio/ibis-profiling/issues
|
|
8
|
+
Author-email: David Beall <6121439+beallio@users.noreply.github.com>
|
|
9
|
+
License: MIT
|
|
10
|
+
License-File: LICENSE
|
|
11
|
+
Keywords: data-analysis,duckdb,eda,ibis,pandas,polars,profiling,sql
|
|
12
|
+
Classifier: Development Status :: 4 - Beta
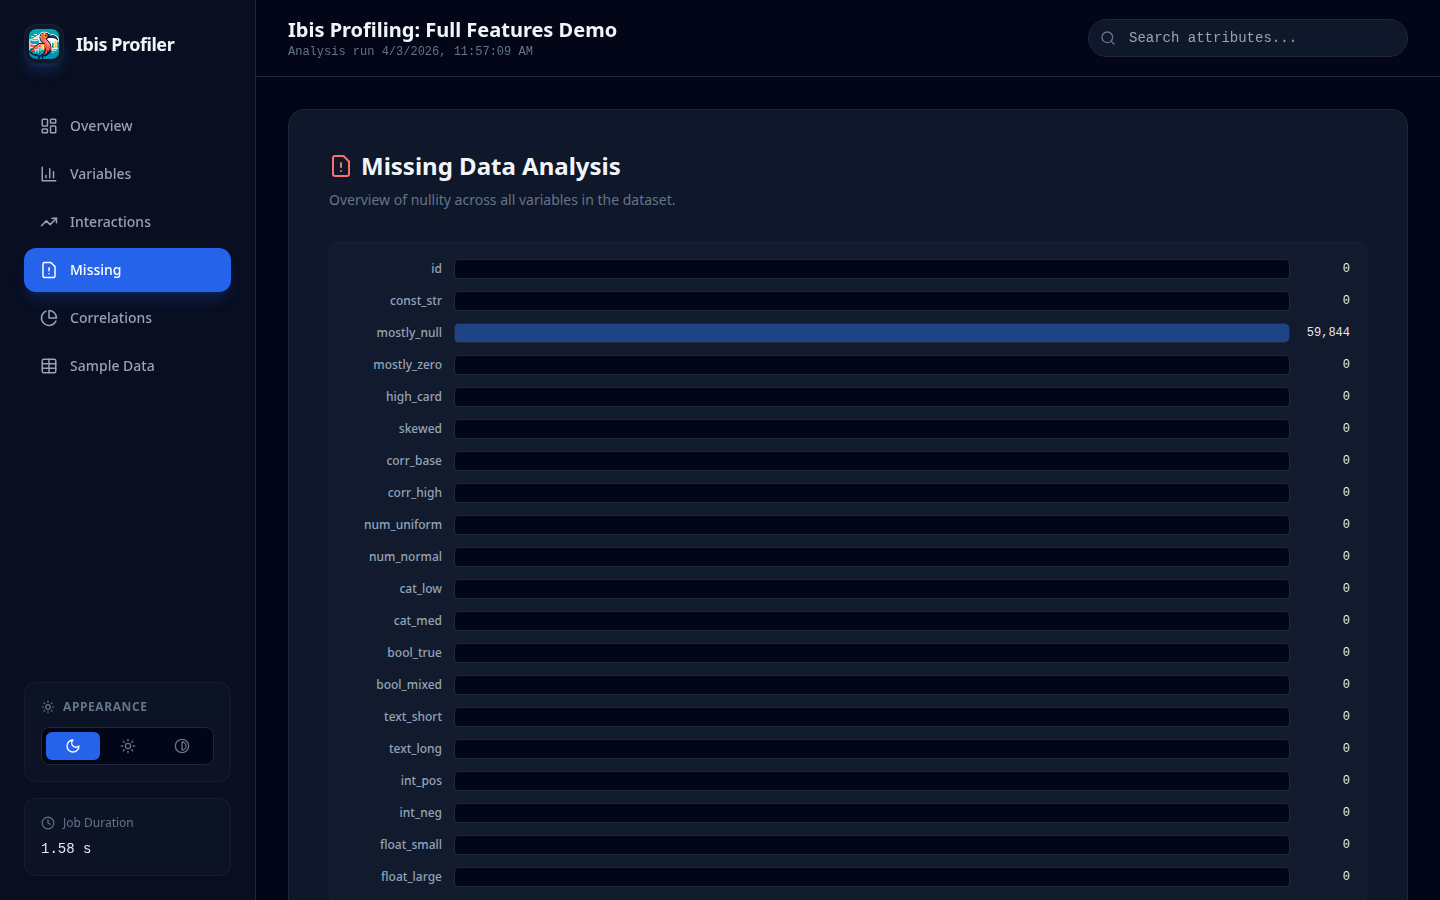
|
|
13
|
+
Classifier: Intended Audience :: Developers
|
|
14
|
+
Classifier: Intended Audience :: Science/Research
|
|
15
|
+
Classifier: License :: OSI Approved :: MIT License
|
|
16
|
+
Classifier: Programming Language :: Python :: 3
|
|
17
|
+
Classifier: Programming Language :: Python :: 3.11
|
|
18
|
+
Classifier: Programming Language :: Python :: 3.12
|
|
19
|
+
Classifier: Topic :: Database
|
|
20
|
+
Classifier: Topic :: Scientific/Engineering :: Information Analysis
|
|
21
|
+
Requires-Python: >=3.11
|
|
22
|
+
Requires-Dist: duckdb>=1.5.0
|
|
23
|
+
Requires-Dist: fastexcel>=0.11.5
|
|
24
|
+
Requires-Dist: ibis-framework>=12.0.0
|
|
25
|
+
Requires-Dist: pandas>=2.3.3
|
|
26
|
+
Requires-Dist: polars>=1.38.1
|
|
27
|
+
Requires-Dist: pyarrow-hotfix>=0.7
|
|
28
|
+
Requires-Dist: pyarrow>=23.0.1
|
|
29
|
+
Requires-Dist: pydantic>=2.12.5
|
|
30
|
+
Description-Content-Type: text/markdown
|
|
31
|
+
|
|
32
|
+
<p align="center">
|
|
33
|
+
<img src="https://raw.githubusercontent.com/beallio/ibis-profiling/main/src/ibis_profiling/assets/img/ibis-profiling-logo.png" width="400" alt="Ibis Profiling Logo">
|
|
34
|
+
</p>
|
|
35
|
+
|
|
36
|
+
# Ibis Profiling
|
|
37
|
+
|
|
38
|
+
An ultra-high-performance data profiling system built natively for **Ibis**.
|
|
39
|
+
|
|
40
|
+
## Core Principle: Profiling as Query Compilation
|
|
41
|
+
|
|
42
|
+
Unlike traditional profiling tools (e.g., `ydata-profiling`) that iterate over columns or load data into local memory (Pandas), **Ibis Profiling** treats profiling as a **query planning problem**.
|
|
43
|
+
|
|
44
|
+
It compiles dozens of statistical metrics into a **minimal set of optimized SQL queries** that execute directly in your remote backend (DuckDB, BigQuery, Snowflake, ClickHouse, etc.). This ensures that computation happens where the data lives, enabling the profiling of multi-billion row datasets in seconds rather than hours.
|
|
45
|
+
|
|
46
|
+
---
|
|
47
|
+
|
|
48
|
+
## 🖼️ Preview
|
|
49
|
+
|
|
50
|
+
### Overview Dashboard
|
|
51
|
+
|
|
52
|
+
|
|
53
|
+
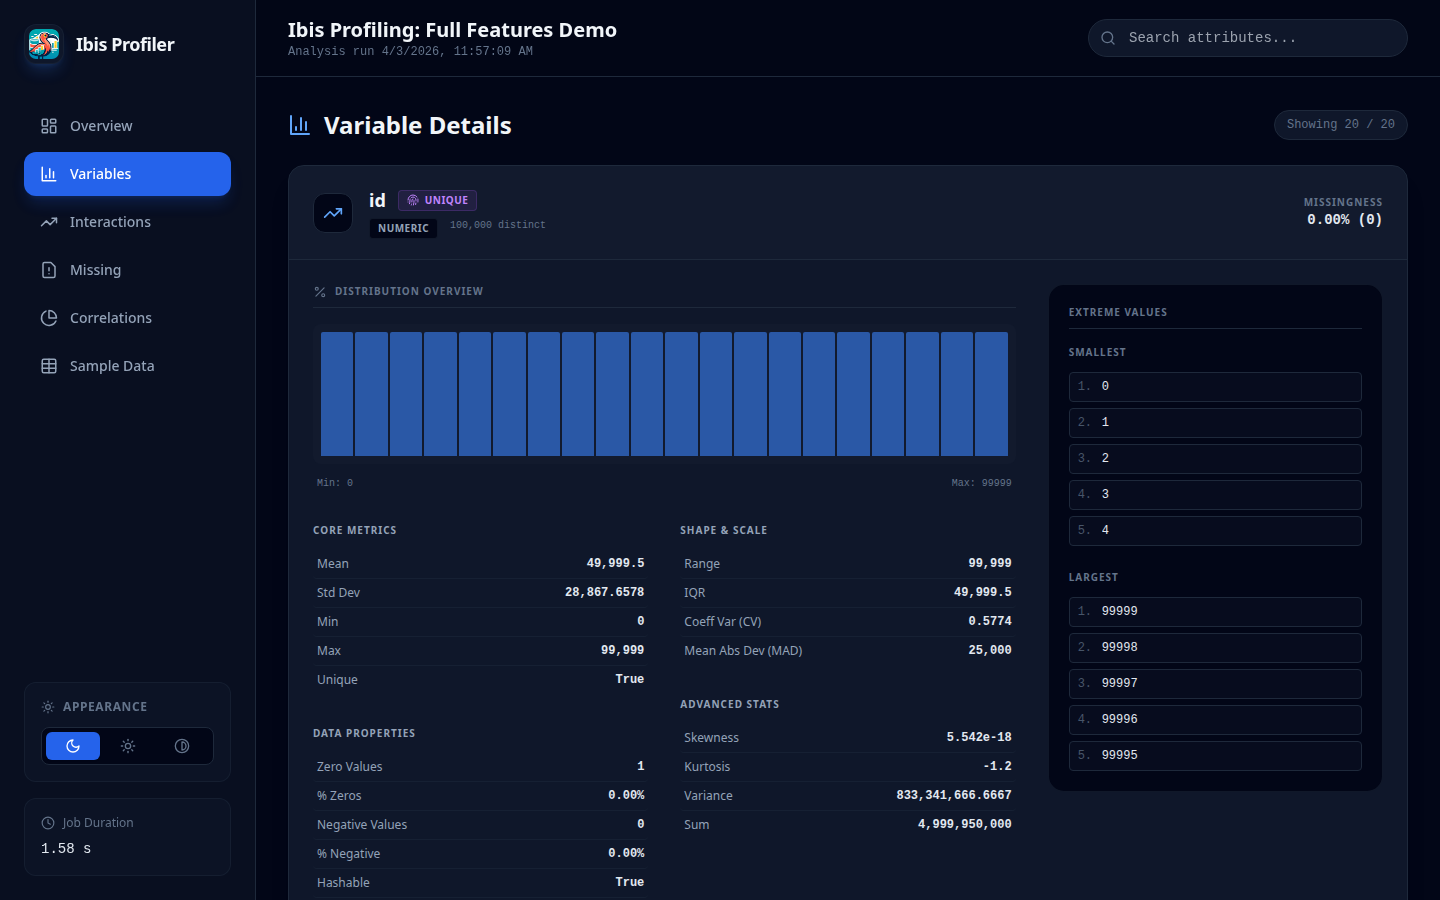
### Variable Detail View
|
|
54
|
+
|
|
55
|
+
|
|
56
|
+
### Missing Values Analysis
|
|
57
|
+
|
|
58
|
+
|
|
59
|
+
|
|
60
|
+
---
|
|
61
|
+
|
|
62
|
+
## 🚀 Key Features
|
|
63
|
+
|
|
64
|
+
- **Backend Pushdown:** 100% of the heavy lifting is done by the database engine.
|
|
65
|
+
- **Multi-Pass Execution:** Intelligently splits computation into optimized passes to handle complex moments (Skewness, MAD) without backend "nested aggregation" errors.
|
|
66
|
+
- **JSON Schema Parity:** Achieves full structural and statistical parity with `ydata-profiling`, allowing drop-in replacement for downstream automated pipelines.
|
|
67
|
+
- **Modern SPA Report:** Generates a lightweight Single Page Application (SPA) with a modern React-based UI.
|
|
68
|
+
- **Adjustable Themes:** Includes built-in support for **Dark**, **Light**, and **High Contrast** modes with persistent user settings.
|
|
69
|
+
- **Auto-Categorical Detection:** Intelligent heuristics automatically reclassify low-cardinality integers (e.g., status codes, term months) as categorical for better visualization.
|
|
70
|
+
- **DateTime Distribution:** Full support for temporal histograms and distribution analysis.
|
|
71
|
+
- **Excel Support:** Directly profile Excel files (.xlsx, .xls, .xlsb) using high-performance Rust-based parsing.
|
|
72
|
+
- **Scalability:** Profile **5 million rows in < 12 seconds** (Minimal mode) and **< 22 seconds** (Full mode).
|
|
73
|
+
- **Python Compatibility:** Fully tested on **Python 3.11 through 3.14.3** (Core functionality).
|
|
74
|
+
|
|
75
|
+
---
|
|
76
|
+
|
|
77
|
+
## 🛡️ Backend Stability & NaN Handling
|
|
78
|
+
|
|
79
|
+
A critical challenge in database-native profiling is the handling of `NaN` (Not-a-Number) values in floating-point columns. Traditional database aggregations (like `STDDEV_SAMP` in DuckDB) often throw `OutOfRange` errors when encountering `NaN`s.
|
|
80
|
+
|
|
81
|
+
**Ibis Profiling** implements a **Safe-Aggregation** layer that automatically treats `NaN` values as `NULL` during statistical computation. This ensures:
|
|
82
|
+
1. **Zero Crash Policy:** Profiles complete successfully even on messy synthetic or sensor data.
|
|
83
|
+
2. **Mathematical Consistency:** Statistics (mean, std, variance) are computed on the subset of valid numeric values, matching the behavior of high-level tools like Pandas while staying within the database.
|
|
84
|
+
|
|
85
|
+
---
|
|
86
|
+
|
|
87
|
+
## 📈 Performance Benchmarks
|
|
88
|
+
|
|
89
|
+
Benchmarks were conducted using a synthetic dataset with 20 columns (mix of numeric, categorical, text, and boolean) on a standard Linux environment using the **DuckDB** backend.
|
|
90
|
+
|
|
91
|
+
| Dataset Size | Ibis (Min) | Ibis (Full) | ydata (Min) | ydata (Full) | Mem Ibis (Min) | Mem ydata (Min) | Mem Ibis (Full) | Mem ydata (Full) |
|
|
92
|
+
| :--- | :--- | :--- | :--- | :--- | :--- | :--- | :--- | :--- |
|
|
93
|
+
| **10k Rows** | 0.89s | 1.40s | 9.94s | 28.38s | ~2.4 MB | ~74 MB | ~4.5 MB | ~107 MB |
|
|
94
|
+
| **25k Rows** | 1.03s | 1.57s | 12.20s | 30.47s | ~2.1 MB | ~154 MB | ~4.4 MB | ~188 MB |
|
|
95
|
+
| **50k Rows** | 1.22s | 1.82s | 16.63s | 35.10s | ~2.0 MB | ~284 MB | ~4.4 MB | ~324 MB |
|
|
96
|
+
| **500k Rows** | 2.29s | 3.56s | 91.93s | ~3m (est) | ~2.0 MB | ~2.5 GB | ~4.4 MB | ~2.8 GB (est) |
|
|
97
|
+
| **1M Rows** | 3.14s | 5.44s | 166.31s | ~6m (est) | ~2.1 MB | ~4.9 GB | ~4.4 MB | ~5.3 GB (est) |
|
|
98
|
+
| **5M Rows** | 10.69s | 17.88s | ~14m (est) | ~45m (est) | ~2.0 MB | >20 GB (est) | ~4.4 MB | >25 GB (est) |
|
|
99
|
+
| **10M Rows** | 20.64s | 21.29s* | ~28m (est) | ~1.5h (est) | ~2.4 MB | >40 GB (est) | ~2.6 MB* | >50 GB (est) |
|
|
100
|
+
| **20M Rows** | 43.98s | 8.77s** | >1h (est) | >3h (est) | ~2.4 MB | >80 GB (est) | ~1.0 MB** | >100 GB (est) |
|
|
101
|
+
|
|
102
|
+
*Notes:
|
|
103
|
+
- 10M Full (21.29s) used 10 columns.
|
|
104
|
+
- 20M Full (8.77s) used 5 columns.
|
|
105
|
+
- All other benchmarks use 20 columns.
|
|
106
|
+
- Ibis memory usage is nearly constant and extremely low compared to ydata-profiling due to database-native pushdown.*
|
|
107
|
+
|
|
108
|
+
### 🔍 Estimation Methodology
|
|
109
|
+
Projections for `ydata-profiling` on larger datasets are derived from observed scaling trends:
|
|
110
|
+
- **Time (Minimal):** Scaled linearly based on the jump from 500k (92s) to 1M (166s) rows.
|
|
111
|
+
- **Time (Full):** Scaled with a factor of ~2.5x - 3x over Minimal mode, consistent with small-sample ratios.
|
|
112
|
+
- **Memory:** Scaled linearly based on observed peak usage (~2.5 GB at 500k, ~4.9 GB at 1M), reflecting the overhead of loading the full dataset into Pandas DataFrames.
|
|
113
|
+
|
|
114
|
+
---
|
|
115
|
+
|
|
116
|
+
## 🛠 Installation
|
|
117
|
+
|
|
118
|
+
Since **Ibis Profiling** is in active development and not yet on PyPI, you can install it directly from GitHub:
|
|
119
|
+
|
|
120
|
+
### Using [uv](https://github.com/astral-sh/uv) (Recommended)
|
|
121
|
+
```bash
|
|
122
|
+
uv add git+https://github.com/beallio/ibis-profiling.git
|
|
123
|
+
```
|
|
124
|
+
|
|
125
|
+
### Using pip
|
|
126
|
+
```bash
|
|
127
|
+
pip install git+https://github.com/beallio/ibis-profiling.git
|
|
128
|
+
```
|
|
129
|
+
|
|
130
|
+
---
|
|
131
|
+
|
|
132
|
+
## 💻 Usage
|
|
133
|
+
|
|
134
|
+
|
|
135
|
+
### Quick Start (ydata-style API)
|
|
136
|
+
|
|
137
|
+
```python
|
|
138
|
+
import ibis
|
|
139
|
+
from ibis_profiling import ProfileReport
|
|
140
|
+
|
|
141
|
+
# 1. Connect to any Ibis-supported backend
|
|
142
|
+
con = ibis.duckdb.connect()
|
|
143
|
+
table = con.read_parquet("large_dataset.parquet")
|
|
144
|
+
|
|
145
|
+
# 2. Generate the report with custom title
|
|
146
|
+
report = ProfileReport(table, title="Loan Analysis Report")
|
|
147
|
+
|
|
148
|
+
# 3. Export results
|
|
149
|
+
report.to_file("report.html")
|
|
150
|
+
```
|
|
151
|
+
|
|
152
|
+
### Excel Ingestion
|
|
153
|
+
|
|
154
|
+
```python
|
|
155
|
+
from ibis_profiling import ProfileReport
|
|
156
|
+
|
|
157
|
+
# Directly profile Excel files with high-performance parsing
|
|
158
|
+
report = ProfileReport.from_excel("data.xlsx")
|
|
159
|
+
report.to_file("excel_report.html")
|
|
160
|
+
```
|
|
161
|
+
|
|
162
|
+
### Advanced Usage
|
|
163
|
+
|
|
164
|
+
```python
|
|
165
|
+
from ibis_profiling import profile
|
|
166
|
+
|
|
167
|
+
# Get the raw description dictionary
|
|
168
|
+
report = profile(table)
|
|
169
|
+
stats = report.to_dict()
|
|
170
|
+
|
|
171
|
+
print(f"Dataset Skewness: {stats['variables']['income']['skewness']}")
|
|
172
|
+
```
|
|
173
|
+
|
|
174
|
+
### Minimal vs. Full Profiling
|
|
175
|
+
|
|
176
|
+
The `ProfileReport` supports a `minimal` flag (default `False`) to toggle between fast exploratory profiling and deep statistical analysis.
|
|
177
|
+
|
|
178
|
+
| Feature | Minimal Mode (`minimal=True`) | Full Mode (`minimal=False`) |
|
|
179
|
+
| :--- | :--- | :--- |
|
|
180
|
+
| **Core Stats** | Count, Mean, Std, Min/Max, Zeros, Nullity. | All Minimal stats. |
|
|
181
|
+
| **Table Metadata** | Estimated Memory/Record Size. | Same as Minimal. |
|
|
182
|
+
| **Advanced Moments** | Skipped. | Skewness, Kurtosis, MAD. |
|
|
183
|
+
| **Correlations** | Skipped. | Pearson and Spearman matrices. |
|
|
184
|
+
| **Advanced Analysis** | Skipped. | Extreme Values, Monotonicity, Text Lengths. |
|
|
185
|
+
| **Visualizations** | **Histograms (Numeric/DateTime)**, Summary only. | Nullity Matrix (SVG), Heatmap, **Scatter Plots**. |
|
|
186
|
+
| **Duplicates** | Skipped. | Dataset-wide duplicate row count. |
|
|
187
|
+
| **Performance** | **Ultra-Fast.** Recommended for datasets > 50M rows. | **Detailed.** Recommended for deep data quality audits. |
|
|
188
|
+
|
|
189
|
+
## 📦 Report Export & Minification
|
|
190
|
+
|
|
191
|
+
By default, `ibis-profiling` minifies the generated HTML report to reduce file size (typically by 15-20%) without compromising functionality. Minification includes:
|
|
192
|
+
- Stripping HTML, CSS, and JS comments.
|
|
193
|
+
- Removing redundant whitespace and empty lines from the template.
|
|
194
|
+
- Compact JSON embedding (removing internal whitespace in the data payload).
|
|
195
|
+
|
|
196
|
+
To generate a human-readable (non-minified) report, set `minify=False` in `to_file` or `to_html`:
|
|
197
|
+
|
|
198
|
+
```python
|
|
199
|
+
# Save as formatted HTML
|
|
200
|
+
report.to_file("report.html", minify=False)
|
|
201
|
+
|
|
202
|
+
# Get the formatted HTML string
|
|
203
|
+
html = report.to_html(minify=False)
|
|
204
|
+
```
|
|
205
|
+
|
|
206
|
+
## Feature Gaps & Roadmap
|
|
207
|
+
|
|
208
|
+
`ibis-profiling` is designed for scale, prioritizing metrics that can be pushed down to SQL engines. As a result, some "linguistic" or high-complexity features from `ydata-profiling` are currently missing or implemented as approximations:
|
|
209
|
+
|
|
210
|
+
1. **Linguistic Analysis:** Unicode script detection and character-level distributions are missing (require complex UDFs).
|
|
211
|
+
2. **Advanced Correlations:** `phi_k`, `kendall`, and `cramers_v` are currently placeholders (higher computational complexity).
|
|
212
|
+
3. **Memory Footprint:** While Ibis uses backend-specific commands (like DuckDB's `PRAGMA storage_info`) where possible, it falls back to schema-based estimation for others.
|
|
213
|
+
|
|
214
|
+
---
|
|
215
|
+
|
|
216
|
+
## 🏗 Architecture
|
|
217
|
+
|
|
218
|
+
The system is decoupled into five core modules:
|
|
219
|
+
1. **Dataset Inspector:** Zero-execution schema analysis.
|
|
220
|
+
2. **Metric Registry:** Declarative metric definitions as Ibis expressions.
|
|
221
|
+
3. **Query Planner:** The "compiler" that batches compatible expressions into minimal execution plans.
|
|
222
|
+
4. **Execution Engine:** Multi-pass dispatcher that handles simple vs. complex aggregations.
|
|
223
|
+
5. **Report Builder:** Aggregates and formats raw backend results into high-fidelity JSON/HTML following the canonical YData schema.
|
|
224
|
+
|
|
225
|
+
---
|
|
226
|
+
|
|
227
|
+
## 📊 Missing Values Analysis
|
|
228
|
+
|
|
229
|
+
Move beyond simple counts with advanced pattern detection:
|
|
230
|
+
- **Matrix:** A vertical sparkline grid (SVG) visualizing the location of missing values across rows.
|
|
231
|
+
- **Heatmap:** Pearson correlation of "nullity" between variables, revealing structural dependencies.
|
|
232
|
+
|
|
233
|
+
---
|
|
234
|
+
|
|
235
|
+
## 📏 Metrics & Calculation Reference
|
|
236
|
+
|
|
237
|
+
This section provides a detailed breakdown of how metrics are calculated and how the alert engine identifies potential data quality issues.
|
|
238
|
+
|
|
239
|
+
### 1. Variable Calculations
|
|
240
|
+
|
|
241
|
+
The profiler uses a multi-pass execution engine to compute statistics efficiently across massive datasets while remaining compatible with SQL-based backends (like DuckDB).
|
|
242
|
+
|
|
243
|
+
#### Core Statistics (Pass 1)
|
|
244
|
+
These are computed in a single global aggregation pass using Ibis primitives.
|
|
245
|
+
|
|
246
|
+
| Metric | Calculation | Type |
|
|
247
|
+
| :--- | :--- | :--- |
|
|
248
|
+
| `n` | Total number of observations (rows) in the table. | All |
|
|
249
|
+
| `n_missing` | Count of `NULL` or `NaN` values. | All |
|
|
250
|
+
| `p_missing` | `n_missing / n` | All |
|
|
251
|
+
| `n_distinct` | Count of unique values (excluding `NULL`). Used for auto-categorical detection. | All |
|
|
252
|
+
| `p_distinct` | `n_distinct / n` | All |
|
|
253
|
+
| `count` | `n - n_missing` (Total non-missing values) | All |
|
|
254
|
+
| `mean` | `sum(x) / count` (NaNs treated as NULL) | Numeric |
|
|
255
|
+
| `std` | Sample standard deviation (Bessel's correction). | Numeric |
|
|
256
|
+
| `variance` | `std^2` | Numeric |
|
|
257
|
+
| `min` / `max` | Minimum and maximum values. | Numeric, DateTime |
|
|
258
|
+
| `n_zeros` | Count of values exactly equal to `0`. | Numeric |
|
|
259
|
+
| `n_negative` | Count of values `< 0`. | Numeric |
|
|
260
|
+
| `n_infinite` | Count of `+/- inf` values (Float only). | Numeric |
|
|
261
|
+
| `histogram` | Binned distribution (Numeric/DateTime) or Top Values (Categorical). | All |
|
|
262
|
+
|
|
263
|
+
#### Advanced Statistics (Pass 2)
|
|
264
|
+
To avoid "Nested Aggregation" errors in SQL backends, these are computed using values from Pass 1 as constants.
|
|
265
|
+
|
|
266
|
+
| Metric | Calculation | Logic |
|
|
267
|
+
| :--- | :--- | :--- |
|
|
268
|
+
| `skewness` | `mean( ((x - μ) / σ)^3 )` | Standardized 3rd moment. |
|
|
269
|
+
| `mad` | `mean( abs(x - μ) )` | Mean Absolute Deviation. |
|
|
270
|
+
| `n_duplicates` | `n - count(distinct_rows)` | Dataset-wide duplicate row count. |
|
|
271
|
+
|
|
272
|
+
#### Quantiles
|
|
273
|
+
Calculated via `col.quantile(p)`.
|
|
274
|
+
- `5%`, `25%` (Q1), `50%` (Median), `75%` (Q3), `95%`.
|
|
275
|
+
|
|
276
|
+
---
|
|
277
|
+
|
|
278
|
+
### 2. Alert Engine Logic
|
|
279
|
+
|
|
280
|
+
The built-in alert engine scans the calculated metrics and triggers warnings based on industry-standard thresholds (aligned with `ydata-profiling`).
|
|
281
|
+
|
|
282
|
+
| Alert Type | Logic / Threshold | Severity |
|
|
283
|
+
| :--- | :--- | :--- |
|
|
284
|
+
| **CONSTANT** | `n_distinct == 1` | warning |
|
|
285
|
+
| **UNIQUE** | `n_distinct == n` | warning |
|
|
286
|
+
| **HIGH_CARDINALITY** | `p_distinct > 0.5` (and not `UNIQUE`, Categorical only) | warning |
|
|
287
|
+
| **MISSING** | `p_missing > 0.05` | info |
|
|
288
|
+
| **ZEROS** | `p_zeros > 0.10` | info |
|
|
289
|
+
| **SKEWED** | `abs(skewness) > 10` | info |
|
|
290
|
+
**Suppression Rules:**
|
|
291
|
+
1. If a column is **CONSTANT**, all other alerts for that column are suppressed.
|
|
292
|
+
2. If a column is **UNIQUE**, the **HIGH_CARDINALITY** alert is suppressed.
|
|
@@ -0,0 +1,261 @@
|
|
|
1
|
+
<p align="center">
|
|
2
|
+
<img src="https://raw.githubusercontent.com/beallio/ibis-profiling/main/src/ibis_profiling/assets/img/ibis-profiling-logo.png" width="400" alt="Ibis Profiling Logo">
|
|
3
|
+
</p>
|
|
4
|
+
|
|
5
|
+
# Ibis Profiling
|
|
6
|
+
|
|
7
|
+
An ultra-high-performance data profiling system built natively for **Ibis**.
|
|
8
|
+
|
|
9
|
+
## Core Principle: Profiling as Query Compilation
|
|
10
|
+
|
|
11
|
+
Unlike traditional profiling tools (e.g., `ydata-profiling`) that iterate over columns or load data into local memory (Pandas), **Ibis Profiling** treats profiling as a **query planning problem**.
|
|
12
|
+
|
|
13
|
+
It compiles dozens of statistical metrics into a **minimal set of optimized SQL queries** that execute directly in your remote backend (DuckDB, BigQuery, Snowflake, ClickHouse, etc.). This ensures that computation happens where the data lives, enabling the profiling of multi-billion row datasets in seconds rather than hours.
|
|
14
|
+
|
|
15
|
+
---
|
|
16
|
+
|
|
17
|
+
## 🖼️ Preview
|
|
18
|
+
|
|
19
|
+
### Overview Dashboard
|
|
20
|
+

|
|
21
|
+
|
|
22
|
+
### Variable Detail View
|
|
23
|
+

|
|
24
|
+
|
|
25
|
+
### Missing Values Analysis
|
|
26
|
+

|
|
27
|
+
|
|
28
|
+
|
|
29
|
+
---
|
|
30
|
+
|
|
31
|
+
## 🚀 Key Features
|
|
32
|
+
|
|
33
|
+
- **Backend Pushdown:** 100% of the heavy lifting is done by the database engine.
|
|
34
|
+
- **Multi-Pass Execution:** Intelligently splits computation into optimized passes to handle complex moments (Skewness, MAD) without backend "nested aggregation" errors.
|
|
35
|
+
- **JSON Schema Parity:** Achieves full structural and statistical parity with `ydata-profiling`, allowing drop-in replacement for downstream automated pipelines.
|
|
36
|
+
- **Modern SPA Report:** Generates a lightweight Single Page Application (SPA) with a modern React-based UI.
|
|
37
|
+
- **Adjustable Themes:** Includes built-in support for **Dark**, **Light**, and **High Contrast** modes with persistent user settings.
|
|
38
|
+
- **Auto-Categorical Detection:** Intelligent heuristics automatically reclassify low-cardinality integers (e.g., status codes, term months) as categorical for better visualization.
|
|
39
|
+
- **DateTime Distribution:** Full support for temporal histograms and distribution analysis.
|
|
40
|
+
- **Excel Support:** Directly profile Excel files (.xlsx, .xls, .xlsb) using high-performance Rust-based parsing.
|
|
41
|
+
- **Scalability:** Profile **5 million rows in < 12 seconds** (Minimal mode) and **< 22 seconds** (Full mode).
|
|
42
|
+
- **Python Compatibility:** Fully tested on **Python 3.11 through 3.14.3** (Core functionality).
|
|
43
|
+
|
|
44
|
+
---
|
|
45
|
+
|
|
46
|
+
## 🛡️ Backend Stability & NaN Handling
|
|
47
|
+
|
|
48
|
+
A critical challenge in database-native profiling is the handling of `NaN` (Not-a-Number) values in floating-point columns. Traditional database aggregations (like `STDDEV_SAMP` in DuckDB) often throw `OutOfRange` errors when encountering `NaN`s.
|
|
49
|
+
|
|
50
|
+
**Ibis Profiling** implements a **Safe-Aggregation** layer that automatically treats `NaN` values as `NULL` during statistical computation. This ensures:
|
|
51
|
+
1. **Zero Crash Policy:** Profiles complete successfully even on messy synthetic or sensor data.
|
|
52
|
+
2. **Mathematical Consistency:** Statistics (mean, std, variance) are computed on the subset of valid numeric values, matching the behavior of high-level tools like Pandas while staying within the database.
|
|
53
|
+
|
|
54
|
+
---
|
|
55
|
+
|
|
56
|
+
## 📈 Performance Benchmarks
|
|
57
|
+
|
|
58
|
+
Benchmarks were conducted using a synthetic dataset with 20 columns (mix of numeric, categorical, text, and boolean) on a standard Linux environment using the **DuckDB** backend.
|
|
59
|
+
|
|
60
|
+
| Dataset Size | Ibis (Min) | Ibis (Full) | ydata (Min) | ydata (Full) | Mem Ibis (Min) | Mem ydata (Min) | Mem Ibis (Full) | Mem ydata (Full) |
|
|
61
|
+
| :--- | :--- | :--- | :--- | :--- | :--- | :--- | :--- | :--- |
|
|
62
|
+
| **10k Rows** | 0.89s | 1.40s | 9.94s | 28.38s | ~2.4 MB | ~74 MB | ~4.5 MB | ~107 MB |
|
|
63
|
+
| **25k Rows** | 1.03s | 1.57s | 12.20s | 30.47s | ~2.1 MB | ~154 MB | ~4.4 MB | ~188 MB |
|
|
64
|
+
| **50k Rows** | 1.22s | 1.82s | 16.63s | 35.10s | ~2.0 MB | ~284 MB | ~4.4 MB | ~324 MB |
|
|
65
|
+
| **500k Rows** | 2.29s | 3.56s | 91.93s | ~3m (est) | ~2.0 MB | ~2.5 GB | ~4.4 MB | ~2.8 GB (est) |
|
|
66
|
+
| **1M Rows** | 3.14s | 5.44s | 166.31s | ~6m (est) | ~2.1 MB | ~4.9 GB | ~4.4 MB | ~5.3 GB (est) |
|
|
67
|
+
| **5M Rows** | 10.69s | 17.88s | ~14m (est) | ~45m (est) | ~2.0 MB | >20 GB (est) | ~4.4 MB | >25 GB (est) |
|
|
68
|
+
| **10M Rows** | 20.64s | 21.29s* | ~28m (est) | ~1.5h (est) | ~2.4 MB | >40 GB (est) | ~2.6 MB* | >50 GB (est) |
|
|
69
|
+
| **20M Rows** | 43.98s | 8.77s** | >1h (est) | >3h (est) | ~2.4 MB | >80 GB (est) | ~1.0 MB** | >100 GB (est) |
|
|
70
|
+
|
|
71
|
+
*Notes:
|
|
72
|
+
- 10M Full (21.29s) used 10 columns.
|
|
73
|
+
- 20M Full (8.77s) used 5 columns.
|
|
74
|
+
- All other benchmarks use 20 columns.
|
|
75
|
+
- Ibis memory usage is nearly constant and extremely low compared to ydata-profiling due to database-native pushdown.*
|
|
76
|
+
|
|
77
|
+
### 🔍 Estimation Methodology
|
|
78
|
+
Projections for `ydata-profiling` on larger datasets are derived from observed scaling trends:
|
|
79
|
+
- **Time (Minimal):** Scaled linearly based on the jump from 500k (92s) to 1M (166s) rows.
|
|
80
|
+
- **Time (Full):** Scaled with a factor of ~2.5x - 3x over Minimal mode, consistent with small-sample ratios.
|
|
81
|
+
- **Memory:** Scaled linearly based on observed peak usage (~2.5 GB at 500k, ~4.9 GB at 1M), reflecting the overhead of loading the full dataset into Pandas DataFrames.
|
|
82
|
+
|
|
83
|
+
---
|
|
84
|
+
|
|
85
|
+
## 🛠 Installation
|
|
86
|
+
|
|
87
|
+
Since **Ibis Profiling** is in active development and not yet on PyPI, you can install it directly from GitHub:
|
|
88
|
+
|
|
89
|
+
### Using [uv](https://github.com/astral-sh/uv) (Recommended)
|
|
90
|
+
```bash
|
|
91
|
+
uv add git+https://github.com/beallio/ibis-profiling.git
|
|
92
|
+
```
|
|
93
|
+
|
|
94
|
+
### Using pip
|
|
95
|
+
```bash
|
|
96
|
+
pip install git+https://github.com/beallio/ibis-profiling.git
|
|
97
|
+
```
|
|
98
|
+
|
|
99
|
+
---
|
|
100
|
+
|
|
101
|
+
## 💻 Usage
|
|
102
|
+
|
|
103
|
+
|
|
104
|
+
### Quick Start (ydata-style API)
|
|
105
|
+
|
|
106
|
+
```python
|
|
107
|
+
import ibis
|
|
108
|
+
from ibis_profiling import ProfileReport
|
|
109
|
+
|
|
110
|
+
# 1. Connect to any Ibis-supported backend
|
|
111
|
+
con = ibis.duckdb.connect()
|
|
112
|
+
table = con.read_parquet("large_dataset.parquet")
|
|
113
|
+
|
|
114
|
+
# 2. Generate the report with custom title
|
|
115
|
+
report = ProfileReport(table, title="Loan Analysis Report")
|
|
116
|
+
|
|
117
|
+
# 3. Export results
|
|
118
|
+
report.to_file("report.html")
|
|
119
|
+
```
|
|
120
|
+
|
|
121
|
+
### Excel Ingestion
|
|
122
|
+
|
|
123
|
+
```python
|
|
124
|
+
from ibis_profiling import ProfileReport
|
|
125
|
+
|
|
126
|
+
# Directly profile Excel files with high-performance parsing
|
|
127
|
+
report = ProfileReport.from_excel("data.xlsx")
|
|
128
|
+
report.to_file("excel_report.html")
|
|
129
|
+
```
|
|
130
|
+
|
|
131
|
+
### Advanced Usage
|
|
132
|
+
|
|
133
|
+
```python
|
|
134
|
+
from ibis_profiling import profile
|
|
135
|
+
|
|
136
|
+
# Get the raw description dictionary
|
|
137
|
+
report = profile(table)
|
|
138
|
+
stats = report.to_dict()
|
|
139
|
+
|
|
140
|
+
print(f"Dataset Skewness: {stats['variables']['income']['skewness']}")
|
|
141
|
+
```
|
|
142
|
+
|
|
143
|
+
### Minimal vs. Full Profiling
|
|
144
|
+
|
|
145
|
+
The `ProfileReport` supports a `minimal` flag (default `False`) to toggle between fast exploratory profiling and deep statistical analysis.
|
|
146
|
+
|
|
147
|
+
| Feature | Minimal Mode (`minimal=True`) | Full Mode (`minimal=False`) |
|
|
148
|
+
| :--- | :--- | :--- |
|
|
149
|
+
| **Core Stats** | Count, Mean, Std, Min/Max, Zeros, Nullity. | All Minimal stats. |
|
|
150
|
+
| **Table Metadata** | Estimated Memory/Record Size. | Same as Minimal. |
|
|
151
|
+
| **Advanced Moments** | Skipped. | Skewness, Kurtosis, MAD. |
|
|
152
|
+
| **Correlations** | Skipped. | Pearson and Spearman matrices. |
|
|
153
|
+
| **Advanced Analysis** | Skipped. | Extreme Values, Monotonicity, Text Lengths. |
|
|
154
|
+
| **Visualizations** | **Histograms (Numeric/DateTime)**, Summary only. | Nullity Matrix (SVG), Heatmap, **Scatter Plots**. |
|
|
155
|
+
| **Duplicates** | Skipped. | Dataset-wide duplicate row count. |
|
|
156
|
+
| **Performance** | **Ultra-Fast.** Recommended for datasets > 50M rows. | **Detailed.** Recommended for deep data quality audits. |
|
|
157
|
+
|
|
158
|
+
## 📦 Report Export & Minification
|
|
159
|
+
|
|
160
|
+
By default, `ibis-profiling` minifies the generated HTML report to reduce file size (typically by 15-20%) without compromising functionality. Minification includes:
|
|
161
|
+
- Stripping HTML, CSS, and JS comments.
|
|
162
|
+
- Removing redundant whitespace and empty lines from the template.
|
|
163
|
+
- Compact JSON embedding (removing internal whitespace in the data payload).
|
|
164
|
+
|
|
165
|
+
To generate a human-readable (non-minified) report, set `minify=False` in `to_file` or `to_html`:
|
|
166
|
+
|
|
167
|
+
```python
|
|
168
|
+
# Save as formatted HTML
|
|
169
|
+
report.to_file("report.html", minify=False)
|
|
170
|
+
|
|
171
|
+
# Get the formatted HTML string
|
|
172
|
+
html = report.to_html(minify=False)
|
|
173
|
+
```
|
|
174
|
+
|
|
175
|
+
## Feature Gaps & Roadmap
|
|
176
|
+
|
|
177
|
+
`ibis-profiling` is designed for scale, prioritizing metrics that can be pushed down to SQL engines. As a result, some "linguistic" or high-complexity features from `ydata-profiling` are currently missing or implemented as approximations:
|
|
178
|
+
|
|
179
|
+
1. **Linguistic Analysis:** Unicode script detection and character-level distributions are missing (require complex UDFs).
|
|
180
|
+
2. **Advanced Correlations:** `phi_k`, `kendall`, and `cramers_v` are currently placeholders (higher computational complexity).
|
|
181
|
+
3. **Memory Footprint:** While Ibis uses backend-specific commands (like DuckDB's `PRAGMA storage_info`) where possible, it falls back to schema-based estimation for others.
|
|
182
|
+
|
|
183
|
+
---
|
|
184
|
+
|
|
185
|
+
## 🏗 Architecture
|
|
186
|
+
|
|
187
|
+
The system is decoupled into five core modules:
|
|
188
|
+
1. **Dataset Inspector:** Zero-execution schema analysis.
|
|
189
|
+
2. **Metric Registry:** Declarative metric definitions as Ibis expressions.
|
|
190
|
+
3. **Query Planner:** The "compiler" that batches compatible expressions into minimal execution plans.
|
|
191
|
+
4. **Execution Engine:** Multi-pass dispatcher that handles simple vs. complex aggregations.
|
|
192
|
+
5. **Report Builder:** Aggregates and formats raw backend results into high-fidelity JSON/HTML following the canonical YData schema.
|
|
193
|
+
|
|
194
|
+
---
|
|
195
|
+
|
|
196
|
+
## 📊 Missing Values Analysis
|
|
197
|
+
|
|
198
|
+
Move beyond simple counts with advanced pattern detection:
|
|
199
|
+
- **Matrix:** A vertical sparkline grid (SVG) visualizing the location of missing values across rows.
|
|
200
|
+
- **Heatmap:** Pearson correlation of "nullity" between variables, revealing structural dependencies.
|
|
201
|
+
|
|
202
|
+
---
|
|
203
|
+
|
|
204
|
+
## 📏 Metrics & Calculation Reference
|
|
205
|
+
|
|
206
|
+
This section provides a detailed breakdown of how metrics are calculated and how the alert engine identifies potential data quality issues.
|
|
207
|
+
|
|
208
|
+
### 1. Variable Calculations
|
|
209
|
+
|
|
210
|
+
The profiler uses a multi-pass execution engine to compute statistics efficiently across massive datasets while remaining compatible with SQL-based backends (like DuckDB).
|
|
211
|
+
|
|
212
|
+
#### Core Statistics (Pass 1)
|
|
213
|
+
These are computed in a single global aggregation pass using Ibis primitives.
|
|
214
|
+
|
|
215
|
+
| Metric | Calculation | Type |
|
|
216
|
+
| :--- | :--- | :--- |
|
|
217
|
+
| `n` | Total number of observations (rows) in the table. | All |
|
|
218
|
+
| `n_missing` | Count of `NULL` or `NaN` values. | All |
|
|
219
|
+
| `p_missing` | `n_missing / n` | All |
|
|
220
|
+
| `n_distinct` | Count of unique values (excluding `NULL`). Used for auto-categorical detection. | All |
|
|
221
|
+
| `p_distinct` | `n_distinct / n` | All |
|
|
222
|
+
| `count` | `n - n_missing` (Total non-missing values) | All |
|
|
223
|
+
| `mean` | `sum(x) / count` (NaNs treated as NULL) | Numeric |
|
|
224
|
+
| `std` | Sample standard deviation (Bessel's correction). | Numeric |
|
|
225
|
+
| `variance` | `std^2` | Numeric |
|
|
226
|
+
| `min` / `max` | Minimum and maximum values. | Numeric, DateTime |
|
|
227
|
+
| `n_zeros` | Count of values exactly equal to `0`. | Numeric |
|
|
228
|
+
| `n_negative` | Count of values `< 0`. | Numeric |
|
|
229
|
+
| `n_infinite` | Count of `+/- inf` values (Float only). | Numeric |
|
|
230
|
+
| `histogram` | Binned distribution (Numeric/DateTime) or Top Values (Categorical). | All |
|
|
231
|
+
|
|
232
|
+
#### Advanced Statistics (Pass 2)
|
|
233
|
+
To avoid "Nested Aggregation" errors in SQL backends, these are computed using values from Pass 1 as constants.
|
|
234
|
+
|
|
235
|
+
| Metric | Calculation | Logic |
|
|
236
|
+
| :--- | :--- | :--- |
|
|
237
|
+
| `skewness` | `mean( ((x - μ) / σ)^3 )` | Standardized 3rd moment. |
|
|
238
|
+
| `mad` | `mean( abs(x - μ) )` | Mean Absolute Deviation. |
|
|
239
|
+
| `n_duplicates` | `n - count(distinct_rows)` | Dataset-wide duplicate row count. |
|
|
240
|
+
|
|
241
|
+
#### Quantiles
|
|
242
|
+
Calculated via `col.quantile(p)`.
|
|
243
|
+
- `5%`, `25%` (Q1), `50%` (Median), `75%` (Q3), `95%`.
|
|
244
|
+
|
|
245
|
+
---
|
|
246
|
+
|
|
247
|
+
### 2. Alert Engine Logic
|
|
248
|
+
|
|
249
|
+
The built-in alert engine scans the calculated metrics and triggers warnings based on industry-standard thresholds (aligned with `ydata-profiling`).
|
|
250
|
+
|
|
251
|
+
| Alert Type | Logic / Threshold | Severity |
|
|
252
|
+
| :--- | :--- | :--- |
|
|
253
|
+
| **CONSTANT** | `n_distinct == 1` | warning |
|
|
254
|
+
| **UNIQUE** | `n_distinct == n` | warning |
|
|
255
|
+
| **HIGH_CARDINALITY** | `p_distinct > 0.5` (and not `UNIQUE`, Categorical only) | warning |
|
|
256
|
+
| **MISSING** | `p_missing > 0.05` | info |
|
|
257
|
+
| **ZEROS** | `p_zeros > 0.10` | info |
|
|
258
|
+
| **SKEWED** | `abs(skewness) > 10` | info |
|
|
259
|
+
**Suppression Rules:**
|
|
260
|
+
1. If a column is **CONSTANT**, all other alerts for that column are suppressed.
|
|
261
|
+
2. If a column is **UNIQUE**, the **HIGH_CARDINALITY** alert is suppressed.
|
|
@@ -0,0 +1,80 @@
|
|
|
1
|
+
[project]
|
|
2
|
+
name = "ibis-profiling"
|
|
3
|
+
dynamic = ["version"]
|
|
4
|
+
description = "Ultra-high-performance data profiling natively for Ibis"
|
|
5
|
+
readme = "README.md"
|
|
6
|
+
requires-python = ">=3.11"
|
|
7
|
+
license = { text = "MIT" }
|
|
8
|
+
authors = [
|
|
9
|
+
{ name = "David Beall", email = "6121439+beallio@users.noreply.github.com" },
|
|
10
|
+
]
|
|
11
|
+
classifiers = [
|
|
12
|
+
"Development Status :: 4 - Beta",
|
|
13
|
+
"Intended Audience :: Science/Research",
|
|
14
|
+
"Intended Audience :: Developers",
|
|
15
|
+
"License :: OSI Approved :: MIT License",
|
|
16
|
+
"Programming Language :: Python :: 3",
|
|
17
|
+
"Programming Language :: Python :: 3.11",
|
|
18
|
+
"Programming Language :: Python :: 3.12",
|
|
19
|
+
"Topic :: Scientific/Engineering :: Information Analysis",
|
|
20
|
+
"Topic :: Database",
|
|
21
|
+
]
|
|
22
|
+
keywords = ["ibis", "profiling", "eda", "data-analysis", "sql", "duckdb", "polars", "pandas"]
|
|
23
|
+
dependencies = [
|
|
24
|
+
"duckdb>=1.5.0",
|
|
25
|
+
"fastexcel>=0.11.5",
|
|
26
|
+
"ibis-framework>=12.0.0",
|
|
27
|
+
"pandas>=2.3.3",
|
|
28
|
+
"polars>=1.38.1",
|
|
29
|
+
"pyarrow>=23.0.1",
|
|
30
|
+
"pyarrow-hotfix>=0.7",
|
|
31
|
+
"pydantic>=2.12.5",
|
|
32
|
+
]
|
|
33
|
+
|
|
34
|
+
[project.urls]
|
|
35
|
+
Homepage = "https://github.com/beallio/ibis-profiling"
|
|
36
|
+
Repository = "https://github.com/beallio/ibis-profiling"
|
|
37
|
+
Issues = "https://github.com/beallio/ibis-profiling/issues"
|
|
38
|
+
|
|
39
|
+
[tool.hatch.version]
|
|
40
|
+
source = "vcs"
|
|
41
|
+
|
|
42
|
+
[tool.hatch.build.targets.wheel]
|
|
43
|
+
packages = ["src/ibis_profiling"]
|
|
44
|
+
|
|
45
|
+
[tool.hatch.build.targets.sdist]
|
|
46
|
+
include = [
|
|
47
|
+
"src/ibis_profiling",
|
|
48
|
+
"README.md",
|
|
49
|
+
"LICENSE",
|
|
50
|
+
]
|
|
51
|
+
|
|
52
|
+
[build-system]
|
|
53
|
+
requires = ["hatchling", "hatch-vcs"]
|
|
54
|
+
build-backend = "hatchling.build"
|
|
55
|
+
|
|
56
|
+
[tool.uv]
|
|
57
|
+
cache-dir = "/tmp/ibis-profiling/.uv_cache"
|
|
58
|
+
|
|
59
|
+
[tool.ruff]
|
|
60
|
+
line-length = 100
|
|
61
|
+
cache-dir = "/tmp/ibis-profiling/.ruff_cache"
|
|
62
|
+
|
|
63
|
+
[tool.pytest.ini_options]
|
|
64
|
+
addopts = "--cov=src --cov-report=term"
|
|
65
|
+
cache_dir = "/tmp/ibis-profiling/.pytest_cache"
|
|
66
|
+
pythonpath = ["src"]
|
|
67
|
+
|
|
68
|
+
[tool.coverage.run]
|
|
69
|
+
data_file = "/tmp/ibis-profiling/.coverage"
|
|
70
|
+
|
|
71
|
+
[dependency-groups]
|
|
72
|
+
dev = [
|
|
73
|
+
"faker>=40.8.0",
|
|
74
|
+
"openpyxl>=3.1.5",
|
|
75
|
+
"playwright>=1.58.0",
|
|
76
|
+
"pytest>=9.0.2",
|
|
77
|
+
"pytest-cov>=7.0.0",
|
|
78
|
+
"xlsxwriter>=3.2.9",
|
|
79
|
+
"ydata-profiling>=4.18.1",
|
|
80
|
+
]
|