huevat 0.1.0__tar.gz
This diff represents the content of publicly available package versions that have been released to one of the supported registries. The information contained in this diff is provided for informational purposes only and reflects changes between package versions as they appear in their respective public registries.
- huevat-0.1.0/.python-version +1 -0
- huevat-0.1.0/LICENSE +22 -0
- huevat-0.1.0/MANIFEST.in +13 -0
- huevat-0.1.0/PKG-INFO +216 -0
- huevat-0.1.0/README.md +168 -0
- huevat-0.1.0/docs/API.md +100 -0
- huevat-0.1.0/docs/FIGURE_DOCTOR.md +83 -0
- huevat-0.1.0/docs/METHODS_CATEGORICAL_V2.md +116 -0
- huevat-0.1.0/docs/METHODS_H1.md +132 -0
- huevat-0.1.0/docs/METHODS_H2.md +191 -0
- huevat-0.1.0/docs/METHODS_H3.md +137 -0
- huevat-0.1.0/docs/METHODS_H4A.md +211 -0
- huevat-0.1.0/docs/METHODS_H4B.md +206 -0
- huevat-0.1.0/docs/METHODS_H4C.md +77 -0
- huevat-0.1.0/docs/METHODS_H4D.md +56 -0
- huevat-0.1.0/docs/QUICKSTART.md +124 -0
- huevat-0.1.0/docs/REFERENCES_H1.md +72 -0
- huevat-0.1.0/docs/RELEASE.md +96 -0
- huevat-0.1.0/docs/RELEASE_NOTES.md +22 -0
- huevat-0.1.0/docs/SOURCES.md +87 -0
- huevat-0.1.0/docs/extraction.json +36 -0
- huevat-0.1.0/docs/images/gradient-bins.png +0 -0
- huevat-0.1.0/docs/images/gradients.png +0 -0
- huevat-0.1.0/docs/images/palettes.png +0 -0
- huevat-0.1.0/examples/README.md +96 -0
- huevat-0.1.0/examples/gallery.py +72 -0
- huevat-0.1.0/examples/quickstart.py +48 -0
- huevat-0.1.0/licenses/colorbrewer-Apache-2.0.txt +201 -0
- huevat-0.1.0/licenses/colorcet-CC-BY-4.0.txt +250 -0
- huevat-0.1.0/licenses/colorspacious-MIT.txt +19 -0
- huevat-0.1.0/licenses/matplotlib-LICENSE.txt +1253 -0
- huevat-0.1.0/licenses/sketchplot-MIT.txt +21 -0
- huevat-0.1.0/pyproject.toml +58 -0
- huevat-0.1.0/setup.cfg +4 -0
- huevat-0.1.0/src/huevat/__init__.py +59 -0
- huevat-0.1.0/src/huevat/_certify.py +138 -0
- huevat-0.1.0/src/huevat/_collection_design.py +138 -0
- huevat-0.1.0/src/huevat/_collection_specs.py +91 -0
- huevat-0.1.0/src/huevat/_data.py +15 -0
- huevat-0.1.0/src/huevat/_discrete.py +78 -0
- huevat-0.1.0/src/huevat/_prepared.py +91 -0
- huevat-0.1.0/src/huevat/_sampling_design.py +163 -0
- huevat-0.1.0/src/huevat/_version.py +3 -0
- huevat-0.1.0/src/huevat/adapters/__init__.py +1 -0
- huevat-0.1.0/src/huevat/adapters/_common.py +135 -0
- huevat-0.1.0/src/huevat/adapters/matplotlib.py +67 -0
- huevat-0.1.0/src/huevat/adapters/plotly.py +62 -0
- huevat-0.1.0/src/huevat/adapters/ultraplot.py +42 -0
- huevat-0.1.0/src/huevat/catalog.py +97 -0
- huevat-0.1.0/src/huevat/categorical.py +106 -0
- huevat-0.1.0/src/huevat/data/categorical-v2.json +1 -0
- huevat-0.1.0/src/huevat/data/collection-v1.json +1 -0
- huevat-0.1.0/src/huevat/data/families-v1.json +1 -0
- huevat-0.1.0/src/huevat/data/machado-v1.json +1 -0
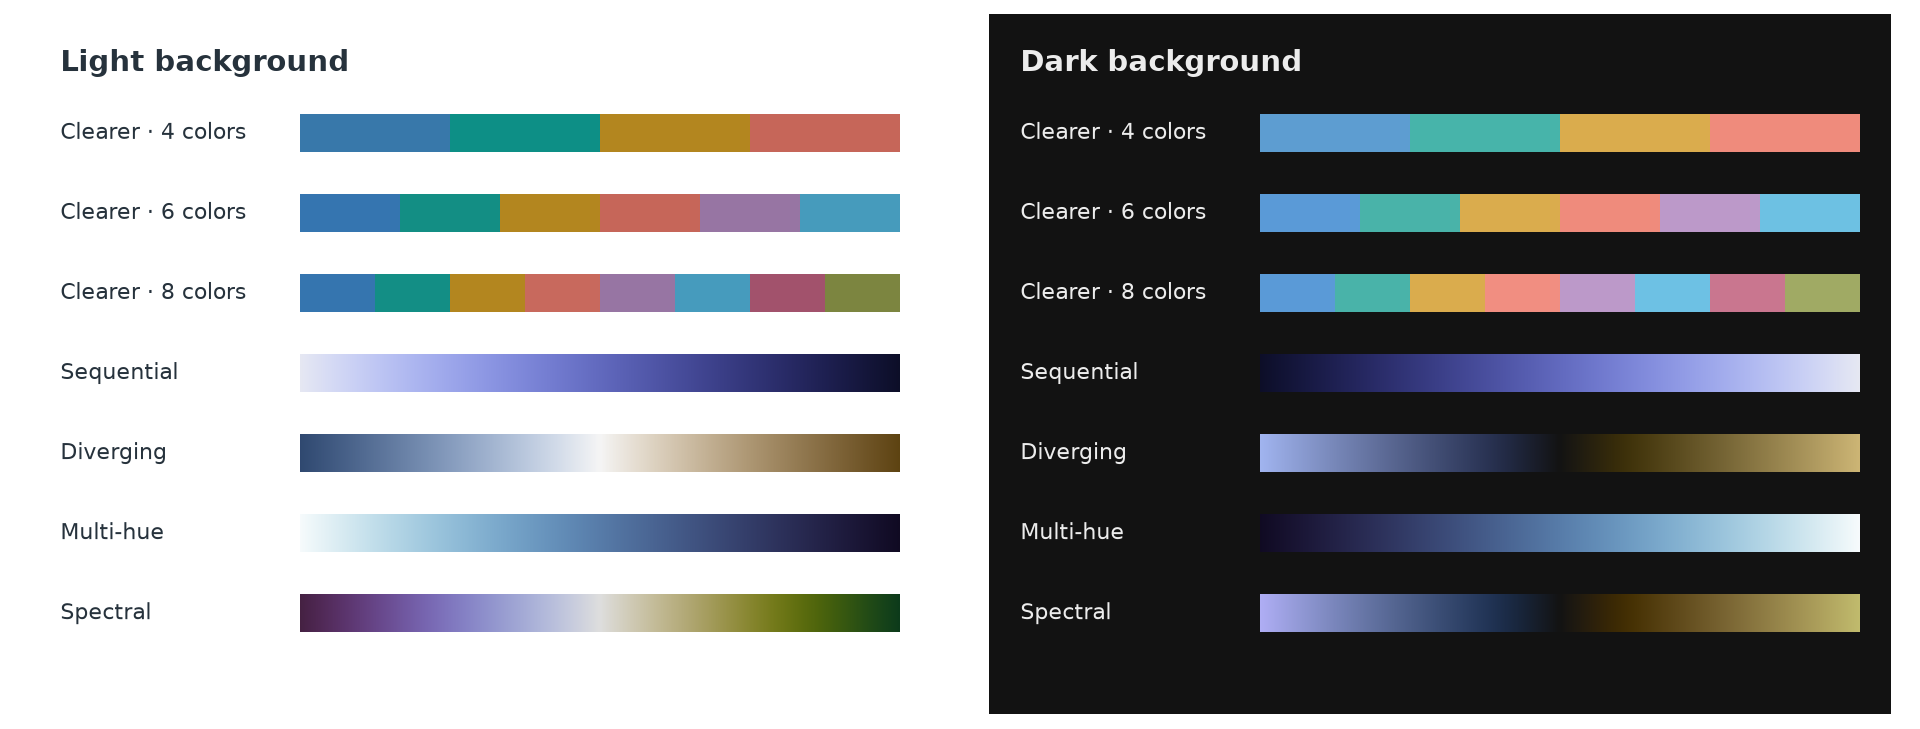
- huevat-0.1.0/src/huevat/data/manifest-v1.json +1 -0
- huevat-0.1.0/src/huevat/data/ordered-v1.json +1 -0
- huevat-0.1.0/src/huevat/data/profiles-v1.json +1 -0
- huevat-0.1.0/src/huevat/data/references-v1.json +1 -0
- huevat-0.1.0/src/huevat/data/release-v1.json +1 -0
- huevat-0.1.0/src/huevat/design.py +335 -0
- huevat-0.1.0/src/huevat/design_categorical.py +152 -0
- huevat-0.1.0/src/huevat/design_h3.py +377 -0
- huevat-0.1.0/src/huevat/doctor/__init__.py +193 -0
- huevat-0.1.0/src/huevat/doctor/_audit.py +115 -0
- huevat-0.1.0/src/huevat/doctor/_backends.py +518 -0
- huevat-0.1.0/src/huevat/doctor/_search.py +131 -0
- huevat-0.1.0/src/huevat/evaluation.py +267 -0
- huevat-0.1.0/src/huevat/exports.py +217 -0
- huevat-0.1.0/src/huevat/families.py +212 -0
- huevat-0.1.0/src/huevat/gradients.py +331 -0
- huevat-0.1.0/src/huevat/library.py +78 -0
- huevat-0.1.0/src/huevat/references.py +94 -0
- huevat-0.1.0/src/huevat/sampling.py +149 -0
- huevat-0.1.0/src/huevat/space.py +134 -0
- huevat-0.1.0/src/huevat/study.py +110 -0
- huevat-0.1.0/src/huevat/vision.py +50 -0
- huevat-0.1.0/src/huevat.egg-info/PKG-INFO +216 -0
- huevat-0.1.0/src/huevat.egg-info/SOURCES.txt +83 -0
- huevat-0.1.0/src/huevat.egg-info/dependency_links.txt +1 -0
- huevat-0.1.0/src/huevat.egg-info/requires.txt +21 -0
- huevat-0.1.0/src/huevat.egg-info/top_level.txt +1 -0
- huevat-0.1.0/tests/test_core.py +42 -0
- huevat-0.1.0/tests/test_doctor.py +376 -0
- huevat-0.1.0/tests/test_release.py +296 -0
- huevat-0.1.0/tests/test_space.py +115 -0
|
@@ -0,0 +1 @@
|
|
|
1
|
+
3.12
|
huevat-0.1.0/LICENSE
ADDED
|
@@ -0,0 +1,22 @@
|
|
|
1
|
+
MIT License
|
|
2
|
+
|
|
3
|
+
Copyright (c) 2026 Huevat contributors
|
|
4
|
+
Copyright (c) 2026 sketchplot contributors
|
|
5
|
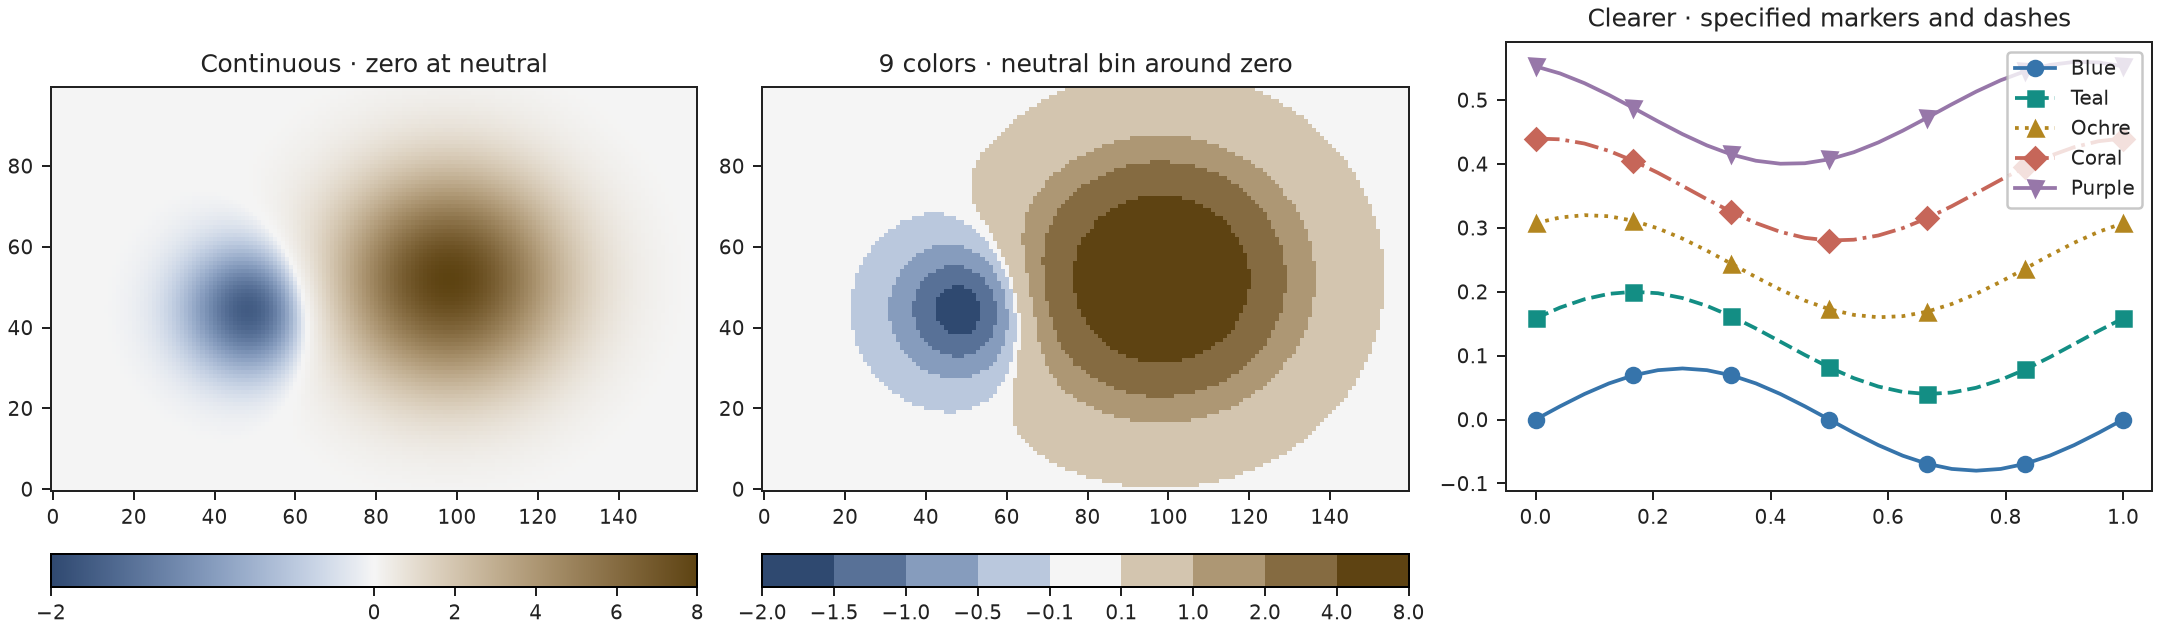
+
|
|
6
|
+
Permission is hereby granted, free of charge, to any person obtaining a copy
|
|
7
|
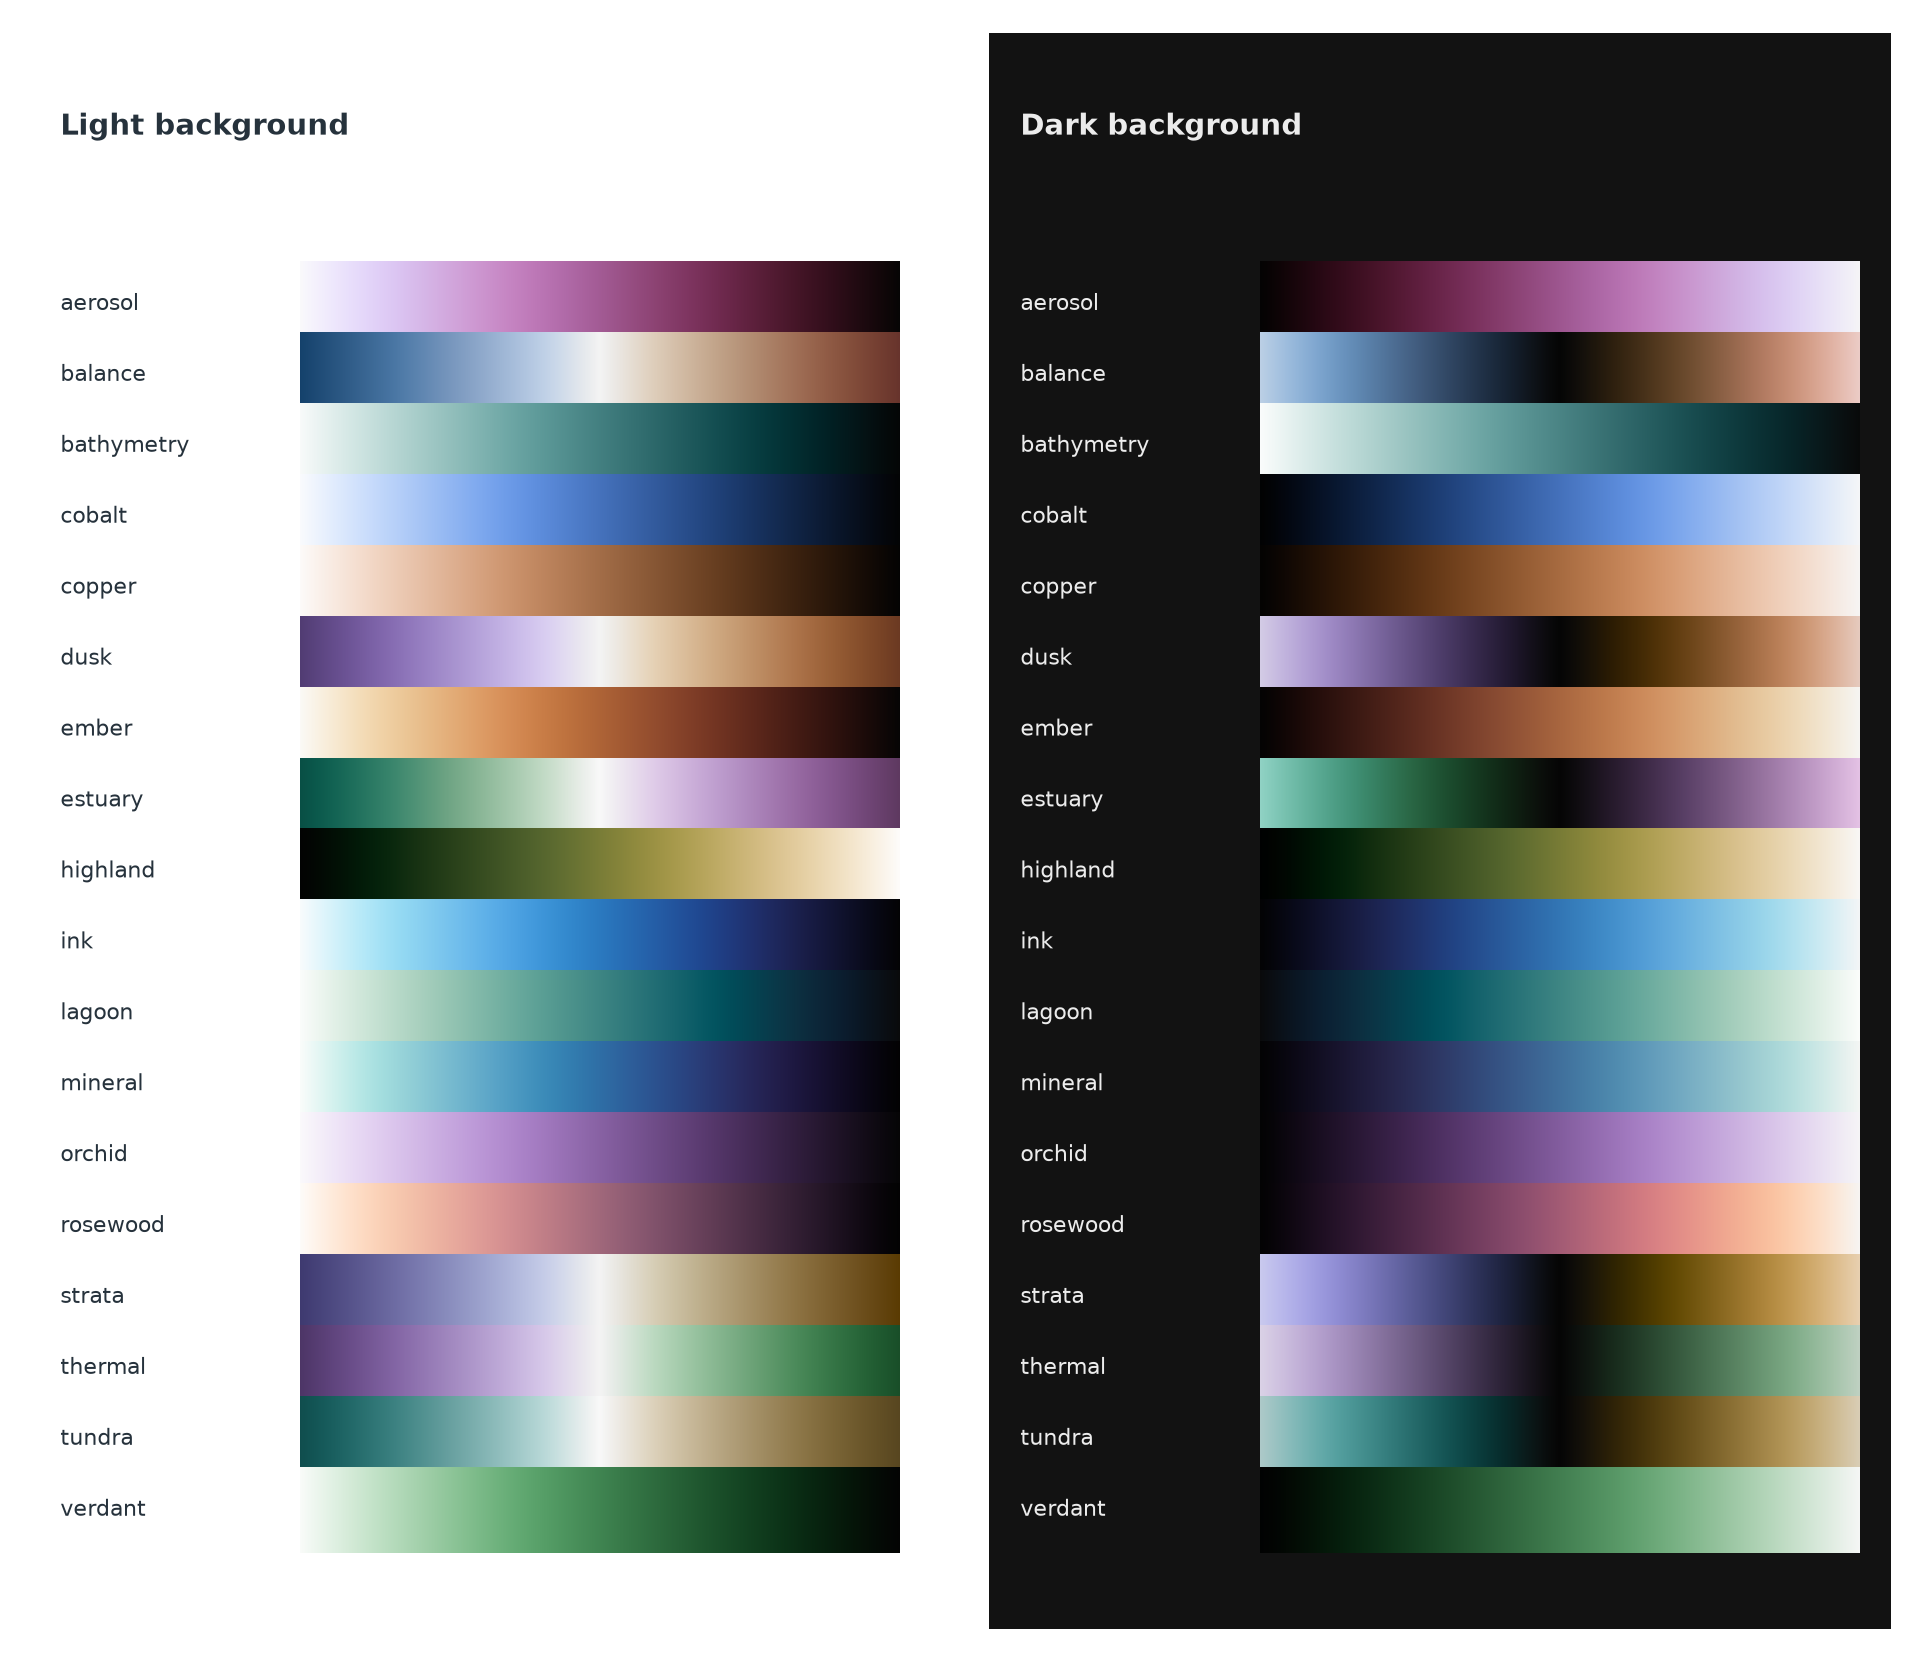
+
of this software and associated documentation files (the "Software"), to deal
|
|
8
|
+
in the Software without restriction, including without limitation the rights
|
|
9
|
+
to use, copy, modify, merge, publish, distribute, sublicense, and/or sell
|
|
10
|
+
copies of the Software, and to permit persons to whom the Software is
|
|
11
|
+
furnished to do so, subject to the following conditions:
|
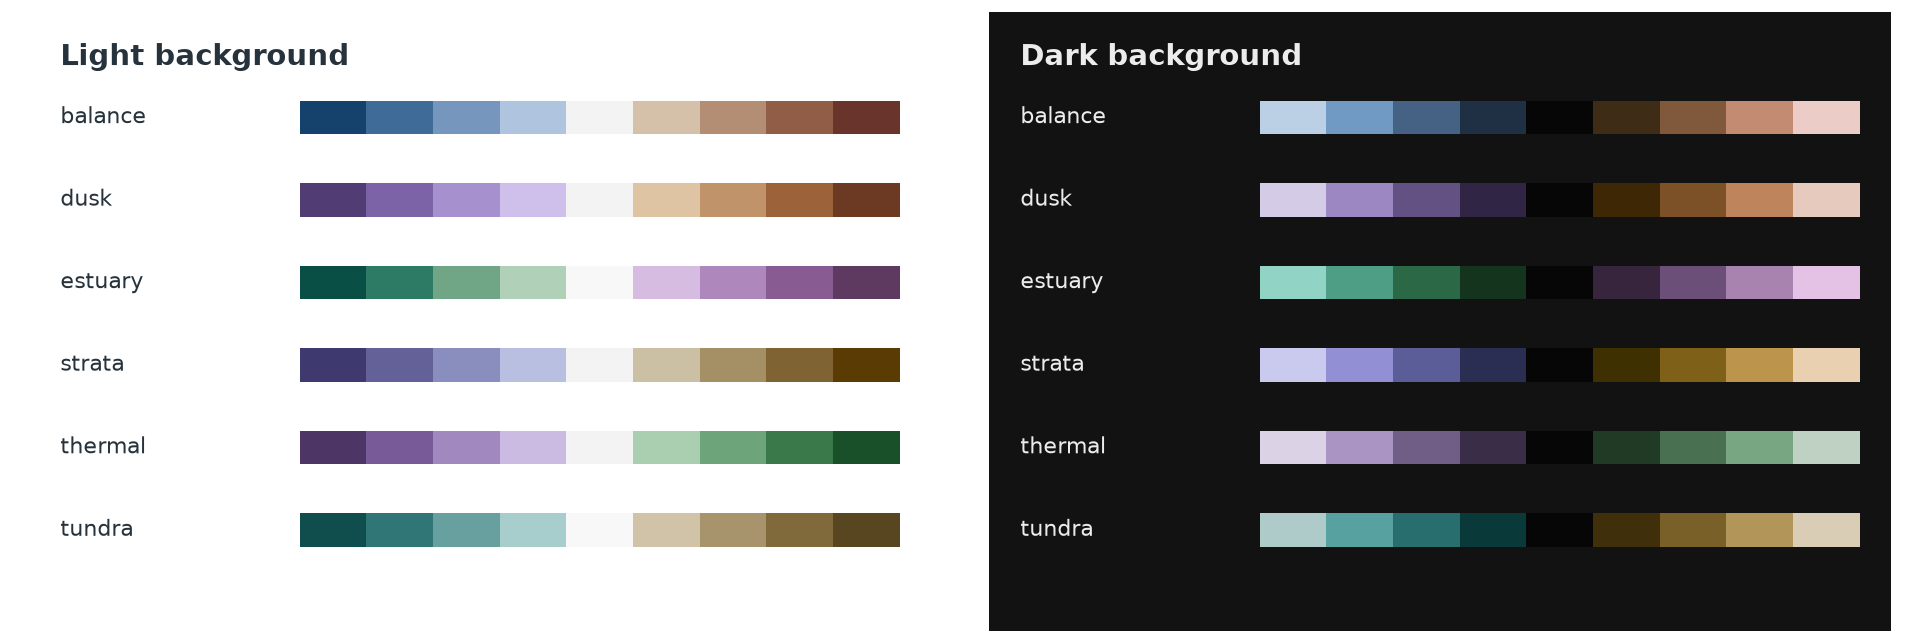
|
12
|
+
|
|
13
|
+
The above copyright notice and this permission notice shall be included in all
|
|
14
|
+
copies or substantial portions of the Software.
|
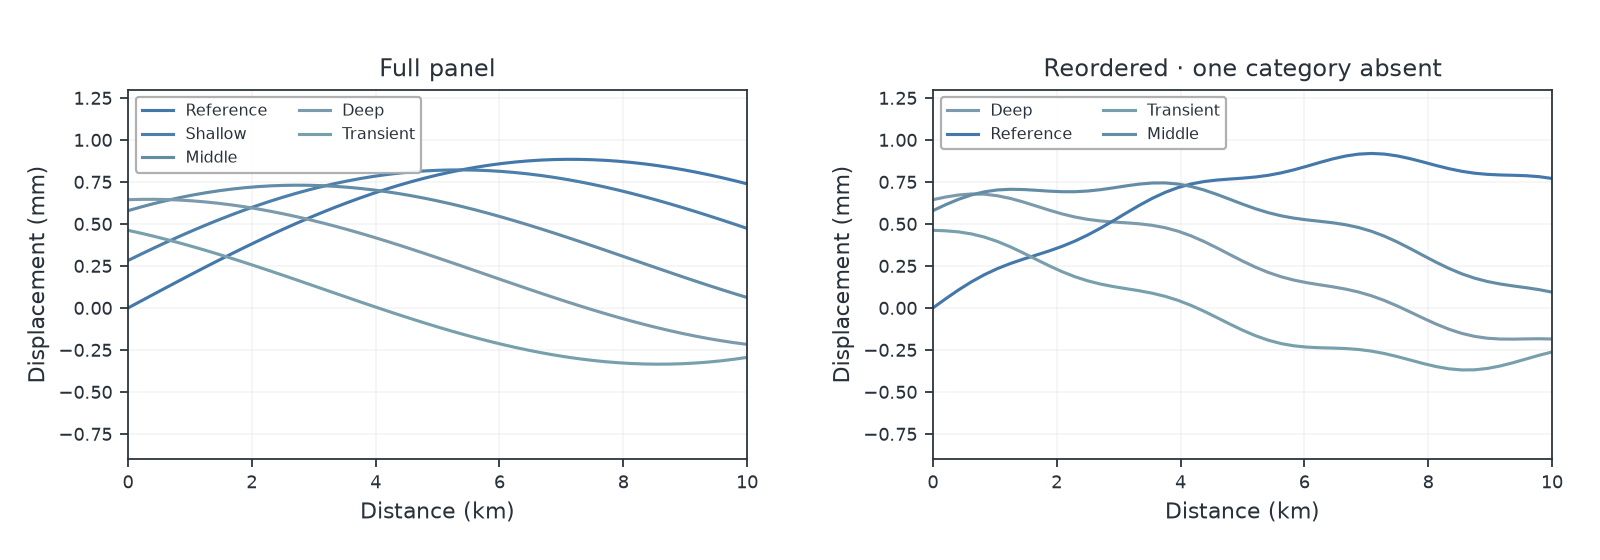
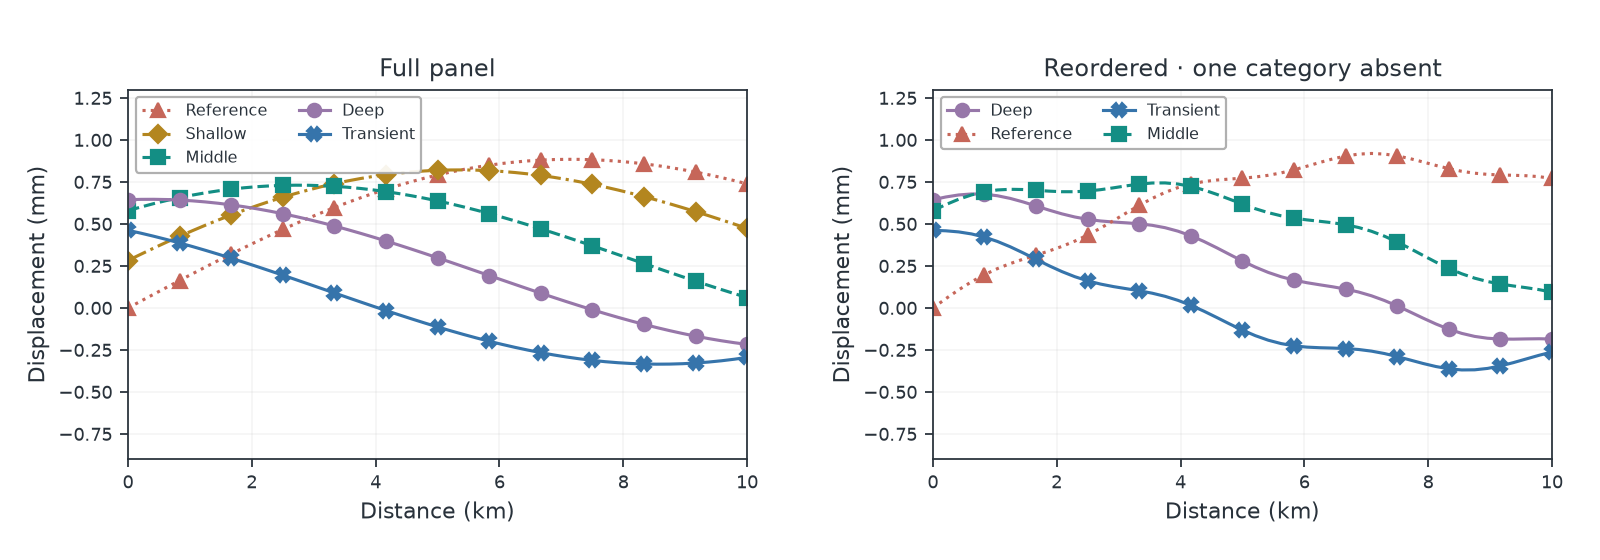
|
15
|
+
|
|
16
|
+
THE SOFTWARE IS PROVIDED "AS IS", WITHOUT WARRANTY OF ANY KIND, EXPRESS OR
|
|
17
|
+
IMPLIED, INCLUDING BUT NOT LIMITED TO THE WARRANTIES OF MERCHANTABILITY,
|
|
18
|
+
FITNESS FOR A PARTICULAR PURPOSE AND NONINFRINGEMENT. IN NO EVENT SHALL THE
|
|
19
|
+
AUTHORS OR COPYRIGHT HOLDERS BE LIABLE FOR ANY CLAIM, DAMAGES OR OTHER
|
|
20
|
+
LIABILITY, WHETHER IN AN ACTION OF CONTRACT, TORT OR OTHERWISE, ARISING FROM,
|
|
21
|
+
OUT OF OR IN CONNECTION WITH THE SOFTWARE OR THE USE OR OTHER DEALINGS IN THE
|
|
22
|
+
SOFTWARE.
|
huevat-0.1.0/MANIFEST.in
ADDED
|
@@ -0,0 +1,13 @@
|
|
|
1
|
+
exclude project_plan.md
|
|
2
|
+
exclude uv.lock
|
|
3
|
+
recursive-include docs *.md *.json *.png
|
|
4
|
+
exclude docs/PACKAGING_AUDIT.md
|
|
5
|
+
recursive-include licenses *.txt
|
|
6
|
+
prune tests
|
|
7
|
+
prune tools
|
|
8
|
+
include tests/test_core.py tests/test_space.py tests/test_release.py tests/test_doctor.py
|
|
9
|
+
recursive-include examples *.py *.md
|
|
10
|
+
prune research
|
|
11
|
+
prune artifacts
|
|
12
|
+
recursive-include src/huevat/data *.json
|
|
13
|
+
include .python-version
|
huevat-0.1.0/PKG-INFO
ADDED
|
@@ -0,0 +1,216 @@
|
|
|
1
|
+
Metadata-Version: 2.4
|
|
2
|
+
Name: huevat
|
|
3
|
+
Version: 0.1.0
|
|
4
|
+
Summary: Screened scientific palettes, gradients and coordinated figure styles
|
|
5
|
+
Author-email: Clay Wood <clayewood@gmail.com>
|
|
6
|
+
Maintainer-email: Clay Wood <clayewood@gmail.com>
|
|
7
|
+
License-Expression: MIT
|
|
8
|
+
Project-URL: Homepage, https://pypi.org/project/huevat/
|
|
9
|
+
Project-URL: Source, https://github.com/clay-wood/huevat
|
|
10
|
+
Project-URL: Documentation, https://github.com/clay-wood/huevat/blob/main/docs/QUICKSTART.md
|
|
11
|
+
Project-URL: Issues, https://github.com/clay-wood/huevat/issues
|
|
12
|
+
Project-URL: Changelog, https://github.com/clay-wood/huevat/blob/main/docs/RELEASE_NOTES.md
|
|
13
|
+
Keywords: color,colormap,palette,scientific-visualization,matplotlib,plotly
|
|
14
|
+
Classifier: Intended Audience :: Science/Research
|
|
15
|
+
Classifier: Topic :: Scientific/Engineering :: Visualization
|
|
16
|
+
Classifier: Operating System :: OS Independent
|
|
17
|
+
Classifier: Programming Language :: Python :: 3 :: Only
|
|
18
|
+
Classifier: Programming Language :: Python :: 3.10
|
|
19
|
+
Classifier: Programming Language :: Python :: 3.11
|
|
20
|
+
Classifier: Programming Language :: Python :: 3.12
|
|
21
|
+
Classifier: Programming Language :: Python :: 3.13
|
|
22
|
+
Classifier: Programming Language :: Python :: 3.14
|
|
23
|
+
Requires-Python: >=3.10
|
|
24
|
+
Description-Content-Type: text/markdown
|
|
25
|
+
License-File: LICENSE
|
|
26
|
+
License-File: licenses/colorbrewer-Apache-2.0.txt
|
|
27
|
+
License-File: licenses/colorcet-CC-BY-4.0.txt
|
|
28
|
+
License-File: licenses/colorspacious-MIT.txt
|
|
29
|
+
License-File: licenses/matplotlib-LICENSE.txt
|
|
30
|
+
License-File: licenses/sketchplot-MIT.txt
|
|
31
|
+
Provides-Extra: design
|
|
32
|
+
Requires-Dist: numpy>=1.24; extra == "design"
|
|
33
|
+
Requires-Dist: scipy>=1.10; extra == "design"
|
|
34
|
+
Requires-Dist: colorspacious==1.1.2; extra == "design"
|
|
35
|
+
Provides-Extra: research
|
|
36
|
+
Requires-Dist: numpy>=1.24; extra == "research"
|
|
37
|
+
Requires-Dist: scipy>=1.10; extra == "research"
|
|
38
|
+
Requires-Dist: matplotlib>=3.8; extra == "research"
|
|
39
|
+
Requires-Dist: colorspacious==1.1.2; extra == "research"
|
|
40
|
+
Requires-Dist: colorcet==3.2.1; extra == "research"
|
|
41
|
+
Provides-Extra: matplotlib
|
|
42
|
+
Requires-Dist: matplotlib>=3.9; extra == "matplotlib"
|
|
43
|
+
Provides-Extra: plotly
|
|
44
|
+
Requires-Dist: plotly<8,>=6; extra == "plotly"
|
|
45
|
+
Provides-Extra: ultraplot
|
|
46
|
+
Requires-Dist: ultraplot<3,>=2.7; extra == "ultraplot"
|
|
47
|
+
Dynamic: license-file
|
|
48
|
+
|
|
49
|
+
# Huevat
|
|
50
|
+
|
|
51
|
+
Scientific color palettes and gradients for **Matplotlib, Plotly and UltraPlot**.
|
|
52
|
+
Choose colors for categories, continuous fields, or values above and below a center.
|
|
53
|
+
|
|
54
|
+
|
|
55
|
+
|
|
56
|
+
Clearer is the default categorical palette. Use `background="dark"` for dark figures.
|
|
57
|
+
|
|
58
|
+
[Quick start](https://github.com/clay-wood/huevat/blob/main/docs/QUICKSTART.md) · [Plotting examples](https://github.com/clay-wood/huevat/blob/main/examples/README.md) ·
|
|
59
|
+
[Figure doctor](https://github.com/clay-wood/huevat/blob/main/docs/FIGURE_DOCTOR.md) · [API guide](https://github.com/clay-wood/huevat/blob/main/docs/API.md) ·
|
|
60
|
+
[Release notes](https://github.com/clay-wood/huevat/blob/main/docs/RELEASE_NOTES.md)
|
|
61
|
+
|
|
62
|
+
## Recent updates
|
|
63
|
+
|
|
64
|
+
- **18 named gradients**, including six new choices: **Cobalt, Copper, Dusk,
|
|
65
|
+
Orchid, Tundra and Verdant**, each with light and dark versions.
|
|
66
|
+
- **Revised Aerosol, Bathymetry and Thermal** to distinguish the reported
|
|
67
|
+
lookalike routes. Earlier versions remain available through their saved
|
|
68
|
+
recipes and immutable design IDs.
|
|
69
|
+
- **Nine colors by default** with `gradient.discrete()`. Diverging and Spectral
|
|
70
|
+
gradients include the exact neutral as the fifth color. Explicit even counts
|
|
71
|
+
are supported and omit the midpoint.
|
|
72
|
+
- **Named suffixes:** `_r` reverses, `_d` selects dark, and `_d_r` or `_r_d`
|
|
73
|
+
combines both.
|
|
74
|
+
|
|
75
|
+
All eighteen named gradients are supported. Numerical screening results and
|
|
76
|
+
usage guidance are available in the methods documentation.
|
|
77
|
+
See the [release notes](https://github.com/clay-wood/huevat/blob/main/docs/RELEASE_NOTES.md)
|
|
78
|
+
and [installation and release guide](https://github.com/clay-wood/huevat/blob/main/docs/RELEASE.md).
|
|
79
|
+
|
|
80
|
+
## Install
|
|
81
|
+
|
|
82
|
+
Install Huevat from PyPI with your plotting library:
|
|
83
|
+
|
|
84
|
+
```sh
|
|
85
|
+
python -m pip install "huevat[matplotlib]"
|
|
86
|
+
python -m pip install "huevat[plotly]"
|
|
87
|
+
python -m pip install "huevat[ultraplot]"
|
|
88
|
+
```
|
|
89
|
+
|
|
90
|
+
Requires Python 3.10+. For colors alone, use `python -m pip install huevat`.
|
|
91
|
+
|
|
92
|
+
## Make a plot
|
|
93
|
+
|
|
94
|
+
```python
|
|
95
|
+
import numpy as np
|
|
96
|
+
import matplotlib.pyplot as plt
|
|
97
|
+
import huevat as hv
|
|
98
|
+
from huevat.adapters import matplotlib as hmpl
|
|
99
|
+
|
|
100
|
+
xx, yy = np.meshgrid(np.linspace(-3, 3, 160), np.linspace(-2, 2, 100))
|
|
101
|
+
field = (8 * np.exp(-((xx - .7)**2 + (yy - .1)**2))
|
|
102
|
+
- 2 * np.exp(-((xx + 1.1)**2 + (yy + .2)**2) / .4))
|
|
103
|
+
gradient = hv.diverging()
|
|
104
|
+
nine_colors = gradient.discrete() # default: 9, including the neutral midpoint
|
|
105
|
+
boundaries = [-2, -1.5, -1, -.5, -.1, .1, 1, 2, 4, 8]
|
|
106
|
+
palette = hv.categorical(5)
|
|
107
|
+
|
|
108
|
+
fig, axes = plt.subplots(1, 3, figsize=(12, 3.5), layout="constrained")
|
|
109
|
+
continuous = axes[0].imshow(field, cmap=hmpl.colormap(gradient), origin="lower",
|
|
110
|
+
norm=hmpl.normalizer(-2, 8, center=0))
|
|
111
|
+
discrete = axes[1].imshow(field, cmap=hmpl.colormap(nine_colors), origin="lower",
|
|
112
|
+
norm=hmpl.boundary_normalizer(nine_colors, boundaries))
|
|
113
|
+
axes[0].set_title("Continuous · zero at neutral")
|
|
114
|
+
axes[1].set_title("9 colors · neutral bin around zero")
|
|
115
|
+
fig.colorbar(continuous, ax=axes[0], orientation="horizontal")
|
|
116
|
+
fig.colorbar(discrete, ax=axes[1], orientation="horizontal")
|
|
117
|
+
|
|
118
|
+
axes[2].set_prop_cycle(hmpl.cycle(palette, markers=["o", "s", "^", "D", "v"],
|
|
119
|
+
linestyles=["-", "--", ":", "-.", "-"]))
|
|
120
|
+
x = np.linspace(0, 1, 25)
|
|
121
|
+
for i, label in enumerate(["Blue", "Teal", "Ochre", "Coral", "Purple"]):
|
|
122
|
+
axes[2].plot(x, .12 * i + .08 * np.sin(2 * np.pi * x + i / 2),
|
|
123
|
+
label=label, markevery=4)
|
|
124
|
+
axes[2].set_title("Clearer · specified markers and dashes")
|
|
125
|
+
axes[2].legend(fontsize=8, loc="upper right")
|
|
126
|
+
plt.show()
|
|
127
|
+
```
|
|
128
|
+
|
|
129
|
+
For a field, pass `hmpl.colormap(hv.sequential())` to `imshow` or `pcolormesh`.
|
|
130
|
+
Use `hv.diverging()` with `hmpl.normalizer(vmin, vmax, center=0)` for signed data.
|
|
131
|
+
The discrete example uses nine colors, with zero inside the neutral bin
|
|
132
|
+
from −0.1 to +0.1. Choose bin boundaries to suit your data.
|
|
133
|
+
|
|
134
|
+
|
|
135
|
+
|
|
136
|
+
[See complete examples for all three plotting libraries.](https://github.com/clay-wood/huevat/blob/main/examples/README.md)
|
|
137
|
+
|
|
138
|
+
## More gradients
|
|
139
|
+
|
|
140
|
+
Eighteen additional gradients cover general plots, seismic data, terrain, depth,
|
|
141
|
+
and atmospheric fields, with supported light and dark variants.
|
|
142
|
+
|
|
143
|
+
|
|
144
|
+
|
|
145
|
+
```python
|
|
146
|
+
gradient = hv.gradient("bathymetry")
|
|
147
|
+
new_gradient = hv.gradient("verdant")
|
|
148
|
+
reversed_gradient = hv.gradient("thermal_r")
|
|
149
|
+
dark_gradient = hv.gradient("thermal_d")
|
|
150
|
+
dark_reversed_gradient = hv.gradient("thermal_d_r")
|
|
151
|
+
print(hv.gradient_names())
|
|
152
|
+
```
|
|
153
|
+
|
|
154
|
+
The revised routes are:
|
|
155
|
+
|
|
156
|
+
| Gradient | Current route | Previously similar to |
|
|
157
|
+
| --- | --- | --- |
|
|
158
|
+
| Aerosol | Deep red → magenta → pale violet | Rosewood |
|
|
159
|
+
| Bathymetry | Pale cyan → turquoise → deep ocean, darkening with depth | Mineral |
|
|
160
|
+
| Thermal | Violet → neutral → green | Balance |
|
|
161
|
+
|
|
162
|
+
Append `_r` to reverse a named gradient or `_d` to select its dark version;
|
|
163
|
+
combine them as `_d_r` or `_r_d`. `gradient.reversed()` also changes direction.
|
|
164
|
+
`_d` is equivalent to `background="dark"`; combining it with an explicit
|
|
165
|
+
`background="light"` is an error.
|
|
166
|
+
|
|
167
|
+
For separate colors, `gradient.discrete()` selects nine bins. Diverging scales
|
|
168
|
+
include their neutral midpoint; explicit even counts remain available.
|
|
169
|
+
|
|
170
|
+
```python
|
|
171
|
+
signed = hv.diverging()
|
|
172
|
+
nine_colors = signed.discrete() # neutral is nine_colors.colors[4]
|
|
173
|
+
assert nine_colors.colors[4] == hv.to_hex(signed.at(0.5))
|
|
174
|
+
```
|
|
175
|
+
|
|
176
|
+
Check `hv.known_counts(gradient)` for tested counts.
|
|
177
|
+
`hv.optimized_discrete(gradient, n)` searches for better-spaced colors and
|
|
178
|
+
requires the `design` extra.
|
|
179
|
+
|
|
180
|
+
|
|
181
|
+
|
|
182
|
+
## Figure doctor
|
|
183
|
+
|
|
184
|
+
Coordinate colors, markers and dashes in an existing figure. Repeated labels
|
|
185
|
+
keep the same style across panels.
|
|
186
|
+
|
|
187
|
+
| Before | After |
|
|
188
|
+
| --- | --- |
|
|
189
|
+
|  |  |
|
|
190
|
+
|
|
191
|
+
Install with `python -m pip install "huevat[design,matplotlib]"`, or replace
|
|
192
|
+
`matplotlib` with `plotly` or `ultraplot`.
|
|
193
|
+
|
|
194
|
+
```python
|
|
195
|
+
from huevat import doctor
|
|
196
|
+
|
|
197
|
+
scene = doctor.inspect(fig)
|
|
198
|
+
closer, separation, simple = doctor.propose(scene)
|
|
199
|
+
preview = doctor.preview(fig, separation)
|
|
200
|
+
change = doctor.apply(fig, separation)
|
|
201
|
+
change.undo()
|
|
202
|
+
```
|
|
203
|
+
|
|
204
|
+
[Figure doctor guide](https://github.com/clay-wood/huevat/blob/main/docs/FIGURE_DOCTOR.md) explains previews, fixed colors and
|
|
205
|
+
keeping styles across figures. Review the result at the size you intend to use.
|
|
206
|
+
|
|
207
|
+
## Save colors
|
|
208
|
+
|
|
209
|
+
```python
|
|
210
|
+
hv.export(palette).write("palette.json")
|
|
211
|
+
restored = hv.load_export(open("palette.json", encoding="utf-8").read()).design
|
|
212
|
+
hv.export(hv.diverging(), n=7, format="csv").write("colors.csv")
|
|
213
|
+
```
|
|
214
|
+
|
|
215
|
+
JSON saves a design for reuse. CSV and hex give you color lists; CSS is also
|
|
216
|
+
available. See the [quick start](https://github.com/clay-wood/huevat/blob/main/docs/QUICKSTART.md) for labels and more examples.
|
huevat-0.1.0/README.md
ADDED
|
@@ -0,0 +1,168 @@
|
|
|
1
|
+
# Huevat
|
|
2
|
+
|
|
3
|
+
Scientific color palettes and gradients for **Matplotlib, Plotly and UltraPlot**.
|
|
4
|
+
Choose colors for categories, continuous fields, or values above and below a center.
|
|
5
|
+
|
|
6
|
+

|
|
7
|
+
|
|
8
|
+
Clearer is the default categorical palette. Use `background="dark"` for dark figures.
|
|
9
|
+
|
|
10
|
+
[Quick start](https://github.com/clay-wood/huevat/blob/main/docs/QUICKSTART.md) · [Plotting examples](https://github.com/clay-wood/huevat/blob/main/examples/README.md) ·
|
|
11
|
+
[Figure doctor](https://github.com/clay-wood/huevat/blob/main/docs/FIGURE_DOCTOR.md) · [API guide](https://github.com/clay-wood/huevat/blob/main/docs/API.md) ·
|
|
12
|
+
[Release notes](https://github.com/clay-wood/huevat/blob/main/docs/RELEASE_NOTES.md)
|
|
13
|
+
|
|
14
|
+
## Recent updates
|
|
15
|
+
|
|
16
|
+
- **18 named gradients**, including six new choices: **Cobalt, Copper, Dusk,
|
|
17
|
+
Orchid, Tundra and Verdant**, each with light and dark versions.
|
|
18
|
+
- **Revised Aerosol, Bathymetry and Thermal** to distinguish the reported
|
|
19
|
+
lookalike routes. Earlier versions remain available through their saved
|
|
20
|
+
recipes and immutable design IDs.
|
|
21
|
+
- **Nine colors by default** with `gradient.discrete()`. Diverging and Spectral
|
|
22
|
+
gradients include the exact neutral as the fifth color. Explicit even counts
|
|
23
|
+
are supported and omit the midpoint.
|
|
24
|
+
- **Named suffixes:** `_r` reverses, `_d` selects dark, and `_d_r` or `_r_d`
|
|
25
|
+
combines both.
|
|
26
|
+
|
|
27
|
+
All eighteen named gradients are supported. Numerical screening results and
|
|
28
|
+
usage guidance are available in the methods documentation.
|
|
29
|
+
See the [release notes](https://github.com/clay-wood/huevat/blob/main/docs/RELEASE_NOTES.md)
|
|
30
|
+
and [installation and release guide](https://github.com/clay-wood/huevat/blob/main/docs/RELEASE.md).
|
|
31
|
+
|
|
32
|
+
## Install
|
|
33
|
+
|
|
34
|
+
Install Huevat from PyPI with your plotting library:
|
|
35
|
+
|
|
36
|
+
```sh
|
|
37
|
+
python -m pip install "huevat[matplotlib]"
|
|
38
|
+
python -m pip install "huevat[plotly]"
|
|
39
|
+
python -m pip install "huevat[ultraplot]"
|
|
40
|
+
```
|
|
41
|
+
|
|
42
|
+
Requires Python 3.10+. For colors alone, use `python -m pip install huevat`.
|
|
43
|
+
|
|
44
|
+
## Make a plot
|
|
45
|
+
|
|
46
|
+
```python
|
|
47
|
+
import numpy as np
|
|
48
|
+
import matplotlib.pyplot as plt
|
|
49
|
+
import huevat as hv
|
|
50
|
+
from huevat.adapters import matplotlib as hmpl
|
|
51
|
+
|
|
52
|
+
xx, yy = np.meshgrid(np.linspace(-3, 3, 160), np.linspace(-2, 2, 100))
|
|
53
|
+
field = (8 * np.exp(-((xx - .7)**2 + (yy - .1)**2))
|
|
54
|
+
- 2 * np.exp(-((xx + 1.1)**2 + (yy + .2)**2) / .4))
|
|
55
|
+
gradient = hv.diverging()
|
|
56
|
+
nine_colors = gradient.discrete() # default: 9, including the neutral midpoint
|
|
57
|
+
boundaries = [-2, -1.5, -1, -.5, -.1, .1, 1, 2, 4, 8]
|
|
58
|
+
palette = hv.categorical(5)
|
|
59
|
+
|
|
60
|
+
fig, axes = plt.subplots(1, 3, figsize=(12, 3.5), layout="constrained")
|
|
61
|
+
continuous = axes[0].imshow(field, cmap=hmpl.colormap(gradient), origin="lower",
|
|
62
|
+
norm=hmpl.normalizer(-2, 8, center=0))
|
|
63
|
+
discrete = axes[1].imshow(field, cmap=hmpl.colormap(nine_colors), origin="lower",
|
|
64
|
+
norm=hmpl.boundary_normalizer(nine_colors, boundaries))
|
|
65
|
+
axes[0].set_title("Continuous · zero at neutral")
|
|
66
|
+
axes[1].set_title("9 colors · neutral bin around zero")
|
|
67
|
+
fig.colorbar(continuous, ax=axes[0], orientation="horizontal")
|
|
68
|
+
fig.colorbar(discrete, ax=axes[1], orientation="horizontal")
|
|
69
|
+
|
|
70
|
+
axes[2].set_prop_cycle(hmpl.cycle(palette, markers=["o", "s", "^", "D", "v"],
|
|
71
|
+
linestyles=["-", "--", ":", "-.", "-"]))
|
|
72
|
+
x = np.linspace(0, 1, 25)
|
|
73
|
+
for i, label in enumerate(["Blue", "Teal", "Ochre", "Coral", "Purple"]):
|
|
74
|
+
axes[2].plot(x, .12 * i + .08 * np.sin(2 * np.pi * x + i / 2),
|
|
75
|
+
label=label, markevery=4)
|
|
76
|
+
axes[2].set_title("Clearer · specified markers and dashes")
|
|
77
|
+
axes[2].legend(fontsize=8, loc="upper right")
|
|
78
|
+
plt.show()
|
|
79
|
+
```
|
|
80
|
+
|
|
81
|
+
For a field, pass `hmpl.colormap(hv.sequential())` to `imshow` or `pcolormesh`.
|
|
82
|
+
Use `hv.diverging()` with `hmpl.normalizer(vmin, vmax, center=0)` for signed data.
|
|
83
|
+
The discrete example uses nine colors, with zero inside the neutral bin
|
|
84
|
+
from −0.1 to +0.1. Choose bin boundaries to suit your data.
|
|
85
|
+
|
|
86
|
+

|
|
87
|
+
|
|
88
|
+
[See complete examples for all three plotting libraries.](https://github.com/clay-wood/huevat/blob/main/examples/README.md)
|
|
89
|
+
|
|
90
|
+
## More gradients
|
|
91
|
+
|
|
92
|
+
Eighteen additional gradients cover general plots, seismic data, terrain, depth,
|
|
93
|
+
and atmospheric fields, with supported light and dark variants.
|
|
94
|
+
|
|
95
|
+

|
|
96
|
+
|
|
97
|
+
```python
|
|
98
|
+
gradient = hv.gradient("bathymetry")
|
|
99
|
+
new_gradient = hv.gradient("verdant")
|
|
100
|
+
reversed_gradient = hv.gradient("thermal_r")
|
|
101
|
+
dark_gradient = hv.gradient("thermal_d")
|
|
102
|
+
dark_reversed_gradient = hv.gradient("thermal_d_r")
|
|
103
|
+
print(hv.gradient_names())
|
|
104
|
+
```
|
|
105
|
+
|
|
106
|
+
The revised routes are:
|
|
107
|
+
|
|
108
|
+
| Gradient | Current route | Previously similar to |
|
|
109
|
+
| --- | --- | --- |
|
|
110
|
+
| Aerosol | Deep red → magenta → pale violet | Rosewood |
|
|
111
|
+
| Bathymetry | Pale cyan → turquoise → deep ocean, darkening with depth | Mineral |
|
|
112
|
+
| Thermal | Violet → neutral → green | Balance |
|
|
113
|
+
|
|
114
|
+
Append `_r` to reverse a named gradient or `_d` to select its dark version;
|
|
115
|
+
combine them as `_d_r` or `_r_d`. `gradient.reversed()` also changes direction.
|
|
116
|
+
`_d` is equivalent to `background="dark"`; combining it with an explicit
|
|
117
|
+
`background="light"` is an error.
|
|
118
|
+
|
|
119
|
+
For separate colors, `gradient.discrete()` selects nine bins. Diverging scales
|
|
120
|
+
include their neutral midpoint; explicit even counts remain available.
|
|
121
|
+
|
|
122
|
+
```python
|
|
123
|
+
signed = hv.diverging()
|
|
124
|
+
nine_colors = signed.discrete() # neutral is nine_colors.colors[4]
|
|
125
|
+
assert nine_colors.colors[4] == hv.to_hex(signed.at(0.5))
|
|
126
|
+
```
|
|
127
|
+
|
|
128
|
+
Check `hv.known_counts(gradient)` for tested counts.
|
|
129
|
+
`hv.optimized_discrete(gradient, n)` searches for better-spaced colors and
|
|
130
|
+
requires the `design` extra.
|
|
131
|
+
|
|
132
|
+

|
|
133
|
+
|
|
134
|
+
## Figure doctor
|
|
135
|
+
|
|
136
|
+
Coordinate colors, markers and dashes in an existing figure. Repeated labels
|
|
137
|
+
keep the same style across panels.
|
|
138
|
+
|
|
139
|
+
| Before | After |
|
|
140
|
+
| --- | --- |
|
|
141
|
+
|  |  |
|
|
142
|
+
|
|
143
|
+
Install with `python -m pip install "huevat[design,matplotlib]"`, or replace
|
|
144
|
+
`matplotlib` with `plotly` or `ultraplot`.
|
|
145
|
+
|
|
146
|
+
```python
|
|
147
|
+
from huevat import doctor
|
|
148
|
+
|
|
149
|
+
scene = doctor.inspect(fig)
|
|
150
|
+
closer, separation, simple = doctor.propose(scene)
|
|
151
|
+
preview = doctor.preview(fig, separation)
|
|
152
|
+
change = doctor.apply(fig, separation)
|
|
153
|
+
change.undo()
|
|
154
|
+
```
|
|
155
|
+
|
|
156
|
+
[Figure doctor guide](https://github.com/clay-wood/huevat/blob/main/docs/FIGURE_DOCTOR.md) explains previews, fixed colors and
|
|
157
|
+
keeping styles across figures. Review the result at the size you intend to use.
|
|
158
|
+
|
|
159
|
+
## Save colors
|
|
160
|
+
|
|
161
|
+
```python
|
|
162
|
+
hv.export(palette).write("palette.json")
|
|
163
|
+
restored = hv.load_export(open("palette.json", encoding="utf-8").read()).design
|
|
164
|
+
hv.export(hv.diverging(), n=7, format="csv").write("colors.csv")
|
|
165
|
+
```
|
|
166
|
+
|
|
167
|
+
JSON saves a design for reuse. CSV and hex give you color lists; CSS is also
|
|
168
|
+
available. See the [quick start](https://github.com/clay-wood/huevat/blob/main/docs/QUICKSTART.md) for labels and more examples.
|
huevat-0.1.0/docs/API.md
ADDED
|
@@ -0,0 +1,100 @@
|
|
|
1
|
+
# API guide
|
|
2
|
+
|
|
3
|
+
```python
|
|
4
|
+
import huevat as hv
|
|
5
|
+
```
|
|
6
|
+
|
|
7
|
+
Start with the [quick start](QUICKSTART.md) or the [palette gallery](../README.md).
|
|
8
|
+
|
|
9
|
+
## Choose colors
|
|
10
|
+
|
|
11
|
+
| Function | Use |
|
|
12
|
+
| --- | --- |
|
|
13
|
+
| `categorical(n, background="light", style="clearer")` | Distinct categories; default palettes cover 2–12 colors |
|
|
14
|
+
| `sequential(background="light")` | Ordered values from low to high |
|
|
15
|
+
| `diverging(background="light")` | Values on either side of a center |
|
|
16
|
+
| `multihue(background="light")` | Ordered values with a wider hue range |
|
|
17
|
+
| `spectral(background="light")` | A diverging gradient with several hues |
|
|
18
|
+
| `gradient(name, background=None)` | One of eighteen supported gradients; defaults to light, `_d` selects dark, `_r` reverses |
|
|
19
|
+
| `gradient_names(family=None, domain=None)` | List named gradients, optionally filtered |
|
|
20
|
+
| `gradient_info(name)` | Read a named gradient's intended uses and direction |
|
|
21
|
+
|
|
22
|
+
Use `background="dark"` for dark figures. A categorical palette provides hex
|
|
23
|
+
strings in `.colors`. A gradient provides RGB tuples through `.at(t)`.
|
|
24
|
+
|
|
25
|
+
## Sample and inspect
|
|
26
|
+
|
|
27
|
+
| Operation | Use |
|
|
28
|
+
| --- | --- |
|
|
29
|
+
| `g.at(t)` | Read a color at a position from 0 to 1 |
|
|
30
|
+
| `g.reversed()` | Reverse a gradient |
|
|
31
|
+
| `g.discrete(n=9, context=None)` | Select evenly spaced colors; nine bins include a diverging neutral |
|
|
32
|
+
| `known_counts(g)` | List prepared counts that passed the checks |
|
|
33
|
+
| `nearby_counts(g, n, context=None)` | Find tested counts near the one requested |
|
|
34
|
+
| `optimized_discrete(g, n, context=None, grid=257, max_seconds=10)` | Search for better-spaced positions; requires `design` |
|
|
35
|
+
| `summarize(source)` | Read a short summary of the color checks |
|
|
36
|
+
| `source.report` | Read the full numerical results |
|
|
37
|
+
|
|
38
|
+
Some counts fail the color checks; an unlisted count has not necessarily failed.
|
|
39
|
+
Sample positions do not set physical data-bin boundaries.
|
|
40
|
+
Explicit even counts retain their requested size and omit the neutral midpoint.
|
|
41
|
+
Named suffixes compose in either order: `gradient("balance_d_r")` equals
|
|
42
|
+
`gradient("balance", background="dark").reversed()`. `_d` conflicts with an
|
|
43
|
+
explicit `background="light"`; repeated suffixes are invalid. `gradient_info`
|
|
44
|
+
accepts suffixes and returns the base route's metadata; `gradient_names` lists
|
|
45
|
+
base names.
|
|
46
|
+
|
|
47
|
+
## Save and load
|
|
48
|
+
|
|
49
|
+
```python
|
|
50
|
+
hv.export(palette, labels=labels).write("palette.json")
|
|
51
|
+
saved = hv.load_export(open("palette.json", encoding="utf-8").read())
|
|
52
|
+
palette = saved.design
|
|
53
|
+
colors_by_label = saved.color_map
|
|
54
|
+
|
|
55
|
+
hv.export(gradient, n=7, format="csv").write("colors.csv")
|
|
56
|
+
```
|
|
57
|
+
|
|
58
|
+
`export(design, format="json", n=None, context=None, labels=None, source=None)`
|
|
59
|
+
supports `json`, `csv`, `hex` and `css`. The result has `.text`, `.report` and
|
|
60
|
+
`.write(path)`. JSON preserves the design and labels; CSV and hex provide color
|
|
61
|
+
lists. CSS approximates continuous gradients with checked color stops.
|
|
62
|
+
Its optional `tolerance=.002` and `max_stops=1025` control that approximation.
|
|
63
|
+
|
|
64
|
+
For JSON, export a gradient with `n=7` or supply its original gradient as
|
|
65
|
+
`export(palette, source=gradient)`. Categorical palettes and palettes from
|
|
66
|
+
`optimized_discrete` already contain the information needed to save them.
|
|
67
|
+
Labels must be unique and match the number of colors.
|
|
68
|
+
|
|
69
|
+
`load_export(value, validate=True)` returns `.design`, `.source`, `.labels`
|
|
70
|
+
and, for labeled palettes, `.color_map`. Loading unfamiliar designs can require
|
|
71
|
+
`design` to repeat the checks. `validate=False` skips those checks and leaves
|
|
72
|
+
the result unvalidated.
|
|
73
|
+
|
|
74
|
+
You can also save with `.to_recipe()` or `.to_json()` and restore with
|
|
75
|
+
`load_recipe(value, validate=True)`.
|
|
76
|
+
|
|
77
|
+
## Find a particular design
|
|
78
|
+
|
|
79
|
+
`design_ids(family=None, background=None, role=None)` lists saved designs.
|
|
80
|
+
`design_info(id)` describes one; `get_design(id)` loads it. Roles are `default`,
|
|
81
|
+
`legacy` and `collection`. Saving an ID lets you request the same design later.
|
|
82
|
+
|
|
83
|
+
## Plotting and Figure doctor
|
|
84
|
+
|
|
85
|
+
Adapters live in `huevat.adapters.matplotlib`, `.plotly` and `.ultraplot`.
|
|
86
|
+
See the [complete plotting examples](../examples/README.md).
|
|
87
|
+
|
|
88
|
+
Figure doctor provides `inspect`, `diagnose`, `propose`, `preview`, `apply` and
|
|
89
|
+
`load_proposal`. Its suggestions require the `design` extra. See the
|
|
90
|
+
[Figure doctor guide](FIGURE_DOCTOR.md).
|
|
91
|
+
|
|
92
|
+
## Errors
|
|
93
|
+
|
|
94
|
+
`ValueError` indicates an invalid argument. `QualityError` means a color check
|
|
95
|
+
failed. `ConstraintConflictError` means the fixed gradient cannot meet the
|
|
96
|
+
requested count under the selected rules. `SearchExhaustedError` means the
|
|
97
|
+
search ended without finding a passing result. Color-check errors include
|
|
98
|
+
their numerical report.
|
|
99
|
+
|
|
100
|
+
The [methods notes](METHODS_H1.md) describe the checks and their limits.
|
|
@@ -0,0 +1,83 @@
|
|
|
1
|
+
# Figure doctor
|
|
2
|
+
|
|
3
|
+
Improve an existing line or scatter figure with coordinated colors, markers
|
|
4
|
+
and dashes. Matplotlib, Plotly and UltraPlot are supported.
|
|
5
|
+
|
|
6
|
+
| Before | After |
|
|
7
|
+
| --- | --- |
|
|
8
|
+
|  |  |
|
|
9
|
+
|
|
10
|
+
## Compare suggestions
|
|
11
|
+
|
|
12
|
+
Install from PyPI with `python -m pip install "huevat[design,matplotlib]"`.
|
|
13
|
+
Replace `matplotlib` with `plotly` or `ultraplot` for those libraries.
|
|
14
|
+
|
|
15
|
+
```python
|
|
16
|
+
from huevat import doctor
|
|
17
|
+
|
|
18
|
+
scene = doctor.inspect(fig)
|
|
19
|
+
closer, separation, simple = doctor.propose(scene)
|
|
20
|
+
preview = doctor.preview(fig, separation)
|
|
21
|
+
gray = doctor.preview(fig, separation, condition="grayscale")
|
|
22
|
+
|
|
23
|
+
change = doctor.apply(fig, separation)
|
|
24
|
+
change.undo()
|
|
25
|
+
```
|
|
26
|
+
|
|
27
|
+
- **Closer** keeps more of the original color appearance.
|
|
28
|
+
- **Separation** prioritizes series that cross or run close together.
|
|
29
|
+
- **Simple** uses fewer additional markers and dashes.
|
|
30
|
+
|
|
31
|
+
Suggestions can be similar when the same choice works best for the figure.
|
|
32
|
+
Preview creates a copy. For Matplotlib and UltraPlot, save it with
|
|
33
|
+
`preview.savefig("preview.png")` or display it in a notebook. For Plotly, use
|
|
34
|
+
`preview.show()`. `apply` changes the original figure; `undo` restores the
|
|
35
|
+
previous styles and checks for changes made since the suggestion was applied.
|
|
36
|
+
|
|
37
|
+
## Keep specific colors or styles
|
|
38
|
+
|
|
39
|
+
```python
|
|
40
|
+
options = doctor.propose(scene, locked={
|
|
41
|
+
"Reference": {"color": "#4379a3"},
|
|
42
|
+
"Treatment": {"marker": "square", "dash": "dash"},
|
|
43
|
+
})
|
|
44
|
+
```
|
|
45
|
+
|
|
46
|
+
Fixed styles stay exact. If they prevent colors from passing the checks, the
|
|
47
|
+
report says so. Markers and dashes can still help readers follow the series.
|
|
48
|
+
|
|
49
|
+
## Keep labels consistent across figures
|
|
50
|
+
|
|
51
|
+
```python
|
|
52
|
+
next_scene = doctor.inspect(next_fig)
|
|
53
|
+
next_options = doctor.propose(next_scene, assignments=separation.assignments)
|
|
54
|
+
```
|
|
55
|
+
|
|
56
|
+
The same label keeps its style when series are reordered or temporarily absent.
|
|
57
|
+
Use consistent, unique labels for categories you want to match.
|
|
58
|
+
|
|
59
|
+
## Check and save a suggestion
|
|
60
|
+
|
|
61
|
+
```python
|
|
62
|
+
print(separation.report["color_screen_pass"])
|
|
63
|
+
gray = doctor.preview(fig, separation, condition="grayscale")
|
|
64
|
+
simulated = doctor.preview(fig, separation, condition="deutan-100")
|
|
65
|
+
|
|
66
|
+
saved_json = separation.to_json()
|
|
67
|
+
restored = doctor.load_proposal(saved_json)
|
|
68
|
+
```
|
|
69
|
+
|
|
70
|
+
A saved suggestion applies to the same figure data and settings. Use its
|
|
71
|
+
`.assignments` to carry styles to a different figure.
|
|
72
|
+
|
|
73
|
+
## Supported figures
|
|
74
|
+
|
|
75
|
+
Figure doctor edits ordinary Cartesian lines and scatter series with uniform
|
|
76
|
+
colors. It supports repeated labels across panels and respects each panel's
|
|
77
|
+
background. Images, colorbars, uncertainty bands and unsupported plot types
|
|
78
|
+
are kept as they are. Plotly works best with explicit numeric coordinates,
|
|
79
|
+
trace modes and colors. Not every legend or custom artist can be updated.
|
|
80
|
+
|
|
81
|
+
Color checks cover the supported marks. They do not assess the whole figure;
|
|
82
|
+
crossing detection can miss small features. Review the preview at the intended
|
|
83
|
+
figure size. The [methods notes](METHODS_H4C.md) give detailed coverage.
|