gtop-nv 0.2.0__tar.gz
This diff represents the content of publicly available package versions that have been released to one of the supported registries. The information contained in this diff is provided for informational purposes only and reflects changes between package versions as they appear in their respective public registries.
- gtop_nv-0.2.0/.gitignore +7 -0
- gtop_nv-0.2.0/LICENSE +21 -0
- gtop_nv-0.2.0/PKG-INFO +151 -0
- gtop_nv-0.2.0/README.md +125 -0
- gtop_nv-0.2.0/gtop_nv/__init__.py +3 -0
- gtop_nv-0.2.0/gtop_nv/__main__.py +3 -0
- gtop_nv-0.2.0/gtop_nv/app.py +711 -0
- gtop_nv-0.2.0/gtop_nv/sampler.py +535 -0
- gtop_nv-0.2.0/pyproject.toml +47 -0
- gtop_nv-0.2.0/tests/test_gtop.py +84 -0
gtop_nv-0.2.0/.gitignore
ADDED
gtop_nv-0.2.0/LICENSE
ADDED
|
@@ -0,0 +1,21 @@
|
|
|
1
|
+
MIT License
|
|
2
|
+
|
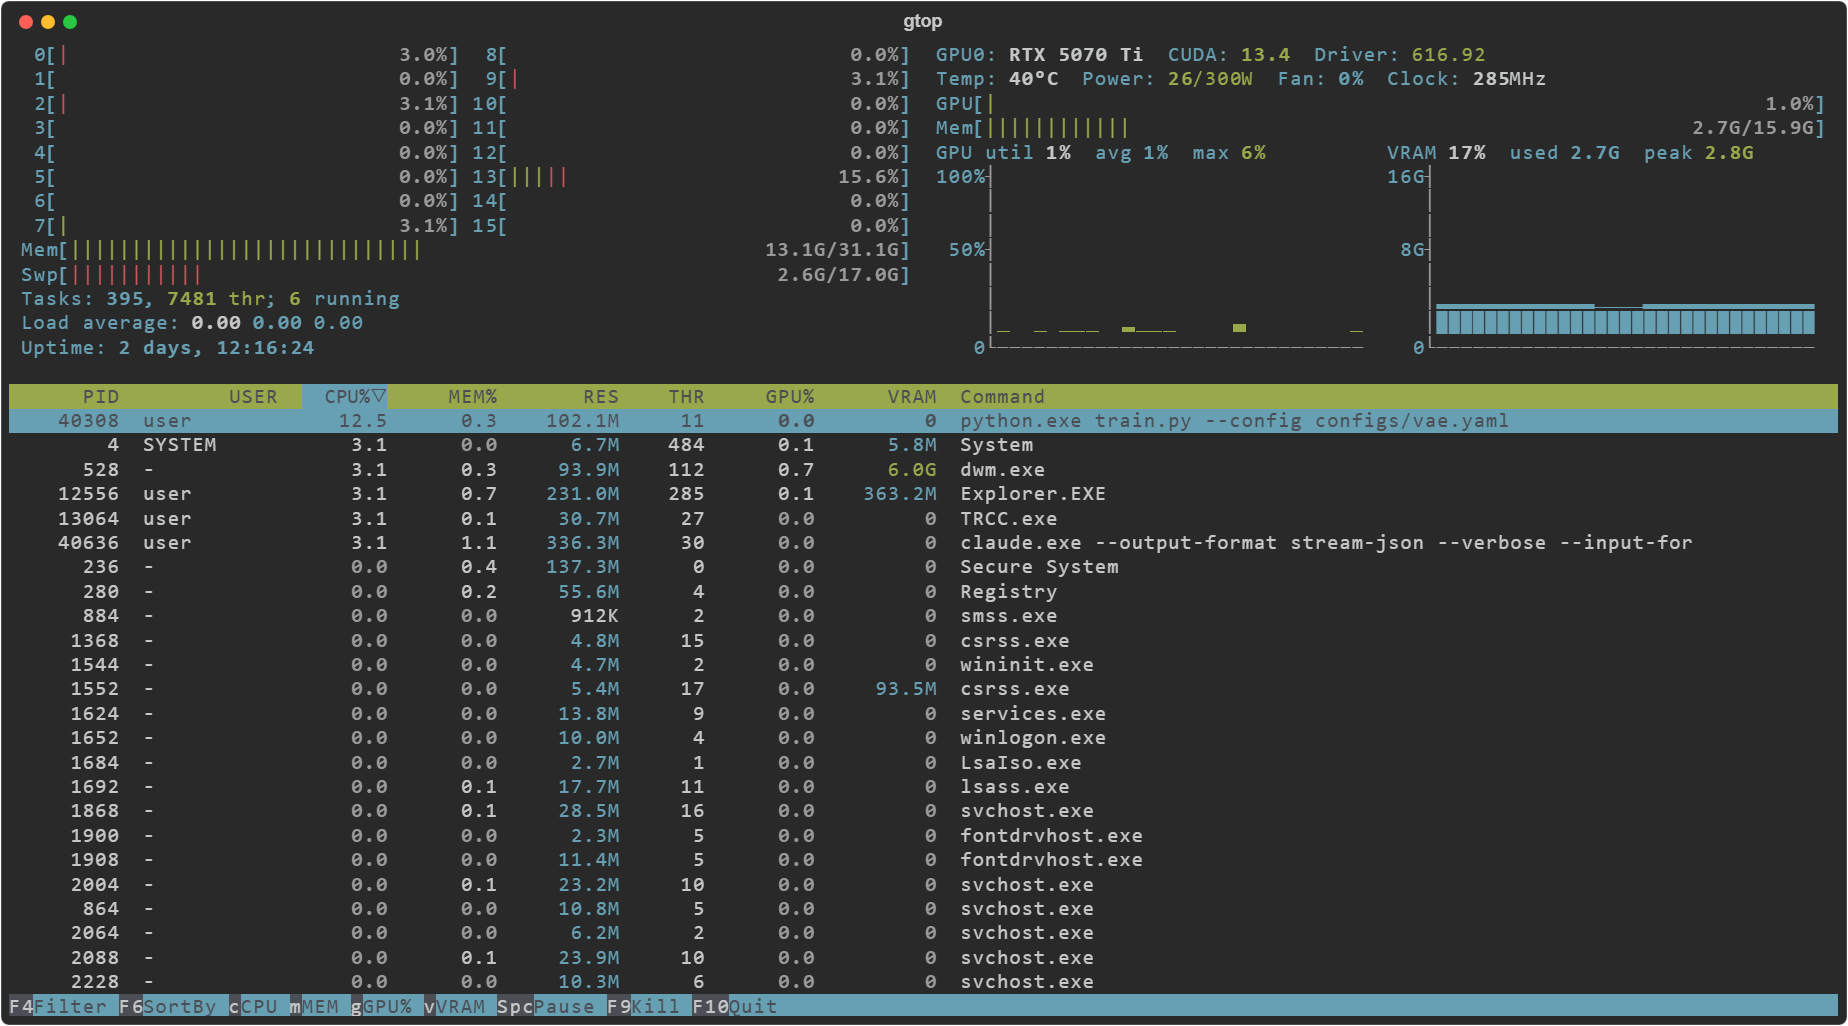
|
3
|
+
Copyright (c) 2026 Soksedtha Ly
|
|
4
|
+
|
|
5
|
+
Permission is hereby granted, free of charge, to any person obtaining a copy
|
|
6
|
+
of this software and associated documentation files (the "Software"), to deal
|
|
7
|
+
in the Software without restriction, including without limitation the rights
|
|
8
|
+
to use, copy, modify, merge, publish, distribute, sublicense, and/or sell
|
|
9
|
+
copies of the Software, and to permit persons to whom the Software is
|
|
10
|
+
furnished to do so, subject to the following conditions:
|
|
11
|
+
|
|
12
|
+
The above copyright notice and this permission notice shall be included in all
|
|
13
|
+
copies or substantial portions of the Software.
|
|
14
|
+
|
|
15
|
+
THE SOFTWARE IS PROVIDED "AS IS", WITHOUT WARRANTY OF ANY KIND, EXPRESS OR
|
|
16
|
+
IMPLIED, INCLUDING BUT NOT LIMITED TO THE WARRANTIES OF MERCHANTABILITY,
|
|
17
|
+
FITNESS FOR A PARTICULAR PURPOSE AND NONINFRINGEMENT. IN NO EVENT SHALL THE
|
|
18
|
+
AUTHORS OR COPYRIGHT HOLDERS BE LIABLE FOR ANY CLAIM, DAMAGES OR OTHER
|
|
19
|
+
LIABILITY, WHETHER IN AN ACTION OF CONTRACT, TORT OR OTHERWISE, ARISING FROM,
|
|
20
|
+
OUT OF OR IN CONNECTION WITH THE SOFTWARE OR THE USE OR OTHER DEALINGS IN THE
|
|
21
|
+
SOFTWARE.
|
gtop_nv-0.2.0/PKG-INFO
ADDED
|
@@ -0,0 +1,151 @@
|
|
|
1
|
+
Metadata-Version: 2.5
|
|
2
|
+
Name: gtop-nv
|
|
3
|
+
Version: 0.2.0
|
|
4
|
+
Summary: htop + nvtop in one terminal UI: CPU, memory, GPU and per-process VRAM (Windows, Linux, macOS)
|
|
5
|
+
Project-URL: Homepage, https://github.com/gtmetric/gtop
|
|
6
|
+
Project-URL: Issues, https://github.com/gtmetric/gtop/issues
|
|
7
|
+
Author: Soksedtha Ly
|
|
8
|
+
License-Expression: MIT
|
|
9
|
+
License-File: LICENSE
|
|
10
|
+
Keywords: gpu,htop,linux,macos,nvidia,nvtop,system-monitor,tui,vram,windows
|
|
11
|
+
Classifier: Development Status :: 4 - Beta
|
|
12
|
+
Classifier: Environment :: Console :: Curses
|
|
13
|
+
Classifier: Intended Audience :: Developers
|
|
14
|
+
Classifier: Intended Audience :: Science/Research
|
|
15
|
+
Classifier: Operating System :: MacOS
|
|
16
|
+
Classifier: Operating System :: Microsoft :: Windows
|
|
17
|
+
Classifier: Operating System :: POSIX :: Linux
|
|
18
|
+
Classifier: Programming Language :: Python :: 3
|
|
19
|
+
Classifier: Topic :: System :: Monitoring
|
|
20
|
+
Requires-Python: >=3.10
|
|
21
|
+
Requires-Dist: nvidia-ml-py>=12.0
|
|
22
|
+
Requires-Dist: psutil>=7.0
|
|
23
|
+
Requires-Dist: pywin32>=306; sys_platform == 'win32'
|
|
24
|
+
Requires-Dist: textual>=8.0
|
|
25
|
+
Description-Content-Type: text/markdown
|
|
26
|
+
|
|
27
|
+
# gtop: htop + nvtop for Windows, Linux and macOS
|
|
28
|
+
|
|
29
|
+
**A terminal system monitor that shows CPU, memory, GPU usage and per-process VRAM in one window, with htop's look and nvtop's GPU charts.**
|
|
30
|
+
|
|
31
|
+
gtop combines htop's CPU meters and process list with nvtop's GPU panel: usage and VRAM history charts, temperature, power and CUDA version. The process table shows each process's GPU% and VRAM, so you can see which process is using your GPU. It runs on Windows, where neither htop nor nvtop is available, as well as on Linux and macOS.
|
|
32
|
+
|
|
33
|
+
|
|
34
|
+
|
|
35
|
+
## Why
|
|
36
|
+
|
|
37
|
+
htop doesn't run on Windows, and nvtop targets Linux. Task Manager shows per-process GPU use, but not in a terminal, and you can't sort it alongside CPU in an htop-style view. If you train models, gtop shows everything in one place on any OS: which process is using the GPU, how much VRAM it holds, and whether the CPU is the bottleneck.
|
|
38
|
+
|
|
39
|
+
## Features
|
|
40
|
+
|
|
41
|
+
- **htop-style header:** a meter for each core split into user, kernel and interrupt time, plus memory and swap meters, task and thread counts, load average and uptime
|
|
42
|
+
- **nvtop-style GPU panel:**
|
|
43
|
+
- utilization, VRAM, temperature, power, fan and clock speed
|
|
44
|
+
- CUDA and driver versions
|
|
45
|
+
- history charts for usage and VRAM, with current, average and peak values
|
|
46
|
+
- **Per-process GPU% and VRAM columns**, sortable like any other
|
|
47
|
+
- **Sorting** by CPU, memory, GPU% or VRAM with one key, or by clicking a column header
|
|
48
|
+
- **Filtering** by name, command line, user or PID, and **killing** a process after confirmation
|
|
49
|
+
- **Light on resources:** on Windows, one `NtQuerySystemInformation` call per refresh (~10–30 ms with 400+ processes). Sampling runs in a background thread, so the UI stays responsive.
|
|
50
|
+
|
|
51
|
+
## Platform support
|
|
52
|
+
|
|
53
|
+
| | Windows | Linux | macOS |
|
|
54
|
+
|---|---|---|---|
|
|
55
|
+
| CPU meters, memory, process list | ✓ | ✓ | ✓ |
|
|
56
|
+
| GPU panel | NVIDIA | NVIDIA | Apple GPU (utilization and memory only) |
|
|
57
|
+
| Per-process GPU% / VRAM | any GPU vendor, via Windows' GPU counters | NVIDIA, via NVML¹ | not available |
|
|
58
|
+
|
|
59
|
+
¹ Not available inside WSL: its GPU passthrough hides processes from NVML.
|
|
60
|
+
|
|
61
|
+
gtop is tested on Windows 11 and Ubuntu (WSL2) with an NVIDIA RTX GPU. macOS support is new and runs in CI only, so reports from Mac users are welcome.
|
|
62
|
+
|
|
63
|
+
## Install
|
|
64
|
+
|
|
65
|
+
You need Python 3.10 or newer. Install with [pipx](https://pipx.pypa.io/):
|
|
66
|
+
|
|
67
|
+
```sh
|
|
68
|
+
pipx install gtop-nv
|
|
69
|
+
```
|
|
70
|
+
|
|
71
|
+
Or with [uv](https://docs.astral.sh/uv/):
|
|
72
|
+
|
|
73
|
+
```sh
|
|
74
|
+
uv tool install gtop-nv
|
|
75
|
+
```
|
|
76
|
+
|
|
77
|
+
Then run `gtop`. If the command isn't found, open a new terminal so it picks up the updated PATH.
|
|
78
|
+
|
|
79
|
+
### Windows: Smart App Control
|
|
80
|
+
|
|
81
|
+
gtop runs on your installed Python rather than as a bundled `.exe`, because Windows Smart App Control blocks unsigned executables. pipx and uv still create a small unsigned `gtop.exe` launcher, though, and on some machines Smart App Control blocks it ("An Application Control policy has blocked this file"). If that happens, run gtop through the tool's Python, which is signed:
|
|
82
|
+
|
|
83
|
+
```powershell
|
|
84
|
+
# pipx
|
|
85
|
+
& "$env:LOCALAPPDATA\pipx\pipx\venvs\gtop-nv\Scripts\python.exe" -m gtop_nv
|
|
86
|
+
# uv
|
|
87
|
+
& "$(uv tool dir)\gtop-nv\Scripts\python.exe" -m gtop_nv
|
|
88
|
+
```
|
|
89
|
+
|
|
90
|
+
To keep typing just `gtop`, add a function to your PowerShell profile (`notepad $PROFILE`):
|
|
91
|
+
|
|
92
|
+
```powershell
|
|
93
|
+
function gtop { & "$env:LOCALAPPDATA\pipx\pipx\venvs\gtop-nv\Scripts\python.exe" -m gtop_nv @args }
|
|
94
|
+
```
|
|
95
|
+
|
|
96
|
+
## Usage
|
|
97
|
+
|
|
98
|
+
```
|
|
99
|
+
gtop [-d DELAY] [-s {cpu,mem,gpu,vram,pid,name,user,thr}]
|
|
100
|
+
```
|
|
101
|
+
|
|
102
|
+
| Key | Action |
|
|
103
|
+
|---|---|
|
|
104
|
+
| `c` `m` `g` `v` | Sort by CPU / memory / GPU% / VRAM (press again to reverse) |
|
|
105
|
+
| `p` `n` | Sort by PID / command |
|
|
106
|
+
| `F6` | Cycle through sort columns |
|
|
107
|
+
| click a header | Sort by that column |
|
|
108
|
+
| `F4` or `/` | Filter (Enter keeps it, Esc clears it) |
|
|
109
|
+
| `↑` `↓` `PgUp` `PgDn` | Move the selection (it then stays on that process) |
|
|
110
|
+
| `Home` | Back to the top |
|
|
111
|
+
| `F9` or `k` | Kill the selected process, after confirmation |
|
|
112
|
+
| `Space` | Pause updates |
|
|
113
|
+
| `+` / `-` | Refresh faster / slower |
|
|
114
|
+
| `F10`, `q` or `Ctrl+C` | Quit |
|
|
115
|
+
|
|
116
|
+
`python -m gtop_nv.sampler --once` prints a single plain-text sample, which is handy for scripting or debugging.
|
|
117
|
+
|
|
118
|
+
## Notes
|
|
119
|
+
|
|
120
|
+
- **CPU% per process** follows htop's convention: 100% means one full core, so a busy multi-threaded process can exceed 100%.
|
|
121
|
+
- **CPU bar colors:** green is user time (including nice), red is kernel time (including steal), yellow is interrupts, and magenta is soft IRQs on Linux or DPCs on Windows.
|
|
122
|
+
- **On Windows, the "running" count** is approximate, because Windows has no "R" process state. gtop counts processes that used at least 1% CPU in the last interval.
|
|
123
|
+
- **On Windows, load average** is psutil's emulation, based on the processor queue length. It often stays near zero even under heavy CPU load.
|
|
124
|
+
- **Colors** come from your terminal's own 16-color palette, the same way htop does it.
|
|
125
|
+
|
|
126
|
+
## FAQ
|
|
127
|
+
|
|
128
|
+
**Is there htop for Windows?**
|
|
129
|
+
htop runs on Linux, macOS and the BSDs, but not on Windows. gtop reproduces htop's interface on Windows (same meters, colors, sortable process list and F-key bar) and adds GPU monitoring.
|
|
130
|
+
|
|
131
|
+
**Can I run nvtop on Windows?**
|
|
132
|
+
nvtop targets Linux. gtop gives you an nvtop-style GPU panel on Windows: utilization and VRAM history charts, temperature, power, fan, clocks, and CUDA and driver versions.
|
|
133
|
+
|
|
134
|
+
**How do I see which process is using my GPU or VRAM on Windows?**
|
|
135
|
+
Run `gtop` and press `v` to sort by VRAM, or `g` to sort by GPU%. Per-process numbers come from the same Windows GPU performance counters Task Manager uses. `nvidia-smi` shows "N/A" for per-process memory under the default WDDM driver mode.
|
|
136
|
+
|
|
137
|
+
**Does it work with AMD or Intel GPUs?**
|
|
138
|
+
On Windows, partly: the per-process GPU% and VRAM columns come from Windows' own counters, which work with any GPU vendor. The GPU panel (charts, temperature, power, CUDA version) needs NVIDIA's NVML, or an Apple GPU on macOS.
|
|
139
|
+
|
|
140
|
+
**Why use it on Linux instead of htop + nvtop?**
|
|
141
|
+
You get both in one window, and the process list has GPU% and VRAM columns you can sort by. If you already run htop and nvtop side by side, gtop does the same in a single pane.
|
|
142
|
+
|
|
143
|
+
**Does it show the GPU on a Mac?**
|
|
144
|
+
Yes, on Apple Silicon: GPU utilization and GPU memory in use, read from the I/O Registry without sudo. Temperature, power and per-process GPU usage aren't shown, because macOS only exposes them to `sudo powermetrics`.
|
|
145
|
+
|
|
146
|
+
**Is it useful for deep learning / PyTorch training?**
|
|
147
|
+
That's what it was built for. You can watch GPU utilization and VRAM over time, spot a data-loading bottleneck (busy CPU, idle GPU), and see each training process's VRAM, all in one terminal next to your training run.
|
|
148
|
+
|
|
149
|
+
## License
|
|
150
|
+
|
|
151
|
+
[MIT](https://github.com/gtmetric/gtop/blob/main/LICENSE)
|
gtop_nv-0.2.0/README.md
ADDED
|
@@ -0,0 +1,125 @@
|
|
|
1
|
+
# gtop: htop + nvtop for Windows, Linux and macOS
|
|
2
|
+
|
|
3
|
+
**A terminal system monitor that shows CPU, memory, GPU usage and per-process VRAM in one window, with htop's look and nvtop's GPU charts.**
|
|
4
|
+
|
|
5
|
+
gtop combines htop's CPU meters and process list with nvtop's GPU panel: usage and VRAM history charts, temperature, power and CUDA version. The process table shows each process's GPU% and VRAM, so you can see which process is using your GPU. It runs on Windows, where neither htop nor nvtop is available, as well as on Linux and macOS.
|
|
6
|
+
|
|
7
|
+

|
|
8
|
+
|
|
9
|
+
## Why
|
|
10
|
+
|
|
11
|
+
htop doesn't run on Windows, and nvtop targets Linux. Task Manager shows per-process GPU use, but not in a terminal, and you can't sort it alongside CPU in an htop-style view. If you train models, gtop shows everything in one place on any OS: which process is using the GPU, how much VRAM it holds, and whether the CPU is the bottleneck.
|
|
12
|
+
|
|
13
|
+
## Features
|
|
14
|
+
|
|
15
|
+
- **htop-style header:** a meter for each core split into user, kernel and interrupt time, plus memory and swap meters, task and thread counts, load average and uptime
|
|
16
|
+
- **nvtop-style GPU panel:**
|
|
17
|
+
- utilization, VRAM, temperature, power, fan and clock speed
|
|
18
|
+
- CUDA and driver versions
|
|
19
|
+
- history charts for usage and VRAM, with current, average and peak values
|
|
20
|
+
- **Per-process GPU% and VRAM columns**, sortable like any other
|
|
21
|
+
- **Sorting** by CPU, memory, GPU% or VRAM with one key, or by clicking a column header
|
|
22
|
+
- **Filtering** by name, command line, user or PID, and **killing** a process after confirmation
|
|
23
|
+
- **Light on resources:** on Windows, one `NtQuerySystemInformation` call per refresh (~10–30 ms with 400+ processes). Sampling runs in a background thread, so the UI stays responsive.
|
|
24
|
+
|
|
25
|
+
## Platform support
|
|
26
|
+
|
|
27
|
+
| | Windows | Linux | macOS |
|
|
28
|
+
|---|---|---|---|
|
|
29
|
+
| CPU meters, memory, process list | ✓ | ✓ | ✓ |
|
|
30
|
+
| GPU panel | NVIDIA | NVIDIA | Apple GPU (utilization and memory only) |
|
|
31
|
+
| Per-process GPU% / VRAM | any GPU vendor, via Windows' GPU counters | NVIDIA, via NVML¹ | not available |
|
|
32
|
+
|
|
33
|
+
¹ Not available inside WSL: its GPU passthrough hides processes from NVML.
|
|
34
|
+
|
|
35
|
+
gtop is tested on Windows 11 and Ubuntu (WSL2) with an NVIDIA RTX GPU. macOS support is new and runs in CI only, so reports from Mac users are welcome.
|
|
36
|
+
|
|
37
|
+
## Install
|
|
38
|
+
|
|
39
|
+
You need Python 3.10 or newer. Install with [pipx](https://pipx.pypa.io/):
|
|
40
|
+
|
|
41
|
+
```sh
|
|
42
|
+
pipx install gtop-nv
|
|
43
|
+
```
|
|
44
|
+
|
|
45
|
+
Or with [uv](https://docs.astral.sh/uv/):
|
|
46
|
+
|
|
47
|
+
```sh
|
|
48
|
+
uv tool install gtop-nv
|
|
49
|
+
```
|
|
50
|
+
|
|
51
|
+
Then run `gtop`. If the command isn't found, open a new terminal so it picks up the updated PATH.
|
|
52
|
+
|
|
53
|
+
### Windows: Smart App Control
|
|
54
|
+
|
|
55
|
+
gtop runs on your installed Python rather than as a bundled `.exe`, because Windows Smart App Control blocks unsigned executables. pipx and uv still create a small unsigned `gtop.exe` launcher, though, and on some machines Smart App Control blocks it ("An Application Control policy has blocked this file"). If that happens, run gtop through the tool's Python, which is signed:
|
|
56
|
+
|
|
57
|
+
```powershell
|
|
58
|
+
# pipx
|
|
59
|
+
& "$env:LOCALAPPDATA\pipx\pipx\venvs\gtop-nv\Scripts\python.exe" -m gtop_nv
|
|
60
|
+
# uv
|
|
61
|
+
& "$(uv tool dir)\gtop-nv\Scripts\python.exe" -m gtop_nv
|
|
62
|
+
```
|
|
63
|
+
|
|
64
|
+
To keep typing just `gtop`, add a function to your PowerShell profile (`notepad $PROFILE`):
|
|
65
|
+
|
|
66
|
+
```powershell
|
|
67
|
+
function gtop { & "$env:LOCALAPPDATA\pipx\pipx\venvs\gtop-nv\Scripts\python.exe" -m gtop_nv @args }
|
|
68
|
+
```
|
|
69
|
+
|
|
70
|
+
## Usage
|
|
71
|
+
|
|
72
|
+
```
|
|
73
|
+
gtop [-d DELAY] [-s {cpu,mem,gpu,vram,pid,name,user,thr}]
|
|
74
|
+
```
|
|
75
|
+
|
|
76
|
+
| Key | Action |
|
|
77
|
+
|---|---|
|
|
78
|
+
| `c` `m` `g` `v` | Sort by CPU / memory / GPU% / VRAM (press again to reverse) |
|
|
79
|
+
| `p` `n` | Sort by PID / command |
|
|
80
|
+
| `F6` | Cycle through sort columns |
|
|
81
|
+
| click a header | Sort by that column |
|
|
82
|
+
| `F4` or `/` | Filter (Enter keeps it, Esc clears it) |
|
|
83
|
+
| `↑` `↓` `PgUp` `PgDn` | Move the selection (it then stays on that process) |
|
|
84
|
+
| `Home` | Back to the top |
|
|
85
|
+
| `F9` or `k` | Kill the selected process, after confirmation |
|
|
86
|
+
| `Space` | Pause updates |
|
|
87
|
+
| `+` / `-` | Refresh faster / slower |
|
|
88
|
+
| `F10`, `q` or `Ctrl+C` | Quit |
|
|
89
|
+
|
|
90
|
+
`python -m gtop_nv.sampler --once` prints a single plain-text sample, which is handy for scripting or debugging.
|
|
91
|
+
|
|
92
|
+
## Notes
|
|
93
|
+
|
|
94
|
+
- **CPU% per process** follows htop's convention: 100% means one full core, so a busy multi-threaded process can exceed 100%.
|
|
95
|
+
- **CPU bar colors:** green is user time (including nice), red is kernel time (including steal), yellow is interrupts, and magenta is soft IRQs on Linux or DPCs on Windows.
|
|
96
|
+
- **On Windows, the "running" count** is approximate, because Windows has no "R" process state. gtop counts processes that used at least 1% CPU in the last interval.
|
|
97
|
+
- **On Windows, load average** is psutil's emulation, based on the processor queue length. It often stays near zero even under heavy CPU load.
|
|
98
|
+
- **Colors** come from your terminal's own 16-color palette, the same way htop does it.
|
|
99
|
+
|
|
100
|
+
## FAQ
|
|
101
|
+
|
|
102
|
+
**Is there htop for Windows?**
|
|
103
|
+
htop runs on Linux, macOS and the BSDs, but not on Windows. gtop reproduces htop's interface on Windows (same meters, colors, sortable process list and F-key bar) and adds GPU monitoring.
|
|
104
|
+
|
|
105
|
+
**Can I run nvtop on Windows?**
|
|
106
|
+
nvtop targets Linux. gtop gives you an nvtop-style GPU panel on Windows: utilization and VRAM history charts, temperature, power, fan, clocks, and CUDA and driver versions.
|
|
107
|
+
|
|
108
|
+
**How do I see which process is using my GPU or VRAM on Windows?**
|
|
109
|
+
Run `gtop` and press `v` to sort by VRAM, or `g` to sort by GPU%. Per-process numbers come from the same Windows GPU performance counters Task Manager uses. `nvidia-smi` shows "N/A" for per-process memory under the default WDDM driver mode.
|
|
110
|
+
|
|
111
|
+
**Does it work with AMD or Intel GPUs?**
|
|
112
|
+
On Windows, partly: the per-process GPU% and VRAM columns come from Windows' own counters, which work with any GPU vendor. The GPU panel (charts, temperature, power, CUDA version) needs NVIDIA's NVML, or an Apple GPU on macOS.
|
|
113
|
+
|
|
114
|
+
**Why use it on Linux instead of htop + nvtop?**
|
|
115
|
+
You get both in one window, and the process list has GPU% and VRAM columns you can sort by. If you already run htop and nvtop side by side, gtop does the same in a single pane.
|
|
116
|
+
|
|
117
|
+
**Does it show the GPU on a Mac?**
|
|
118
|
+
Yes, on Apple Silicon: GPU utilization and GPU memory in use, read from the I/O Registry without sudo. Temperature, power and per-process GPU usage aren't shown, because macOS only exposes them to `sudo powermetrics`.
|
|
119
|
+
|
|
120
|
+
**Is it useful for deep learning / PyTorch training?**
|
|
121
|
+
That's what it was built for. You can watch GPU utilization and VRAM over time, spot a data-loading bottleneck (busy CPU, idle GPU), and see each training process's VRAM, all in one terminal next to your training run.
|
|
122
|
+
|
|
123
|
+
## License
|
|
124
|
+
|
|
125
|
+
[MIT](https://github.com/gtmetric/gtop/blob/main/LICENSE)
|