fuzcolor 0.1.0__tar.gz
This diff represents the content of publicly available package versions that have been released to one of the supported registries. The information contained in this diff is provided for informational purposes only and reflects changes between package versions as they appear in their respective public registries.
- fuzcolor-0.1.0/LICENSE +21 -0
- fuzcolor-0.1.0/PKG-INFO +86 -0
- fuzcolor-0.1.0/README.md +56 -0
- fuzcolor-0.1.0/pyproject.toml +91 -0
- fuzcolor-0.1.0/pyproject.toml.orig +92 -0
- fuzcolor-0.1.0/src/fuzcolor/__init__.py +40 -0
- fuzcolor-0.1.0/src/fuzcolor/features/__init__.py +6 -0
- fuzcolor-0.1.0/src/fuzcolor/features/palettes.py +41 -0
- fuzcolor-0.1.0/src/fuzcolor/features/plots.py +153 -0
- fuzcolor-0.1.0/src/fuzcolor/features/tables.py +64 -0
- fuzcolor-0.1.0/src/fuzcolor/math.py +67 -0
- fuzcolor-0.1.0/src/fuzcolor/model.py +229 -0
- fuzcolor-0.1.0/src/fuzcolor/models/__init__.py +5 -0
- fuzcolor-0.1.0/src/fuzcolor/models/colibri.py +69 -0
- fuzcolor-0.1.0/src/fuzcolor/py.typed +0 -0
- fuzcolor-0.1.0/src/fuzcolor/spaces.py +39 -0
fuzcolor-0.1.0/LICENSE
ADDED
|
@@ -0,0 +1,21 @@
|
|
|
1
|
+
MIT License
|
|
2
|
+
|
|
3
|
+
Copyright (c) 2026 coredegon
|
|
4
|
+
|
|
5
|
+
Permission is hereby granted, free of charge, to any person obtaining a copy
|
|
6
|
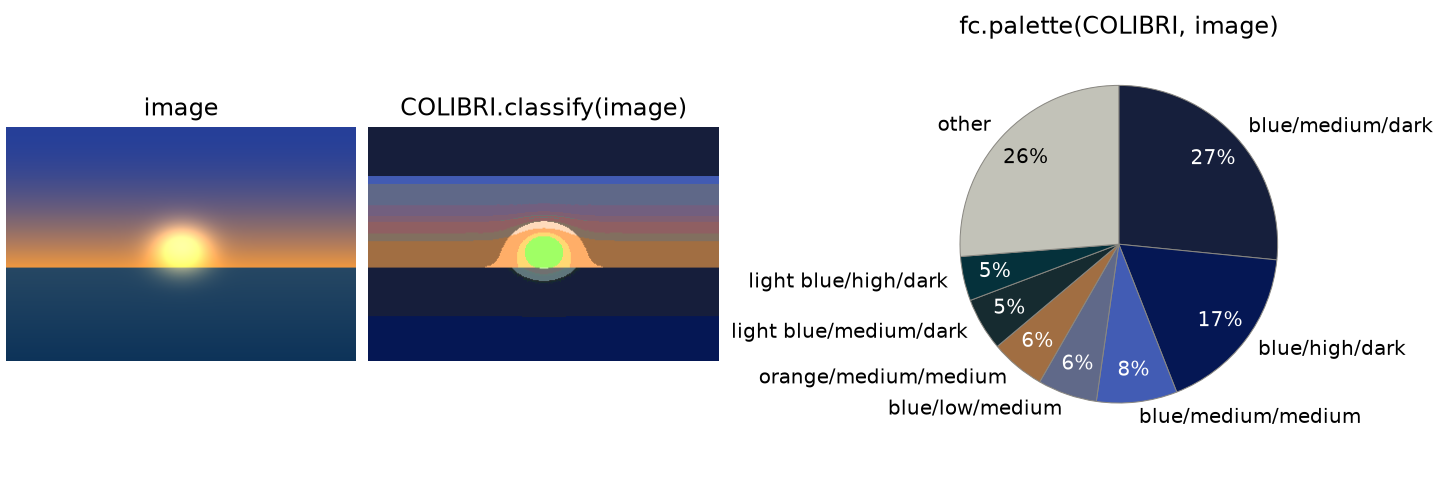
+
of this software and associated documentation files (the "Software"), to deal
|
|
7
|
+
in the Software without restriction, including without limitation the rights
|
|
8
|
+
to use, copy, modify, merge, publish, distribute, sublicense, and/or sell
|
|
9
|
+
copies of the Software, and to permit persons to whom the Software is
|
|
10
|
+
furnished to do so, subject to the following conditions:
|
|
11
|
+
|
|
12
|
+
The above copyright notice and this permission notice shall be included in all
|
|
13
|
+
copies or substantial portions of the Software.
|
|
14
|
+
|
|
15
|
+
THE SOFTWARE IS PROVIDED "AS IS", WITHOUT WARRANTY OF ANY KIND, EXPRESS OR
|
|
16
|
+
IMPLIED, INCLUDING BUT NOT LIMITED TO THE WARRANTIES OF MERCHANTABILITY,
|
|
17
|
+
FITNESS FOR A PARTICULAR PURPOSE AND NONINFRINGEMENT. IN NO EVENT SHALL THE
|
|
18
|
+
AUTHORS OR COPYRIGHT HOLDERS BE LIABLE FOR ANY CLAIM, DAMAGES OR OTHER
|
|
19
|
+
LIABILITY, WHETHER IN AN ACTION OF CONTRACT, TORT OR OTHERWISE, ARISING FROM,
|
|
20
|
+
OUT OF OR IN CONNECTION WITH THE SOFTWARE OR THE USE OR OTHER DEALINGS IN THE
|
|
21
|
+
SOFTWARE.
|
fuzcolor-0.1.0/PKG-INFO
ADDED
|
@@ -0,0 +1,86 @@
|
|
|
1
|
+
Metadata-Version: 2.4
|
|
2
|
+
Name: fuzcolor
|
|
3
|
+
Version: 0.1.0
|
|
4
|
+
Summary: Simple and easy to use Python library for fuzzy color models.
|
|
5
|
+
Keywords: fuzzy,fuzzy-logic,color,color-naming,color-palette,hsi,colibri
|
|
6
|
+
Author: coredegon
|
|
7
|
+
Author-email: coredegon <valikalik15@gmail.com>
|
|
8
|
+
License-Expression: MIT
|
|
9
|
+
License-File: LICENSE
|
|
10
|
+
Classifier: Development Status :: 3 - Alpha
|
|
11
|
+
Classifier: Intended Audience :: Developers
|
|
12
|
+
Classifier: Intended Audience :: Science/Research
|
|
13
|
+
Classifier: Operating System :: OS Independent
|
|
14
|
+
Classifier: Programming Language :: Python :: 3 :: Only
|
|
15
|
+
Classifier: Programming Language :: Python :: 3.12
|
|
16
|
+
Classifier: Programming Language :: Python :: 3.13
|
|
17
|
+
Classifier: Programming Language :: Python :: 3.14
|
|
18
|
+
Classifier: Programming Language :: Python :: 3.15
|
|
19
|
+
Classifier: Topic :: Scientific/Engineering
|
|
20
|
+
Classifier: Topic :: Scientific/Engineering :: Image Processing
|
|
21
|
+
Classifier: Typing :: Typed
|
|
22
|
+
Requires-Dist: fuzlog==0.3.1
|
|
23
|
+
Requires-Dist: matplotlib>=3.9
|
|
24
|
+
Requires-Dist: numpy>=2.0
|
|
25
|
+
Requires-Python: >=3.12
|
|
26
|
+
Project-URL: Repository, https://github.com/coredegon/fuzcolor
|
|
27
|
+
Project-URL: Documentation, https://github.com/coredegon/fuzcolor/tree/main/docs
|
|
28
|
+
Project-URL: Issues, https://github.com/coredegon/fuzcolor/issues
|
|
29
|
+
Description-Content-Type: text/markdown
|
|
30
|
+
|
|
31
|
+
# fuzcolor
|
|
32
|
+
|
|
33
|
+
Simple and easy to use Python library for fuzzy color models: a pixel belongs
|
|
34
|
+
to every named color to a degree. Built on
|
|
35
|
+
[fuzlog](https://github.com/coredegon/fuzlog) and NumPy, typed, Python 3.12+.
|
|
36
|
+
|
|
37
|
+
```sh
|
|
38
|
+
pip install fuzcolor
|
|
39
|
+
```
|
|
40
|
+
|
|
41
|
+
```python
|
|
42
|
+
import numpy as np
|
|
43
|
+
import fuzcolor as fc
|
|
44
|
+
from fuzcolor.models import COLIBRI
|
|
45
|
+
|
|
46
|
+
image = np.array(
|
|
47
|
+
[[[200, 30, 30], [250, 220, 40]], [[30, 60, 200], [60, 60, 60]]], dtype=np.uint8
|
|
48
|
+
)
|
|
49
|
+
|
|
50
|
+
print(COLIBRI) # Model('COLIBRI', HSI: 81 chromatic, 5 achromatic)
|
|
51
|
+
print(COLIBRI.label([200, 30, 30])) # red/high/dark
|
|
52
|
+
print(COLIBRI.label(image).tolist())
|
|
53
|
+
# [['red/high/dark', 'yellow/high/light'], ['blue/high/medium', 'dark gray']]
|
|
54
|
+
|
|
55
|
+
weights = fc.palette(COLIBRI, image) # the share of the image in each of 86 colors
|
|
56
|
+
fc.pie(COLIBRI, weights)
|
|
57
|
+
```
|
|
58
|
+
|
|
59
|
+
|
|
60
|
+
|
|
61
|
+
## Inside
|
|
62
|
+
|
|
63
|
+
| | |
|
|
64
|
+
|---|---|
|
|
65
|
+
| **Models** | `Model` names colors as combinations of the terms of fuzlog variables |
|
|
66
|
+
| **Spaces** | `Space` describes the channels of a color space; `HSI` comes with the library |
|
|
67
|
+
| **Features** | `palette` describes an image, `tabulate` works a model out for every 8-bit color, `plot`, `swatches` and `pie` draw |
|
|
68
|
+
| **`fuzcolor.models`** | the models that come with the library: `COLIBRI` |
|
|
69
|
+
| **`fuzcolor.math`** | the color conversions as plain NumPy functions |
|
|
70
|
+
|
|
71
|
+
## Documentation
|
|
72
|
+
|
|
73
|
+
- [Guide](https://github.com/coredegon/fuzcolor/blob/main/docs/guide.md): how to use a model and how to build one
|
|
74
|
+
- [COLIBRI](https://github.com/coredegon/fuzcolor/blob/main/docs/colibri.md): the model, its colors and its parameters
|
|
75
|
+
- [Reference](https://github.com/coredegon/fuzcolor/blob/main/docs/reference.md): every public name on one page
|
|
76
|
+
|
|
77
|
+
## Development
|
|
78
|
+
|
|
79
|
+
```sh
|
|
80
|
+
uv sync # environment with the dev tools
|
|
81
|
+
uv run pytest # tests, including every example in the documentation
|
|
82
|
+
uv run ruff check # lint; `uv run ruff format` formats
|
|
83
|
+
uv run ty check # types
|
|
84
|
+
```
|
|
85
|
+
|
|
86
|
+
MIT license.
|
fuzcolor-0.1.0/README.md
ADDED
|
@@ -0,0 +1,56 @@
|
|
|
1
|
+
# fuzcolor
|
|
2
|
+
|
|
3
|
+
Simple and easy to use Python library for fuzzy color models: a pixel belongs
|
|
4
|
+
to every named color to a degree. Built on
|
|
5
|
+
[fuzlog](https://github.com/coredegon/fuzlog) and NumPy, typed, Python 3.12+.
|
|
6
|
+
|
|
7
|
+
```sh
|
|
8
|
+
pip install fuzcolor
|
|
9
|
+
```
|
|
10
|
+
|
|
11
|
+
```python
|
|
12
|
+
import numpy as np
|
|
13
|
+
import fuzcolor as fc
|
|
14
|
+
from fuzcolor.models import COLIBRI
|
|
15
|
+
|
|
16
|
+
image = np.array(
|
|
17
|
+
[[[200, 30, 30], [250, 220, 40]], [[30, 60, 200], [60, 60, 60]]], dtype=np.uint8
|
|
18
|
+
)
|
|
19
|
+
|
|
20
|
+
print(COLIBRI) # Model('COLIBRI', HSI: 81 chromatic, 5 achromatic)
|
|
21
|
+
print(COLIBRI.label([200, 30, 30])) # red/high/dark
|
|
22
|
+
print(COLIBRI.label(image).tolist())
|
|
23
|
+
# [['red/high/dark', 'yellow/high/light'], ['blue/high/medium', 'dark gray']]
|
|
24
|
+
|
|
25
|
+
weights = fc.palette(COLIBRI, image) # the share of the image in each of 86 colors
|
|
26
|
+
fc.pie(COLIBRI, weights)
|
|
27
|
+
```
|
|
28
|
+
|
|
29
|
+

|
|
30
|
+
|
|
31
|
+
## Inside
|
|
32
|
+
|
|
33
|
+
| | |
|
|
34
|
+
|---|---|
|
|
35
|
+
| **Models** | `Model` names colors as combinations of the terms of fuzlog variables |
|
|
36
|
+
| **Spaces** | `Space` describes the channels of a color space; `HSI` comes with the library |
|
|
37
|
+
| **Features** | `palette` describes an image, `tabulate` works a model out for every 8-bit color, `plot`, `swatches` and `pie` draw |
|
|
38
|
+
| **`fuzcolor.models`** | the models that come with the library: `COLIBRI` |
|
|
39
|
+
| **`fuzcolor.math`** | the color conversions as plain NumPy functions |
|
|
40
|
+
|
|
41
|
+
## Documentation
|
|
42
|
+
|
|
43
|
+
- [Guide](https://github.com/coredegon/fuzcolor/blob/main/docs/guide.md): how to use a model and how to build one
|
|
44
|
+
- [COLIBRI](https://github.com/coredegon/fuzcolor/blob/main/docs/colibri.md): the model, its colors and its parameters
|
|
45
|
+
- [Reference](https://github.com/coredegon/fuzcolor/blob/main/docs/reference.md): every public name on one page
|
|
46
|
+
|
|
47
|
+
## Development
|
|
48
|
+
|
|
49
|
+
```sh
|
|
50
|
+
uv sync # environment with the dev tools
|
|
51
|
+
uv run pytest # tests, including every example in the documentation
|
|
52
|
+
uv run ruff check # lint; `uv run ruff format` formats
|
|
53
|
+
uv run ty check # types
|
|
54
|
+
```
|
|
55
|
+
|
|
56
|
+
MIT license.
|
|
@@ -0,0 +1,91 @@
|
|
|
1
|
+
[project]
|
|
2
|
+
name = "fuzcolor"
|
|
3
|
+
version = "0.1.0"
|
|
4
|
+
description = "Simple and easy to use Python library for fuzzy color models."
|
|
5
|
+
readme = "README.md"
|
|
6
|
+
license = "MIT"
|
|
7
|
+
license-files = ["LICENSE"]
|
|
8
|
+
requires-python = ">=3.12"
|
|
9
|
+
dependencies = [
|
|
10
|
+
"fuzlog==0.3.1",
|
|
11
|
+
"matplotlib>=3.9",
|
|
12
|
+
"numpy>=2.0",
|
|
13
|
+
]
|
|
14
|
+
keywords = [
|
|
15
|
+
"fuzzy",
|
|
16
|
+
"fuzzy-logic",
|
|
17
|
+
"color",
|
|
18
|
+
"color-naming",
|
|
19
|
+
"color-palette",
|
|
20
|
+
"hsi",
|
|
21
|
+
"colibri",
|
|
22
|
+
]
|
|
23
|
+
classifiers = [
|
|
24
|
+
"Development Status :: 3 - Alpha",
|
|
25
|
+
"Intended Audience :: Developers",
|
|
26
|
+
"Intended Audience :: Science/Research",
|
|
27
|
+
"Operating System :: OS Independent",
|
|
28
|
+
"Programming Language :: Python :: 3 :: Only",
|
|
29
|
+
"Programming Language :: Python :: 3.12",
|
|
30
|
+
"Programming Language :: Python :: 3.13",
|
|
31
|
+
"Programming Language :: Python :: 3.14",
|
|
32
|
+
"Programming Language :: Python :: 3.15",
|
|
33
|
+
"Topic :: Scientific/Engineering",
|
|
34
|
+
"Topic :: Scientific/Engineering :: Image Processing",
|
|
35
|
+
"Typing :: Typed",
|
|
36
|
+
]
|
|
37
|
+
|
|
38
|
+
[[project.authors]]
|
|
39
|
+
name = "coredegon"
|
|
40
|
+
email = "valikalik15@gmail.com"
|
|
41
|
+
|
|
42
|
+
[project.urls]
|
|
43
|
+
Repository = "https://github.com/coredegon/fuzcolor"
|
|
44
|
+
Documentation = "https://github.com/coredegon/fuzcolor/tree/main/docs"
|
|
45
|
+
Issues = "https://github.com/coredegon/fuzcolor/issues"
|
|
46
|
+
|
|
47
|
+
[build-system]
|
|
48
|
+
requires = ["uv_build>=0.13.7,<0.14.0"]
|
|
49
|
+
build-backend = "uv_build"
|
|
50
|
+
|
|
51
|
+
[dependency-groups]
|
|
52
|
+
dev = [
|
|
53
|
+
"pytest>=9.2.0",
|
|
54
|
+
"ruff>=0.17.5",
|
|
55
|
+
"ty>=0.0.104",
|
|
56
|
+
]
|
|
57
|
+
|
|
58
|
+
[tool.ruff.lint]
|
|
59
|
+
select = [
|
|
60
|
+
"E",
|
|
61
|
+
"W",
|
|
62
|
+
"F",
|
|
63
|
+
"I",
|
|
64
|
+
"N",
|
|
65
|
+
"D",
|
|
66
|
+
"UP",
|
|
67
|
+
"B",
|
|
68
|
+
"C4",
|
|
69
|
+
"SIM",
|
|
70
|
+
"PT",
|
|
71
|
+
"NPY",
|
|
72
|
+
"PERF",
|
|
73
|
+
"RUF",
|
|
74
|
+
]
|
|
75
|
+
ignore = [
|
|
76
|
+
"D105",
|
|
77
|
+
"D107",
|
|
78
|
+
]
|
|
79
|
+
|
|
80
|
+
[tool.ruff.lint.pydocstyle]
|
|
81
|
+
convention = "google"
|
|
82
|
+
|
|
83
|
+
[tool.ruff.lint.per-file-ignores]
|
|
84
|
+
"tests/*" = ["D"]
|
|
85
|
+
"docs/*" = ["D"]
|
|
86
|
+
|
|
87
|
+
[tool.pytest]
|
|
88
|
+
minversion = "9.0"
|
|
89
|
+
strict = true
|
|
90
|
+
testpaths = ["tests"]
|
|
91
|
+
filterwarnings = ["error::RuntimeWarning"]
|
|
@@ -0,0 +1,92 @@
|
|
|
1
|
+
[project]
|
|
2
|
+
name = "fuzcolor"
|
|
3
|
+
version = "0.1.0"
|
|
4
|
+
description = "Simple and easy to use Python library for fuzzy color models."
|
|
5
|
+
readme = "README.md"
|
|
6
|
+
license = "MIT"
|
|
7
|
+
license-files = ["LICENSE"]
|
|
8
|
+
authors = [
|
|
9
|
+
{ name = "coredegon", email = "valikalik15@gmail.com" }
|
|
10
|
+
]
|
|
11
|
+
requires-python = ">=3.12"
|
|
12
|
+
dependencies = [
|
|
13
|
+
"fuzlog==0.3.1", # its interface is not stable yet
|
|
14
|
+
"matplotlib>=3.9",
|
|
15
|
+
"numpy>=2.0",
|
|
16
|
+
]
|
|
17
|
+
keywords = [
|
|
18
|
+
"fuzzy",
|
|
19
|
+
"fuzzy-logic",
|
|
20
|
+
"color",
|
|
21
|
+
"color-naming",
|
|
22
|
+
"color-palette",
|
|
23
|
+
"hsi",
|
|
24
|
+
"colibri",
|
|
25
|
+
]
|
|
26
|
+
classifiers = [
|
|
27
|
+
"Development Status :: 3 - Alpha",
|
|
28
|
+
"Intended Audience :: Developers",
|
|
29
|
+
"Intended Audience :: Science/Research",
|
|
30
|
+
"Operating System :: OS Independent",
|
|
31
|
+
"Programming Language :: Python :: 3 :: Only",
|
|
32
|
+
"Programming Language :: Python :: 3.12",
|
|
33
|
+
"Programming Language :: Python :: 3.13",
|
|
34
|
+
"Programming Language :: Python :: 3.14",
|
|
35
|
+
"Programming Language :: Python :: 3.15",
|
|
36
|
+
"Topic :: Scientific/Engineering",
|
|
37
|
+
"Topic :: Scientific/Engineering :: Image Processing",
|
|
38
|
+
"Typing :: Typed",
|
|
39
|
+
]
|
|
40
|
+
|
|
41
|
+
[project.urls]
|
|
42
|
+
Repository = "https://github.com/coredegon/fuzcolor"
|
|
43
|
+
Documentation = "https://github.com/coredegon/fuzcolor/tree/main/docs"
|
|
44
|
+
Issues = "https://github.com/coredegon/fuzcolor/issues"
|
|
45
|
+
|
|
46
|
+
[build-system]
|
|
47
|
+
requires = ["uv_build>=0.13.7,<0.14.0"]
|
|
48
|
+
build-backend = "uv_build"
|
|
49
|
+
|
|
50
|
+
[dependency-groups]
|
|
51
|
+
dev = [
|
|
52
|
+
"pytest>=9.2.0",
|
|
53
|
+
"ruff>=0.17.5",
|
|
54
|
+
"ty>=0.0.104",
|
|
55
|
+
]
|
|
56
|
+
|
|
57
|
+
[tool.ruff.lint]
|
|
58
|
+
select = [
|
|
59
|
+
"E", "W", # pycodestyle
|
|
60
|
+
"F", # pyflakes
|
|
61
|
+
"I", # import order
|
|
62
|
+
"N", # naming
|
|
63
|
+
"D", # docstrings
|
|
64
|
+
"UP", # modern syntax
|
|
65
|
+
"B", # likely bugs
|
|
66
|
+
"C4", # comprehensions
|
|
67
|
+
"SIM", # simplifications
|
|
68
|
+
"PT", # pytest style
|
|
69
|
+
"NPY", # numpy
|
|
70
|
+
"PERF", # performance
|
|
71
|
+
"RUF", # ruff's own
|
|
72
|
+
]
|
|
73
|
+
ignore = [
|
|
74
|
+
"D105", # operators are documented by their class
|
|
75
|
+
"D107", # and so is __init__
|
|
76
|
+
]
|
|
77
|
+
|
|
78
|
+
[tool.ruff.lint.pydocstyle]
|
|
79
|
+
convention = "google"
|
|
80
|
+
|
|
81
|
+
[tool.ruff.lint.per-file-ignores]
|
|
82
|
+
"tests/*" = ["D"]
|
|
83
|
+
"docs/*" = ["D"]
|
|
84
|
+
|
|
85
|
+
# ty needs no table: it checks against the oldest Python in `requires-python`
|
|
86
|
+
# and fails on warnings by default.
|
|
87
|
+
|
|
88
|
+
[tool.pytest]
|
|
89
|
+
minversion = "9.0"
|
|
90
|
+
strict = true
|
|
91
|
+
testpaths = ["tests"]
|
|
92
|
+
filterwarnings = ["error::RuntimeWarning"] # a leaked overflow or 0/0 is a bug
|
|
@@ -0,0 +1,40 @@
|
|
|
1
|
+
"""Fuzzy color models: the colors people name, as fuzzy sets.
|
|
2
|
+
|
|
3
|
+
```python
|
|
4
|
+
import fuzcolor as fc
|
|
5
|
+
from fuzcolor.models import COLIBRI
|
|
6
|
+
|
|
7
|
+
COLIBRI.label([200, 30, 30]) # "red/high/dark"
|
|
8
|
+
weights = fc.palette(COLIBRI, image) # the share of the image in every color
|
|
9
|
+
fc.pie(COLIBRI, weights)
|
|
10
|
+
```
|
|
11
|
+
|
|
12
|
+
- models: `Model`, built from the variables of fuzlog;
|
|
13
|
+
- spaces: `Space` and `HSI`;
|
|
14
|
+
- features: `palette`, `tabulate` and `Table`, the plots `plot`, `swatches`, `pie`;
|
|
15
|
+
- `fuzcolor.models`: the models that come with the library;
|
|
16
|
+
- `fuzcolor.math`: the color conversions as plain NumPy functions.
|
|
17
|
+
"""
|
|
18
|
+
|
|
19
|
+
from fuzcolor import features, math, models
|
|
20
|
+
from fuzcolor.features.palettes import palette
|
|
21
|
+
from fuzcolor.features.plots import pie, plot, swatches
|
|
22
|
+
from fuzcolor.features.tables import Table, tabulate
|
|
23
|
+
from fuzcolor.model import Model, only
|
|
24
|
+
from fuzcolor.spaces import HSI, Space
|
|
25
|
+
|
|
26
|
+
__all__ = [
|
|
27
|
+
"HSI",
|
|
28
|
+
"Model",
|
|
29
|
+
"Space",
|
|
30
|
+
"Table",
|
|
31
|
+
"features",
|
|
32
|
+
"math",
|
|
33
|
+
"models",
|
|
34
|
+
"only",
|
|
35
|
+
"palette",
|
|
36
|
+
"pie",
|
|
37
|
+
"plot",
|
|
38
|
+
"swatches",
|
|
39
|
+
"tabulate",
|
|
40
|
+
]
|
|
@@ -0,0 +1,41 @@
|
|
|
1
|
+
"""Palettes: how much of an image belongs to each color of a model."""
|
|
2
|
+
|
|
3
|
+
from __future__ import annotations
|
|
4
|
+
|
|
5
|
+
import numpy as np
|
|
6
|
+
from numpy.typing import ArrayLike
|
|
7
|
+
|
|
8
|
+
from fuzcolor.math import Array
|
|
9
|
+
from fuzcolor.model import Model
|
|
10
|
+
|
|
11
|
+
_BLOCK = 1 << 15 # pixels described at once: bounds the pixels x colors degrees
|
|
12
|
+
|
|
13
|
+
|
|
14
|
+
def palette(model: Model, image: ArrayLike, *, crisp: bool = False) -> Array:
|
|
15
|
+
"""Return the share of an image that belongs to each color of a model.
|
|
16
|
+
|
|
17
|
+
```python
|
|
18
|
+
weights = fc.palette(model, image) # weights[i] is of model.colors[i]
|
|
19
|
+
dict(zip(model.colors, weights))
|
|
20
|
+
```
|
|
21
|
+
|
|
22
|
+
The image has shape `(..., 3)`: 8-bit integers or floats in [0, 1]. Every
|
|
23
|
+
pixel adds its degrees, so a weight is the mean degree of the pixels in
|
|
24
|
+
that color. With `crisp` a pixel counts for its strongest color only, and
|
|
25
|
+
the weights are fractions of the pixels.
|
|
26
|
+
"""
|
|
27
|
+
pixels = np.asarray(image)
|
|
28
|
+
if pixels.ndim == 0 or pixels.shape[-1] != 3:
|
|
29
|
+
raise ValueError(f"RGB needs a last axis of 3 components, got {pixels.shape}")
|
|
30
|
+
pixels = pixels.reshape(-1, 3)
|
|
31
|
+
if not len(pixels):
|
|
32
|
+
raise ValueError("an image without pixels has no palette")
|
|
33
|
+
totals = np.zeros(len(model.colors))
|
|
34
|
+
for start in range(0, len(pixels), _BLOCK):
|
|
35
|
+
block = pixels[start : start + _BLOCK]
|
|
36
|
+
if crisp:
|
|
37
|
+
best = model.classify(block)
|
|
38
|
+
totals += np.bincount(best[best >= 0], minlength=len(totals))
|
|
39
|
+
else:
|
|
40
|
+
totals += model(block).sum(axis=1)
|
|
41
|
+
return totals / len(pixels)
|
|
@@ -0,0 +1,153 @@
|
|
|
1
|
+
"""Plots: matplotlib views of models and palettes.
|
|
2
|
+
|
|
3
|
+
Fonts, sizes and the colour of text follow matplotlib's configuration; what is
|
|
4
|
+
painted are the colors of the model themselves. Matplotlib is imported by the
|
|
5
|
+
first plot.
|
|
6
|
+
"""
|
|
7
|
+
|
|
8
|
+
from __future__ import annotations
|
|
9
|
+
|
|
10
|
+
import itertools
|
|
11
|
+
import math
|
|
12
|
+
from typing import TYPE_CHECKING
|
|
13
|
+
|
|
14
|
+
import fuzlog as fz
|
|
15
|
+
import numpy as np
|
|
16
|
+
from numpy.typing import ArrayLike
|
|
17
|
+
|
|
18
|
+
from fuzcolor.model import Model
|
|
19
|
+
|
|
20
|
+
if TYPE_CHECKING:
|
|
21
|
+
from matplotlib.axes import Axes
|
|
22
|
+
from matplotlib.figure import Figure
|
|
23
|
+
|
|
24
|
+
_OTHER = (0.76, 0.76, 0.72) # the slice of the colors too small to show
|
|
25
|
+
_EDGE = "#898781"
|
|
26
|
+
|
|
27
|
+
|
|
28
|
+
def plot(model: Model) -> Figure:
|
|
29
|
+
"""Draw the terms of a model: a row per family, a column per channel.
|
|
30
|
+
|
|
31
|
+
```python
|
|
32
|
+
fc.plot(COLIBRI)
|
|
33
|
+
```
|
|
34
|
+
"""
|
|
35
|
+
import matplotlib.pyplot as plt
|
|
36
|
+
|
|
37
|
+
channels = list(model.space.channels)
|
|
38
|
+
figure, axes = plt.subplots(
|
|
39
|
+
len(model.families),
|
|
40
|
+
len(channels),
|
|
41
|
+
squeeze=False,
|
|
42
|
+
figsize=(4.2 * len(channels), 2.6 * len(model.families)),
|
|
43
|
+
layout="constrained",
|
|
44
|
+
)
|
|
45
|
+
for row, family in zip(axes, model.families, strict=True):
|
|
46
|
+
described = {variable.name: variable for variable in family.variables}
|
|
47
|
+
for ax, channel in zip(row, channels, strict=True):
|
|
48
|
+
if channel in described:
|
|
49
|
+
fz.plot(described[channel], ax)
|
|
50
|
+
else:
|
|
51
|
+
ax.set_axis_off()
|
|
52
|
+
shown = next(ax for ax in row if ax.axison)
|
|
53
|
+
shown.set_ylabel(f"{family.name}\nmembership")
|
|
54
|
+
figure.suptitle(f"{model.name}: {len(model.colors)} colors")
|
|
55
|
+
return figure
|
|
56
|
+
|
|
57
|
+
|
|
58
|
+
def swatches(model: Model) -> Figure:
|
|
59
|
+
"""Draw the typical color of every color of a model, a panel per family.
|
|
60
|
+
|
|
61
|
+
```python
|
|
62
|
+
fc.swatches(COLIBRI)
|
|
63
|
+
```
|
|
64
|
+
|
|
65
|
+
The terms of a family's first variable run across, the combinations of the
|
|
66
|
+
terms of its other variables run down.
|
|
67
|
+
"""
|
|
68
|
+
import matplotlib.pyplot as plt
|
|
69
|
+
|
|
70
|
+
across = [len(family.variables[0].terms) for family in model.families]
|
|
71
|
+
down = [
|
|
72
|
+
len(family.colors) // n
|
|
73
|
+
for family, n in zip(model.families, across, strict=True)
|
|
74
|
+
]
|
|
75
|
+
figure, axes = plt.subplots(
|
|
76
|
+
len(model.families),
|
|
77
|
+
1,
|
|
78
|
+
squeeze=False,
|
|
79
|
+
figsize=(1.1 * max(across) + 2.0, 0.45 * sum(down) + 0.9 * len(down)),
|
|
80
|
+
height_ratios=down,
|
|
81
|
+
layout="constrained",
|
|
82
|
+
)
|
|
83
|
+
blocks = np.split(model.prototypes(), np.cumsum(np.multiply(across, down))[:-1])
|
|
84
|
+
for ax, family, block, columns in zip(
|
|
85
|
+
axes[:, 0], model.families, blocks, across, strict=True
|
|
86
|
+
):
|
|
87
|
+
first, *rest = family.variables
|
|
88
|
+
names = itertools.product(*(variable.terms for variable in rest))
|
|
89
|
+
grid = block.reshape(columns, -1, 3).swapaxes(0, 1)
|
|
90
|
+
ax.imshow(grid, aspect="auto")
|
|
91
|
+
ax.set_xticks(range(columns), labels=list(first.terms))
|
|
92
|
+
ax.set_yticks(range(len(grid)), labels=[", ".join(name) for name in names])
|
|
93
|
+
ax.xaxis.tick_top()
|
|
94
|
+
ax.set_xticks(np.arange(0.5, columns - 1), minor=True)
|
|
95
|
+
ax.set_yticks(np.arange(0.5, len(grid) - 1), minor=True)
|
|
96
|
+
ax.grid(which="minor", color=ax.get_facecolor(), linewidth=2)
|
|
97
|
+
ax.tick_params(which="both", length=0)
|
|
98
|
+
ax.set_title(family.name, loc="left")
|
|
99
|
+
ax.spines[:].set(color=_EDGE, linewidth=0.5)
|
|
100
|
+
figure.suptitle(f"{model.name}: {len(model.colors)} colors")
|
|
101
|
+
return figure
|
|
102
|
+
|
|
103
|
+
|
|
104
|
+
def pie(
|
|
105
|
+
model: Model, weights: ArrayLike, ax: Axes | None = None, *, least: float = 0.02
|
|
106
|
+
) -> Axes:
|
|
107
|
+
"""Draw a palette as a pie whose slices wear the colors they stand for.
|
|
108
|
+
|
|
109
|
+
```python
|
|
110
|
+
fc.pie(COLIBRI, fc.palette(COLIBRI, image))
|
|
111
|
+
```
|
|
112
|
+
|
|
113
|
+
Colors with a share below `least` are summed into one gray slice.
|
|
114
|
+
"""
|
|
115
|
+
import matplotlib.pyplot as plt
|
|
116
|
+
|
|
117
|
+
shares = np.asarray(weights, dtype=np.float64)
|
|
118
|
+
if shares.shape != (len(model.colors),):
|
|
119
|
+
raise ValueError(
|
|
120
|
+
f"a palette of {model.name} has {len(model.colors)} weights, "
|
|
121
|
+
f"got the shape {shares.shape}"
|
|
122
|
+
)
|
|
123
|
+
ranked = np.argsort(-shares, kind="stable")
|
|
124
|
+
shown = [int(i) for i in ranked if shares[i] > 0.0 and shares[i] >= least]
|
|
125
|
+
sizes = shares[shown].tolist()
|
|
126
|
+
names = [model.colors[i] for i in shown]
|
|
127
|
+
fills = [tuple(rgb) for rgb in model.prototypes()[shown].tolist()]
|
|
128
|
+
rest = float(shares.sum()) - sum(sizes)
|
|
129
|
+
if rest > 1e-9:
|
|
130
|
+
sizes.append(rest)
|
|
131
|
+
names.append("other")
|
|
132
|
+
fills.append(_OTHER)
|
|
133
|
+
if ax is None:
|
|
134
|
+
_, ax = plt.subplots(figsize=(6, 6), layout="constrained")
|
|
135
|
+
_, _, percents = ax.pie(
|
|
136
|
+
sizes,
|
|
137
|
+
labels=names,
|
|
138
|
+
colors=fills,
|
|
139
|
+
autopct="%.0f%%",
|
|
140
|
+
pctdistance=0.8,
|
|
141
|
+
startangle=90,
|
|
142
|
+
counterclock=False,
|
|
143
|
+
wedgeprops={"edgecolor": _EDGE, "linewidth": 0.5},
|
|
144
|
+
)
|
|
145
|
+
for percent, fill in zip(percents, fills, strict=True):
|
|
146
|
+
dark = (
|
|
147
|
+
math.fsum(
|
|
148
|
+
w * c for w, c in zip((0.2126, 0.7152, 0.0722), fill, strict=True)
|
|
149
|
+
)
|
|
150
|
+
< 0.5
|
|
151
|
+
)
|
|
152
|
+
percent.set_color("white" if dark else "black")
|
|
153
|
+
return ax
|
|
@@ -0,0 +1,64 @@
|
|
|
1
|
+
"""Tables: a model worked out once for every 8-bit color."""
|
|
2
|
+
|
|
3
|
+
from __future__ import annotations
|
|
4
|
+
|
|
5
|
+
from typing import Any
|
|
6
|
+
|
|
7
|
+
import fuzlog as fz
|
|
8
|
+
import numpy as np
|
|
9
|
+
from numpy.typing import ArrayLike
|
|
10
|
+
|
|
11
|
+
from fuzcolor.math import Array
|
|
12
|
+
from fuzcolor.model import Model
|
|
13
|
+
|
|
14
|
+
NONE = 255 # what a table holds for a pixel that belongs to no color
|
|
15
|
+
|
|
16
|
+
|
|
17
|
+
class Table(fz.Table):
|
|
18
|
+
"""The strongest color of every 8-bit pixel, looked up; `tabulate` makes one.
|
|
19
|
+
|
|
20
|
+
```python
|
|
21
|
+
table = fc.tabulate(model)
|
|
22
|
+
table(image) # as model.classify(image), for 8-bit pixels
|
|
23
|
+
table.save("colibri.npz")
|
|
24
|
+
table = fc.Table.load("colibri.npz")
|
|
25
|
+
```
|
|
26
|
+
|
|
27
|
+
It is a fuzlog table over `red`, `green` and `blue` that also takes pixels
|
|
28
|
+
of shape `(..., 3)`. It answers with `uint8` positions in `model.colors`,
|
|
29
|
+
and with `NONE`, 255, for a pixel that belongs to no color.
|
|
30
|
+
"""
|
|
31
|
+
|
|
32
|
+
__slots__ = ()
|
|
33
|
+
|
|
34
|
+
def __call__(self, rgb: ArrayLike | None = None, /, **inputs: ArrayLike) -> Any:
|
|
35
|
+
"""Look up the strongest color of 8-bit pixels."""
|
|
36
|
+
if rgb is None:
|
|
37
|
+
return super().__call__(**inputs)
|
|
38
|
+
pixels = np.asarray(rgb)
|
|
39
|
+
if pixels.dtype != np.uint8 or pixels.ndim == 0 or pixels.shape[-1] != 3:
|
|
40
|
+
raise TypeError(
|
|
41
|
+
f"a table takes 8-bit pixels of shape (..., 3), "
|
|
42
|
+
f"got {pixels.dtype} of shape {pixels.shape}"
|
|
43
|
+
)
|
|
44
|
+
return self.values[pixels[..., 0], pixels[..., 1], pixels[..., 2]]
|
|
45
|
+
|
|
46
|
+
|
|
47
|
+
def tabulate(model: Model) -> Table:
|
|
48
|
+
"""Classify every 8-bit color with a model and keep the answers in a `Table`.
|
|
49
|
+
|
|
50
|
+
```python
|
|
51
|
+
table = fc.tabulate(model) # 256 x 256 x 256 of uint8: 16 MB, in seconds
|
|
52
|
+
```
|
|
53
|
+
"""
|
|
54
|
+
if len(model.colors) > NONE:
|
|
55
|
+
raise ValueError(f"a table counts up to {NONE} colors, got {len(model.colors)}")
|
|
56
|
+
|
|
57
|
+
def strongest(red: Array, green: Array, blue: Array) -> Array:
|
|
58
|
+
best = model.classify(np.stack([red, green, blue], axis=-1) / 255.0)
|
|
59
|
+
return np.where(best < 0, NONE, best)
|
|
60
|
+
|
|
61
|
+
levels = (0, 255, 256)
|
|
62
|
+
axes = {"red": levels, "green": levels, "blue": levels}
|
|
63
|
+
made = fz.tabulate(strongest, axes, method="nearest", dtype=np.uint8)
|
|
64
|
+
return Table(made.axes, made.values, made.method, model.name)
|
|
@@ -0,0 +1,67 @@
|
|
|
1
|
+
"""Color conversions as plain NumPy functions.
|
|
2
|
+
|
|
3
|
+
Colors are arrays whose last axis holds the components. RGB with components in
|
|
4
|
+
[0, 1] is the exchange format: every other space converts from and to it.
|
|
5
|
+
"""
|
|
6
|
+
|
|
7
|
+
from __future__ import annotations
|
|
8
|
+
|
|
9
|
+
import math
|
|
10
|
+
|
|
11
|
+
import numpy as np
|
|
12
|
+
from numpy.typing import ArrayLike, NDArray
|
|
13
|
+
|
|
14
|
+
type Array = NDArray[np.float64]
|
|
15
|
+
|
|
16
|
+
_SQRT_3 = math.sqrt(3.0)
|
|
17
|
+
|
|
18
|
+
|
|
19
|
+
def as_rgb(colors: ArrayLike) -> Array:
|
|
20
|
+
"""Return colors as float RGB in [0, 1]: whole numbers are 8-bit levels."""
|
|
21
|
+
given = np.asarray(colors)
|
|
22
|
+
if given.ndim == 0 or given.shape[-1] != 3:
|
|
23
|
+
raise ValueError(f"RGB needs a last axis of 3 components, got {given.shape}")
|
|
24
|
+
if np.issubdtype(given.dtype, np.integer):
|
|
25
|
+
return given / 255.0
|
|
26
|
+
return given.astype(np.float64, copy=False)
|
|
27
|
+
|
|
28
|
+
|
|
29
|
+
def rgb_to_hsi(rgb: Array) -> Array:
|
|
30
|
+
"""Convert RGB in [0, 1] to hue in [0, 360), saturation and intensity in [0, 1].
|
|
31
|
+
|
|
32
|
+
Hue is the angle of the color around the gray axis, 0 for red. Grays get
|
|
33
|
+
hue 0 and black gets saturation 0.
|
|
34
|
+
"""
|
|
35
|
+
red, green, blue = rgb[..., 0], rgb[..., 1], rgb[..., 2]
|
|
36
|
+
intensity = (red + green + blue) / 3.0
|
|
37
|
+
weakest = np.minimum(np.minimum(red, green), blue)
|
|
38
|
+
gray = np.divide(
|
|
39
|
+
weakest, intensity, out=np.ones_like(intensity), where=intensity > 0
|
|
40
|
+
)
|
|
41
|
+
saturation = np.clip(1.0 - gray, 0.0, 1.0)
|
|
42
|
+
angle = np.arctan2(_SQRT_3 * (green - blue), 2.0 * red - green - blue)
|
|
43
|
+
hue = np.mod(np.degrees(angle), 360.0)
|
|
44
|
+
hue = np.where(hue < 360.0, hue, 0.0) # mod rounds tiny negative angles up to 360
|
|
45
|
+
return np.stack([hue, saturation, intensity], axis=-1)
|
|
46
|
+
|
|
47
|
+
|
|
48
|
+
def hsi_to_rgb(hsi: Array) -> Array:
|
|
49
|
+
"""Convert hue in degrees, saturation and intensity in [0, 1] to RGB.
|
|
50
|
+
|
|
51
|
+
Not every combination is a color: a light one cannot be saturated. Such
|
|
52
|
+
combinations give components above 1.
|
|
53
|
+
"""
|
|
54
|
+
hue, saturation, intensity = hsi[..., 0], hsi[..., 1], hsi[..., 2]
|
|
55
|
+
# Each third of the hue circle has its own weakest primary: blue, red, green.
|
|
56
|
+
third = np.floor_divide(hue, 120.0) % 3
|
|
57
|
+
angle = np.radians(hue - 120.0 * third)
|
|
58
|
+
weakest = intensity * (1.0 - saturation)
|
|
59
|
+
leading = intensity * (
|
|
60
|
+
1.0 + saturation * np.cos(angle) / np.cos(math.pi / 3 - angle)
|
|
61
|
+
)
|
|
62
|
+
remaining = 3.0 * intensity - (weakest + leading)
|
|
63
|
+
first, second = third == 0, third == 1
|
|
64
|
+
red = np.select([first, second], [leading, weakest], remaining)
|
|
65
|
+
green = np.select([first, second], [remaining, leading], weakest)
|
|
66
|
+
blue = np.select([first, second], [weakest, remaining], leading)
|
|
67
|
+
return np.stack([red, green, blue], axis=-1)
|
|
@@ -0,0 +1,229 @@
|
|
|
1
|
+
"""Fuzzy color models: colors as combinations of the terms of fuzlog variables."""
|
|
2
|
+
|
|
3
|
+
from __future__ import annotations
|
|
4
|
+
|
|
5
|
+
import itertools
|
|
6
|
+
import math
|
|
7
|
+
from collections.abc import Mapping, Sequence
|
|
8
|
+
from typing import Any
|
|
9
|
+
|
|
10
|
+
import fuzlog as fz
|
|
11
|
+
import numpy as np
|
|
12
|
+
from fuzlog.types import Norm
|
|
13
|
+
from numpy.typing import ArrayLike, NDArray
|
|
14
|
+
|
|
15
|
+
from fuzcolor.math import Array, as_rgb
|
|
16
|
+
from fuzcolor.spaces import Space
|
|
17
|
+
|
|
18
|
+
|
|
19
|
+
def only(variable: fz.Variable, *terms: str) -> fz.Variable:
|
|
20
|
+
"""Return a variable with just the named terms of another, in that order.
|
|
21
|
+
|
|
22
|
+
```python
|
|
23
|
+
only(saturation, "low", "medium", "high")
|
|
24
|
+
```
|
|
25
|
+
"""
|
|
26
|
+
unknown = [term for term in terms if term not in variable.terms]
|
|
27
|
+
if unknown or not terms:
|
|
28
|
+
raise ValueError(
|
|
29
|
+
f"{variable.name!r} has no terms {unknown}, only {list(variable.terms)}"
|
|
30
|
+
)
|
|
31
|
+
kept = {term: variable.terms[term] for term in terms}
|
|
32
|
+
return fz.Variable(
|
|
33
|
+
variable.name, variable.universe, kept, periodic=variable.periodic
|
|
34
|
+
)
|
|
35
|
+
|
|
36
|
+
|
|
37
|
+
class Family:
|
|
38
|
+
"""The colors made of one term from each variable; a `Model` makes its own.
|
|
39
|
+
|
|
40
|
+
A color is named after the terms that tell it apart from the others: a
|
|
41
|
+
variable with one term stays out of the name, and a family of one color
|
|
42
|
+
takes the name of the family.
|
|
43
|
+
"""
|
|
44
|
+
|
|
45
|
+
__slots__ = ("colors", "name", "variables")
|
|
46
|
+
|
|
47
|
+
def __init__(self, name: str, *variables: fz.Variable) -> None:
|
|
48
|
+
channels = [variable.name for variable in variables]
|
|
49
|
+
if not variables or len(set(channels)) < len(channels):
|
|
50
|
+
raise ValueError(
|
|
51
|
+
f"the family {name!r} needs variables of different channels, "
|
|
52
|
+
f"got {channels}"
|
|
53
|
+
)
|
|
54
|
+
self.name = name
|
|
55
|
+
self.variables = variables
|
|
56
|
+
telling = [len(variable.terms) > 1 for variable in variables]
|
|
57
|
+
self.colors = tuple(
|
|
58
|
+
"/".join(itertools.compress(terms, telling)) or name
|
|
59
|
+
for terms in itertools.product(*(variable.terms for variable in variables))
|
|
60
|
+
)
|
|
61
|
+
|
|
62
|
+
def degrees(
|
|
63
|
+
self, channels: Mapping[str, Array], tnorm: Norm = np.multiply
|
|
64
|
+
) -> Array:
|
|
65
|
+
"""Return the degree of every color: shape `(len(colors), *shape)`.
|
|
66
|
+
|
|
67
|
+
`channels` holds the values of every channel by name; the degrees of
|
|
68
|
+
the terms of a color are joined by `tnorm`.
|
|
69
|
+
"""
|
|
70
|
+
terms = [variable(channels[variable.name]) for variable in self.variables]
|
|
71
|
+
out = terms[0]
|
|
72
|
+
for more in terms[1:]: # every color so far with every term of the next
|
|
73
|
+
out = tnorm(out[:, None], more[None]).reshape(-1, *more.shape[1:])
|
|
74
|
+
return out
|
|
75
|
+
|
|
76
|
+
def strongest(
|
|
77
|
+
self, channels: Mapping[str, Array], tnorm: Norm = np.multiply
|
|
78
|
+
) -> tuple[NDArray[np.intp], Array]:
|
|
79
|
+
"""Return the position of the strongest color and its degree.
|
|
80
|
+
|
|
81
|
+
A t-norm never decreases, so the strongest color is made of the
|
|
82
|
+
strongest term of every variable: no other color has to be worked out.
|
|
83
|
+
"""
|
|
84
|
+
terms = [variable(channels[variable.name]) for variable in self.variables]
|
|
85
|
+
position, degree = terms[0].argmax(axis=0), terms[0].max(axis=0)
|
|
86
|
+
for more in terms[1:]:
|
|
87
|
+
position = position * len(more) + more.argmax(axis=0)
|
|
88
|
+
degree = tnorm(degree, more.max(axis=0))
|
|
89
|
+
return position, degree
|
|
90
|
+
|
|
91
|
+
def __repr__(self) -> str:
|
|
92
|
+
return f"Family({self.name!r}: {' x '.join(v.name for v in self.variables)})"
|
|
93
|
+
|
|
94
|
+
|
|
95
|
+
class Model:
|
|
96
|
+
"""A fuzzy color model: families of colors named in a color space.
|
|
97
|
+
|
|
98
|
+
```python
|
|
99
|
+
model = fc.Model(
|
|
100
|
+
"toy",
|
|
101
|
+
fc.HSI,
|
|
102
|
+
tint=[hue, fc.only(saturation, "pale", "vivid")],
|
|
103
|
+
gray=[intensity, fc.only(saturation, "gray")],
|
|
104
|
+
)
|
|
105
|
+
model.colors # ("red/pale", "red/vivid", ..., "dark", "light")
|
|
106
|
+
model([200, 30, 30]) # the degree of the pixel in every color
|
|
107
|
+
model.label([200, 30, 30]) # "red/vivid": its strongest color
|
|
108
|
+
```
|
|
109
|
+
|
|
110
|
+
A family is a list of fuzlog variables, each named after the channel of the
|
|
111
|
+
space that it describes; its colors take one term from each variable.
|
|
112
|
+
Pixels have shape `(..., 3)`: 8-bit integers or floats in [0, 1].
|
|
113
|
+
|
|
114
|
+
Args:
|
|
115
|
+
name: What the model is called.
|
|
116
|
+
space: The color space whose channels the variables describe.
|
|
117
|
+
tnorm: How the degrees of the terms of a color are joined. With the
|
|
118
|
+
product, families of partitions give degrees that sum to 1.
|
|
119
|
+
**families: The variables of every family, by the name of the family.
|
|
120
|
+
"""
|
|
121
|
+
|
|
122
|
+
__slots__ = ("_names", "colors", "families", "name", "space", "tnorm")
|
|
123
|
+
|
|
124
|
+
def __init__(
|
|
125
|
+
self,
|
|
126
|
+
name: str,
|
|
127
|
+
space: Space,
|
|
128
|
+
/,
|
|
129
|
+
*,
|
|
130
|
+
tnorm: Norm = np.multiply,
|
|
131
|
+
**families: Sequence[fz.Variable],
|
|
132
|
+
) -> None:
|
|
133
|
+
made = tuple(Family(key, *variables) for key, variables in families.items())
|
|
134
|
+
for family in made:
|
|
135
|
+
for variable in family.variables:
|
|
136
|
+
if space.channels.get(variable.name) != variable.universe:
|
|
137
|
+
raise ValueError(
|
|
138
|
+
f"{family.name!r}: {variable.name!r} on {variable.universe} "
|
|
139
|
+
f"is not a channel of {space.name}: {space.channels}"
|
|
140
|
+
)
|
|
141
|
+
colors = tuple(color for family in made for color in family.colors)
|
|
142
|
+
if not colors or len(set(colors)) < len(colors):
|
|
143
|
+
raise ValueError(f"{name!r} needs colors that differ, got {colors}")
|
|
144
|
+
self.name = name
|
|
145
|
+
self.space = space
|
|
146
|
+
self.families = made
|
|
147
|
+
self.tnorm = tnorm
|
|
148
|
+
self.colors = colors
|
|
149
|
+
self._names = np.array([*colors, ""]) # the last is what -1 counts to
|
|
150
|
+
|
|
151
|
+
def __call__(self, rgb: ArrayLike) -> Array:
|
|
152
|
+
"""Return the degree of the pixels in every color.
|
|
153
|
+
|
|
154
|
+
The shape is `(len(colors), *rgb.shape[:-1])`, so the result unpacks
|
|
155
|
+
into one array per color.
|
|
156
|
+
"""
|
|
157
|
+
channels = self._channels(rgb)
|
|
158
|
+
blocks = [family.degrees(channels, self.tnorm) for family in self.families]
|
|
159
|
+
return np.concatenate(blocks)
|
|
160
|
+
|
|
161
|
+
def classify(self, rgb: ArrayLike) -> NDArray[np.intp]:
|
|
162
|
+
"""Return the position in `colors` of the strongest color of every pixel.
|
|
163
|
+
|
|
164
|
+
A pixel that belongs to no color gets -1.
|
|
165
|
+
"""
|
|
166
|
+
channels = self._channels(rgb)
|
|
167
|
+
first = 0
|
|
168
|
+
best: NDArray[np.intp] = np.intp(-1) # ty: ignore[invalid-assignment]
|
|
169
|
+
degree: Array = np.float64(0.0) # ty: ignore[invalid-assignment]
|
|
170
|
+
for family in self.families:
|
|
171
|
+
position, strength = family.strongest(channels, self.tnorm)
|
|
172
|
+
best = np.where(strength > degree, first + position, best)
|
|
173
|
+
degree = np.maximum(degree, strength)
|
|
174
|
+
first += len(family.colors)
|
|
175
|
+
return best
|
|
176
|
+
|
|
177
|
+
def label(self, rgb: ArrayLike) -> Any:
|
|
178
|
+
"""Return the name of the strongest color of every pixel.
|
|
179
|
+
|
|
180
|
+
One pixel gives a string, more give an array of strings; a pixel that
|
|
181
|
+
belongs to no color gets an empty name.
|
|
182
|
+
"""
|
|
183
|
+
names = self._names[self.classify(rgb)]
|
|
184
|
+
return names if names.ndim else str(names)
|
|
185
|
+
|
|
186
|
+
def _channels(self, rgb: ArrayLike) -> dict[str, Array]:
|
|
187
|
+
"""The values of every channel of the space, by name."""
|
|
188
|
+
values = self.space.from_rgb(as_rgb(rgb))
|
|
189
|
+
return {name: values[..., i] for i, name in enumerate(self.space.channels)}
|
|
190
|
+
|
|
191
|
+
def prototypes(self) -> Array:
|
|
192
|
+
"""Return a typical RGB color for every color: shape `(len(colors), 3)`.
|
|
193
|
+
|
|
194
|
+
A channel takes the middle of the core of the color's term, or the
|
|
195
|
+
middle of its range if the family does not describe it. What is too
|
|
196
|
+
bright to be a color is darkened until it fits into RGB.
|
|
197
|
+
"""
|
|
198
|
+
middle = [(low + high) / 2 for low, high in self.space.channels.values()]
|
|
199
|
+
places = {channel: i for i, channel in enumerate(self.space.channels)}
|
|
200
|
+
rows = []
|
|
201
|
+
for family in self.families:
|
|
202
|
+
centers = [_centers(variable).tolist() for variable in family.variables]
|
|
203
|
+
for values in itertools.product(*centers):
|
|
204
|
+
row = list(middle)
|
|
205
|
+
for variable, value in zip(family.variables, values, strict=True):
|
|
206
|
+
row[places[variable.name]] = value
|
|
207
|
+
rows.append(row)
|
|
208
|
+
rgb = self.space.to_rgb(np.array(rows))
|
|
209
|
+
return np.clip(rgb / np.maximum(rgb.max(axis=-1, keepdims=True), 1.0), 0.0, 1.0)
|
|
210
|
+
|
|
211
|
+
def __repr__(self) -> str:
|
|
212
|
+
families = ", ".join(f"{len(f.colors)} {f.name}" for f in self.families)
|
|
213
|
+
return f"Model({self.name!r}, {self.space.name}: {families})"
|
|
214
|
+
|
|
215
|
+
|
|
216
|
+
def _centers(variable: fz.Variable) -> Array:
|
|
217
|
+
"""The most typical value of every term: the middle of where it is highest.
|
|
218
|
+
|
|
219
|
+
On a periodic universe the middle is found going around the circle.
|
|
220
|
+
"""
|
|
221
|
+
x = variable.grid(4001)
|
|
222
|
+
degrees = variable(x)
|
|
223
|
+
core = (degrees >= degrees.max(axis=1, keepdims=True) - 1e-9).astype(np.float64)
|
|
224
|
+
if not variable.periodic:
|
|
225
|
+
return (core @ x) / core.sum(axis=1)
|
|
226
|
+
low, high = variable.universe
|
|
227
|
+
angle = (x - low) * (math.tau / (high - low))
|
|
228
|
+
middle = np.arctan2(core @ np.sin(angle), core @ np.cos(angle)) % math.tau
|
|
229
|
+
return low + middle * ((high - low) / math.tau)
|
|
@@ -0,0 +1,69 @@
|
|
|
1
|
+
"""COLIBRI: the color categories of people, on the HSI space.
|
|
2
|
+
|
|
3
|
+
P. Shamoi et al., "COLIBRI Fuzzy Model: Color Linguistic-Based Representation
|
|
4
|
+
and Interpretation", IEEE Access 13, 2025 (arXiv:2507.11488). The partitions
|
|
5
|
+
of hue, saturation and intensity come from a large survey of how people name
|
|
6
|
+
colors.
|
|
7
|
+
|
|
8
|
+
A color of very low saturation is achromatic and named after its intensity
|
|
9
|
+
alone: black, dark gray, gray, light gray or white. Every other color is
|
|
10
|
+
chromatic and named after its hue, its saturation and a coarser intensity,
|
|
11
|
+
which gives 9 x 3 x 3 + 5 = 86 colors.
|
|
12
|
+
"""
|
|
13
|
+
|
|
14
|
+
import fuzlog as fz
|
|
15
|
+
|
|
16
|
+
from fuzcolor.model import Model, only
|
|
17
|
+
from fuzcolor.spaces import HSI
|
|
18
|
+
|
|
19
|
+
HUE = fz.partition(
|
|
20
|
+
"hue",
|
|
21
|
+
(0, 360),
|
|
22
|
+
{
|
|
23
|
+
"red": (350, 5),
|
|
24
|
+
"orange": (20, 35),
|
|
25
|
+
"yellow": 45,
|
|
26
|
+
"green": (65, 130),
|
|
27
|
+
"cyan": 175,
|
|
28
|
+
"light blue": 190,
|
|
29
|
+
"blue": (215, 240),
|
|
30
|
+
"violet": (270, 280),
|
|
31
|
+
"magenta": (320, 330),
|
|
32
|
+
},
|
|
33
|
+
periodic=True,
|
|
34
|
+
)
|
|
35
|
+
|
|
36
|
+
SATURATION = fz.partition(
|
|
37
|
+
"saturation",
|
|
38
|
+
(0, 1),
|
|
39
|
+
{"very low": 0, "low": 0.15, "medium": (0.375, 0.45), "high": (0.725, 1)},
|
|
40
|
+
)
|
|
41
|
+
|
|
42
|
+
INTENSITY = fz.partition(
|
|
43
|
+
"intensity",
|
|
44
|
+
(0, 1),
|
|
45
|
+
{
|
|
46
|
+
"black": (0, 30 / 255),
|
|
47
|
+
"dark gray": 75 / 255,
|
|
48
|
+
"gray": (110 / 255, 115 / 255),
|
|
49
|
+
"light gray": (190 / 255, 215 / 255),
|
|
50
|
+
"white": 1,
|
|
51
|
+
},
|
|
52
|
+
)
|
|
53
|
+
|
|
54
|
+
# Black with dark gray, gray, light gray with white: neighbours of a partition
|
|
55
|
+
# add up to a term whose core runs from the first core to the last.
|
|
56
|
+
SHADE = fz.partition(
|
|
57
|
+
"intensity",
|
|
58
|
+
(0, 1),
|
|
59
|
+
dark=(0, 75 / 255),
|
|
60
|
+
medium=(110 / 255, 115 / 255),
|
|
61
|
+
light=(190 / 255, 1),
|
|
62
|
+
)
|
|
63
|
+
|
|
64
|
+
COLIBRI = Model(
|
|
65
|
+
"COLIBRI",
|
|
66
|
+
HSI,
|
|
67
|
+
chromatic=[HUE, only(SATURATION, "low", "medium", "high"), SHADE],
|
|
68
|
+
achromatic=[INTENSITY, only(SATURATION, "very low")],
|
|
69
|
+
)
|
|
File without changes
|
|
@@ -0,0 +1,39 @@
|
|
|
1
|
+
"""Color spaces: named channels and the way from and to RGB."""
|
|
2
|
+
|
|
3
|
+
from __future__ import annotations
|
|
4
|
+
|
|
5
|
+
from collections.abc import Callable
|
|
6
|
+
from typing import NamedTuple
|
|
7
|
+
|
|
8
|
+
from fuzcolor.math import Array, hsi_to_rgb, rgb_to_hsi
|
|
9
|
+
|
|
10
|
+
|
|
11
|
+
class Space(NamedTuple):
|
|
12
|
+
"""A coordinate system for colors.
|
|
13
|
+
|
|
14
|
+
```python
|
|
15
|
+
HSI = Space(
|
|
16
|
+
"HSI",
|
|
17
|
+
{"hue": (0, 360), "saturation": (0, 1), "intensity": (0, 1)},
|
|
18
|
+
rgb_to_hsi,
|
|
19
|
+
hsi_to_rgb,
|
|
20
|
+
)
|
|
21
|
+
```
|
|
22
|
+
|
|
23
|
+
`channels` gives every coordinate its range, in the order of the last axis
|
|
24
|
+
that `from_rgb` returns and `to_rgb` takes. Both work on float arrays of
|
|
25
|
+
shape `(..., 3)`, with RGB in [0, 1].
|
|
26
|
+
"""
|
|
27
|
+
|
|
28
|
+
name: str
|
|
29
|
+
channels: dict[str, tuple[float, float]]
|
|
30
|
+
from_rgb: Callable[[Array], Array]
|
|
31
|
+
to_rgb: Callable[[Array], Array]
|
|
32
|
+
|
|
33
|
+
|
|
34
|
+
HSI = Space(
|
|
35
|
+
"HSI",
|
|
36
|
+
{"hue": (0.0, 360.0), "saturation": (0.0, 1.0), "intensity": (0.0, 1.0)},
|
|
37
|
+
rgb_to_hsi,
|
|
38
|
+
hsi_to_rgb,
|
|
39
|
+
)
|