foldmetrics 0.1.0__tar.gz
This diff represents the content of publicly available package versions that have been released to one of the supported registries. The information contained in this diff is provided for informational purposes only and reflects changes between package versions as they appear in their respective public registries.
- foldmetrics-0.1.0/.github/workflows/ci.yml +26 -0
- foldmetrics-0.1.0/.github/workflows/publish.yml +36 -0
- foldmetrics-0.1.0/.gitignore +30 -0
- foldmetrics-0.1.0/LICENSE +21 -0
- foldmetrics-0.1.0/PKG-INFO +241 -0
- foldmetrics-0.1.0/README.md +211 -0
- foldmetrics-0.1.0/docs/assets/demo_batch.png +0 -0
- foldmetrics-0.1.0/docs/assets/demo_comparison.png +0 -0
- foldmetrics-0.1.0/docs/assets/demo_summary.png +0 -0
- foldmetrics-0.1.0/examples/README.md +92 -0
- foldmetrics-0.1.0/examples/make_demo_data.py +207 -0
- foldmetrics-0.1.0/examples/python_api.py +72 -0
- foldmetrics-0.1.0/pyproject.toml +76 -0
- foldmetrics-0.1.0/src/foldmetrics/__init__.py +30 -0
- foldmetrics-0.1.0/src/foldmetrics/api.py +97 -0
- foldmetrics-0.1.0/src/foldmetrics/cli.py +274 -0
- foldmetrics-0.1.0/src/foldmetrics/metrics.py +390 -0
- foldmetrics-0.1.0/src/foldmetrics/models.py +155 -0
- foldmetrics-0.1.0/src/foldmetrics/parsers/__init__.py +120 -0
- foldmetrics-0.1.0/src/foldmetrics/parsers/alphafold2.py +211 -0
- foldmetrics-0.1.0/src/foldmetrics/parsers/alphafold3.py +175 -0
- foldmetrics-0.1.0/src/foldmetrics/parsers/base.py +140 -0
- foldmetrics-0.1.0/src/foldmetrics/parsers/boltz.py +136 -0
- foldmetrics-0.1.0/src/foldmetrics/parsers/chai.py +114 -0
- foldmetrics-0.1.0/src/foldmetrics/parsers/colabfold.py +92 -0
- foldmetrics-0.1.0/src/foldmetrics/parsers/protenix.py +111 -0
- foldmetrics-0.1.0/src/foldmetrics/parsers/structure.py +122 -0
- foldmetrics-0.1.0/src/foldmetrics/py.typed +0 -0
- foldmetrics-0.1.0/src/foldmetrics/render.py +115 -0
- foldmetrics-0.1.0/src/foldmetrics/viz.py +510 -0
- foldmetrics-0.1.0/tests/conftest.py +265 -0
- foldmetrics-0.1.0/tests/test_cli.py +78 -0
- foldmetrics-0.1.0/tests/test_metrics.py +139 -0
- foldmetrics-0.1.0/tests/test_parsers.py +130 -0
|
@@ -0,0 +1,26 @@
|
|
|
1
|
+
name: CI
|
|
2
|
+
|
|
3
|
+
on:
|
|
4
|
+
push:
|
|
5
|
+
branches: [main]
|
|
6
|
+
pull_request:
|
|
7
|
+
|
|
8
|
+
jobs:
|
|
9
|
+
test:
|
|
10
|
+
runs-on: ${{ matrix.os }}
|
|
11
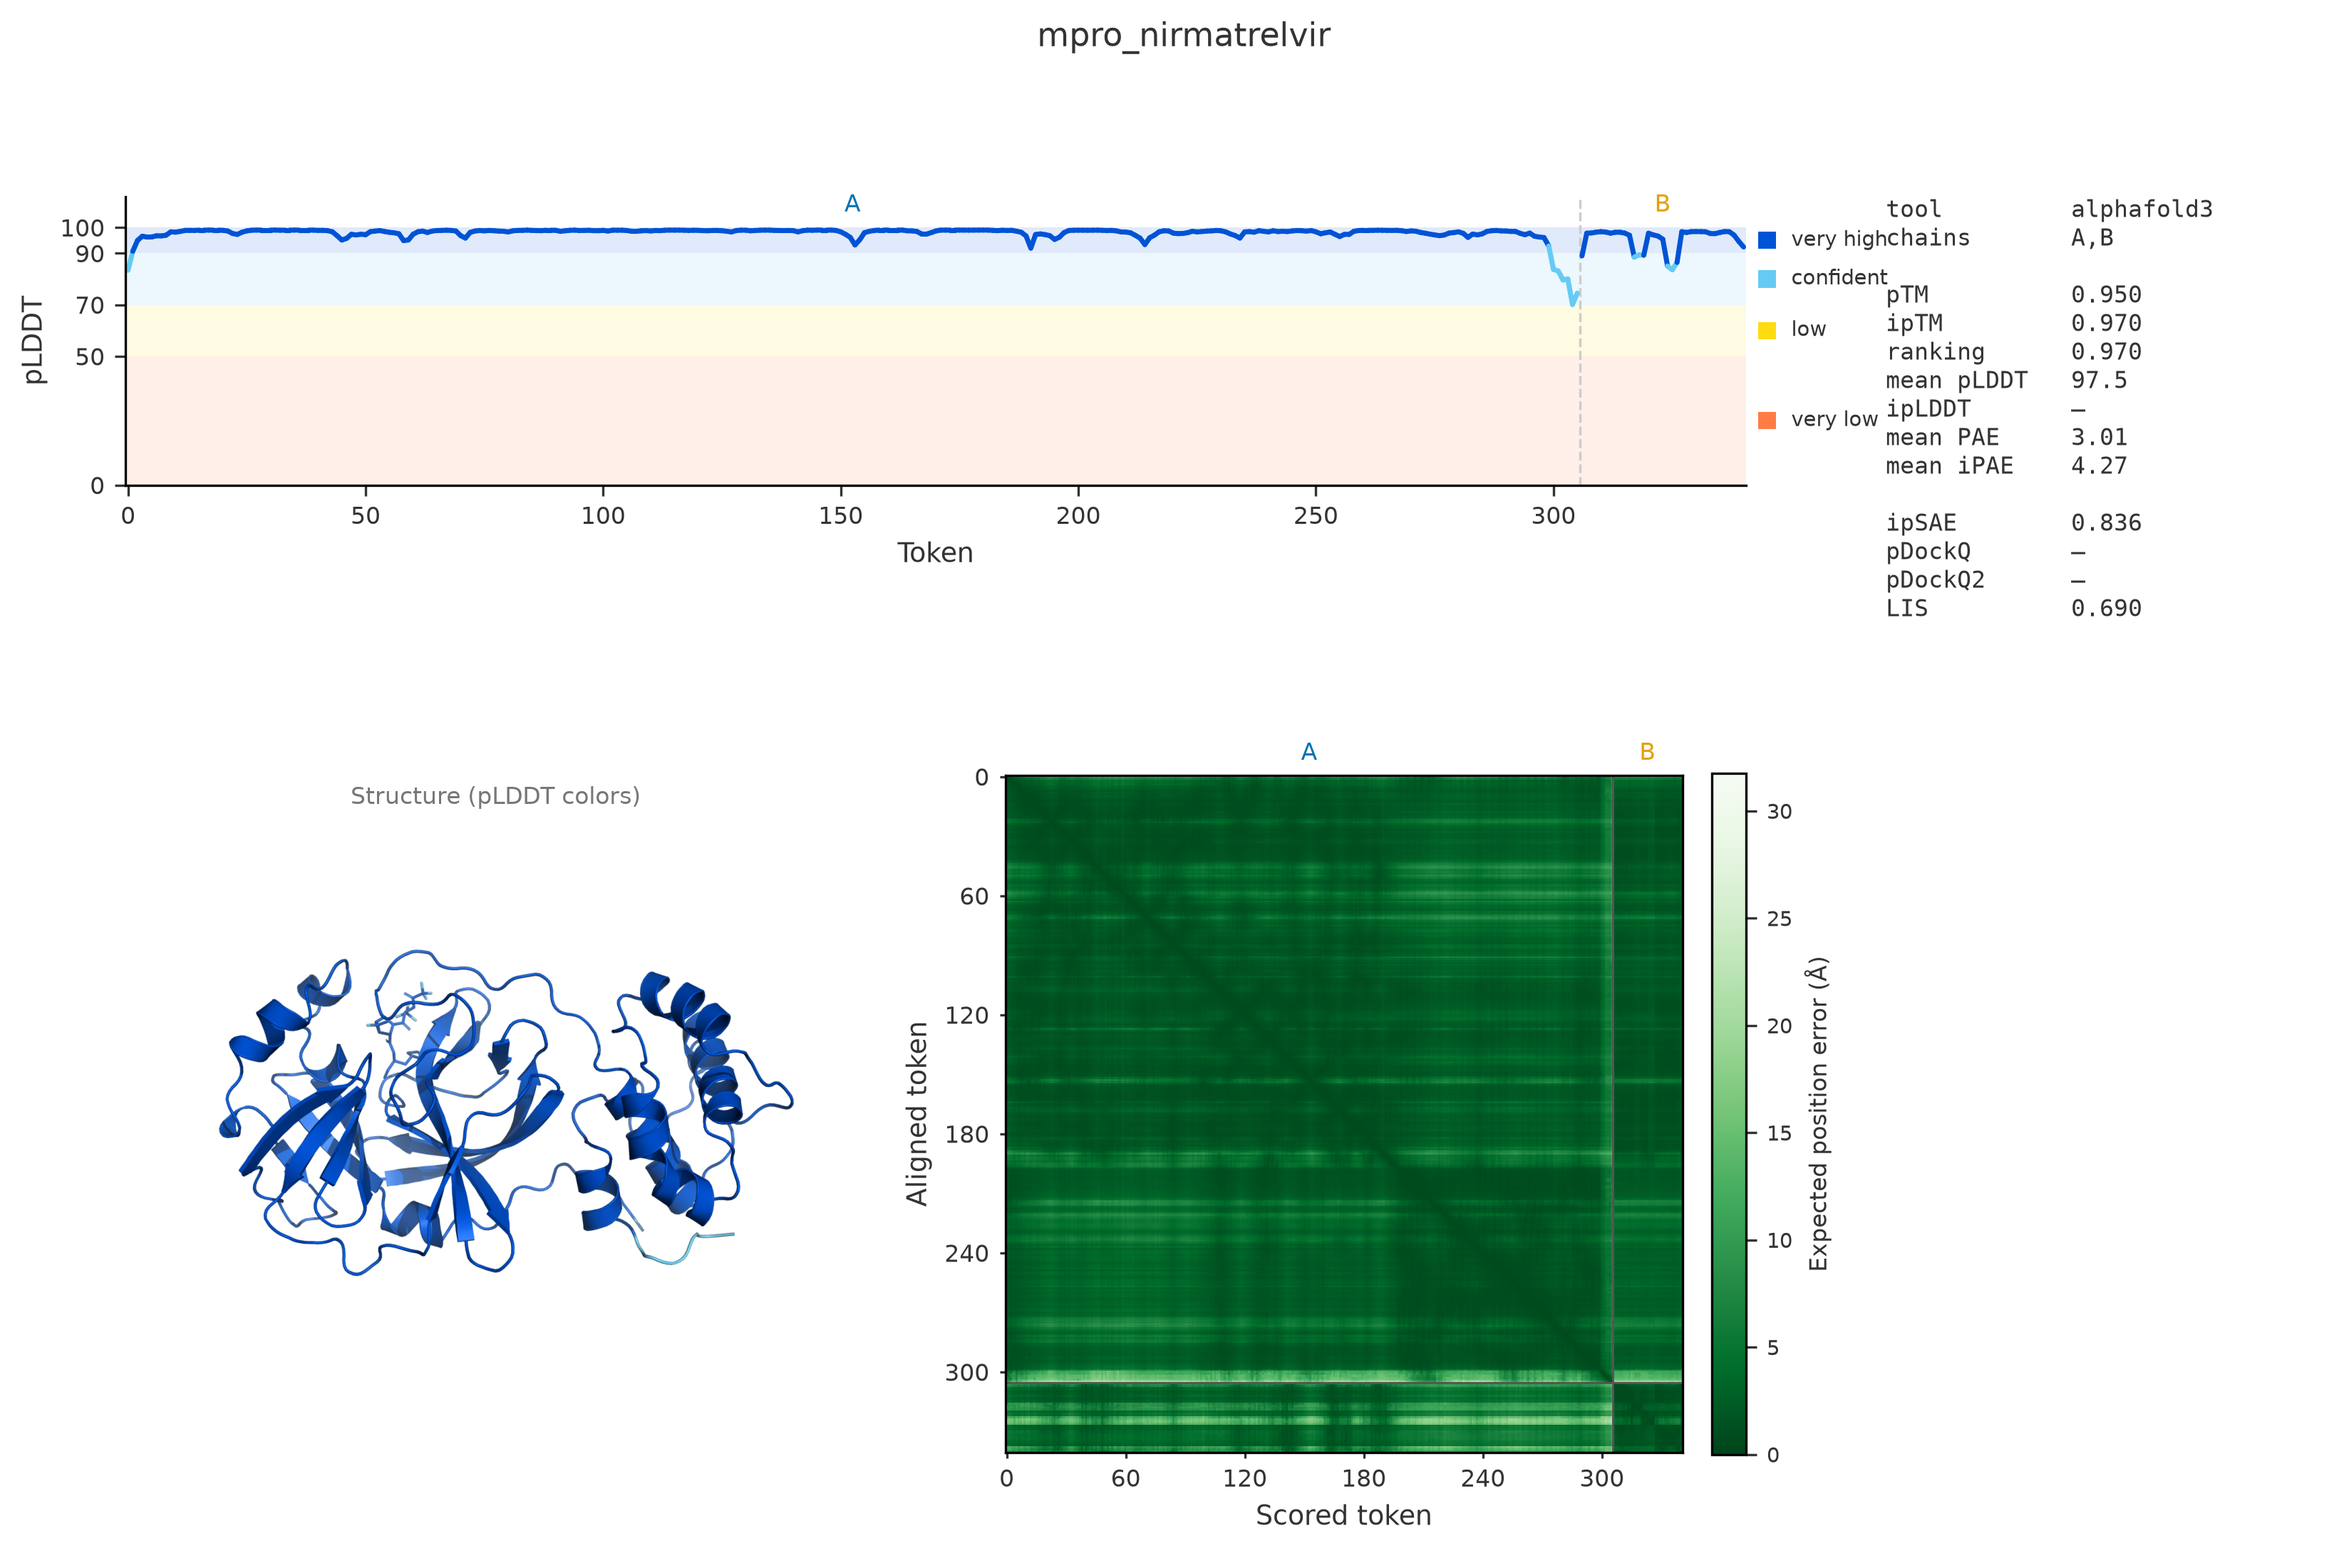
|
+
strategy:
|
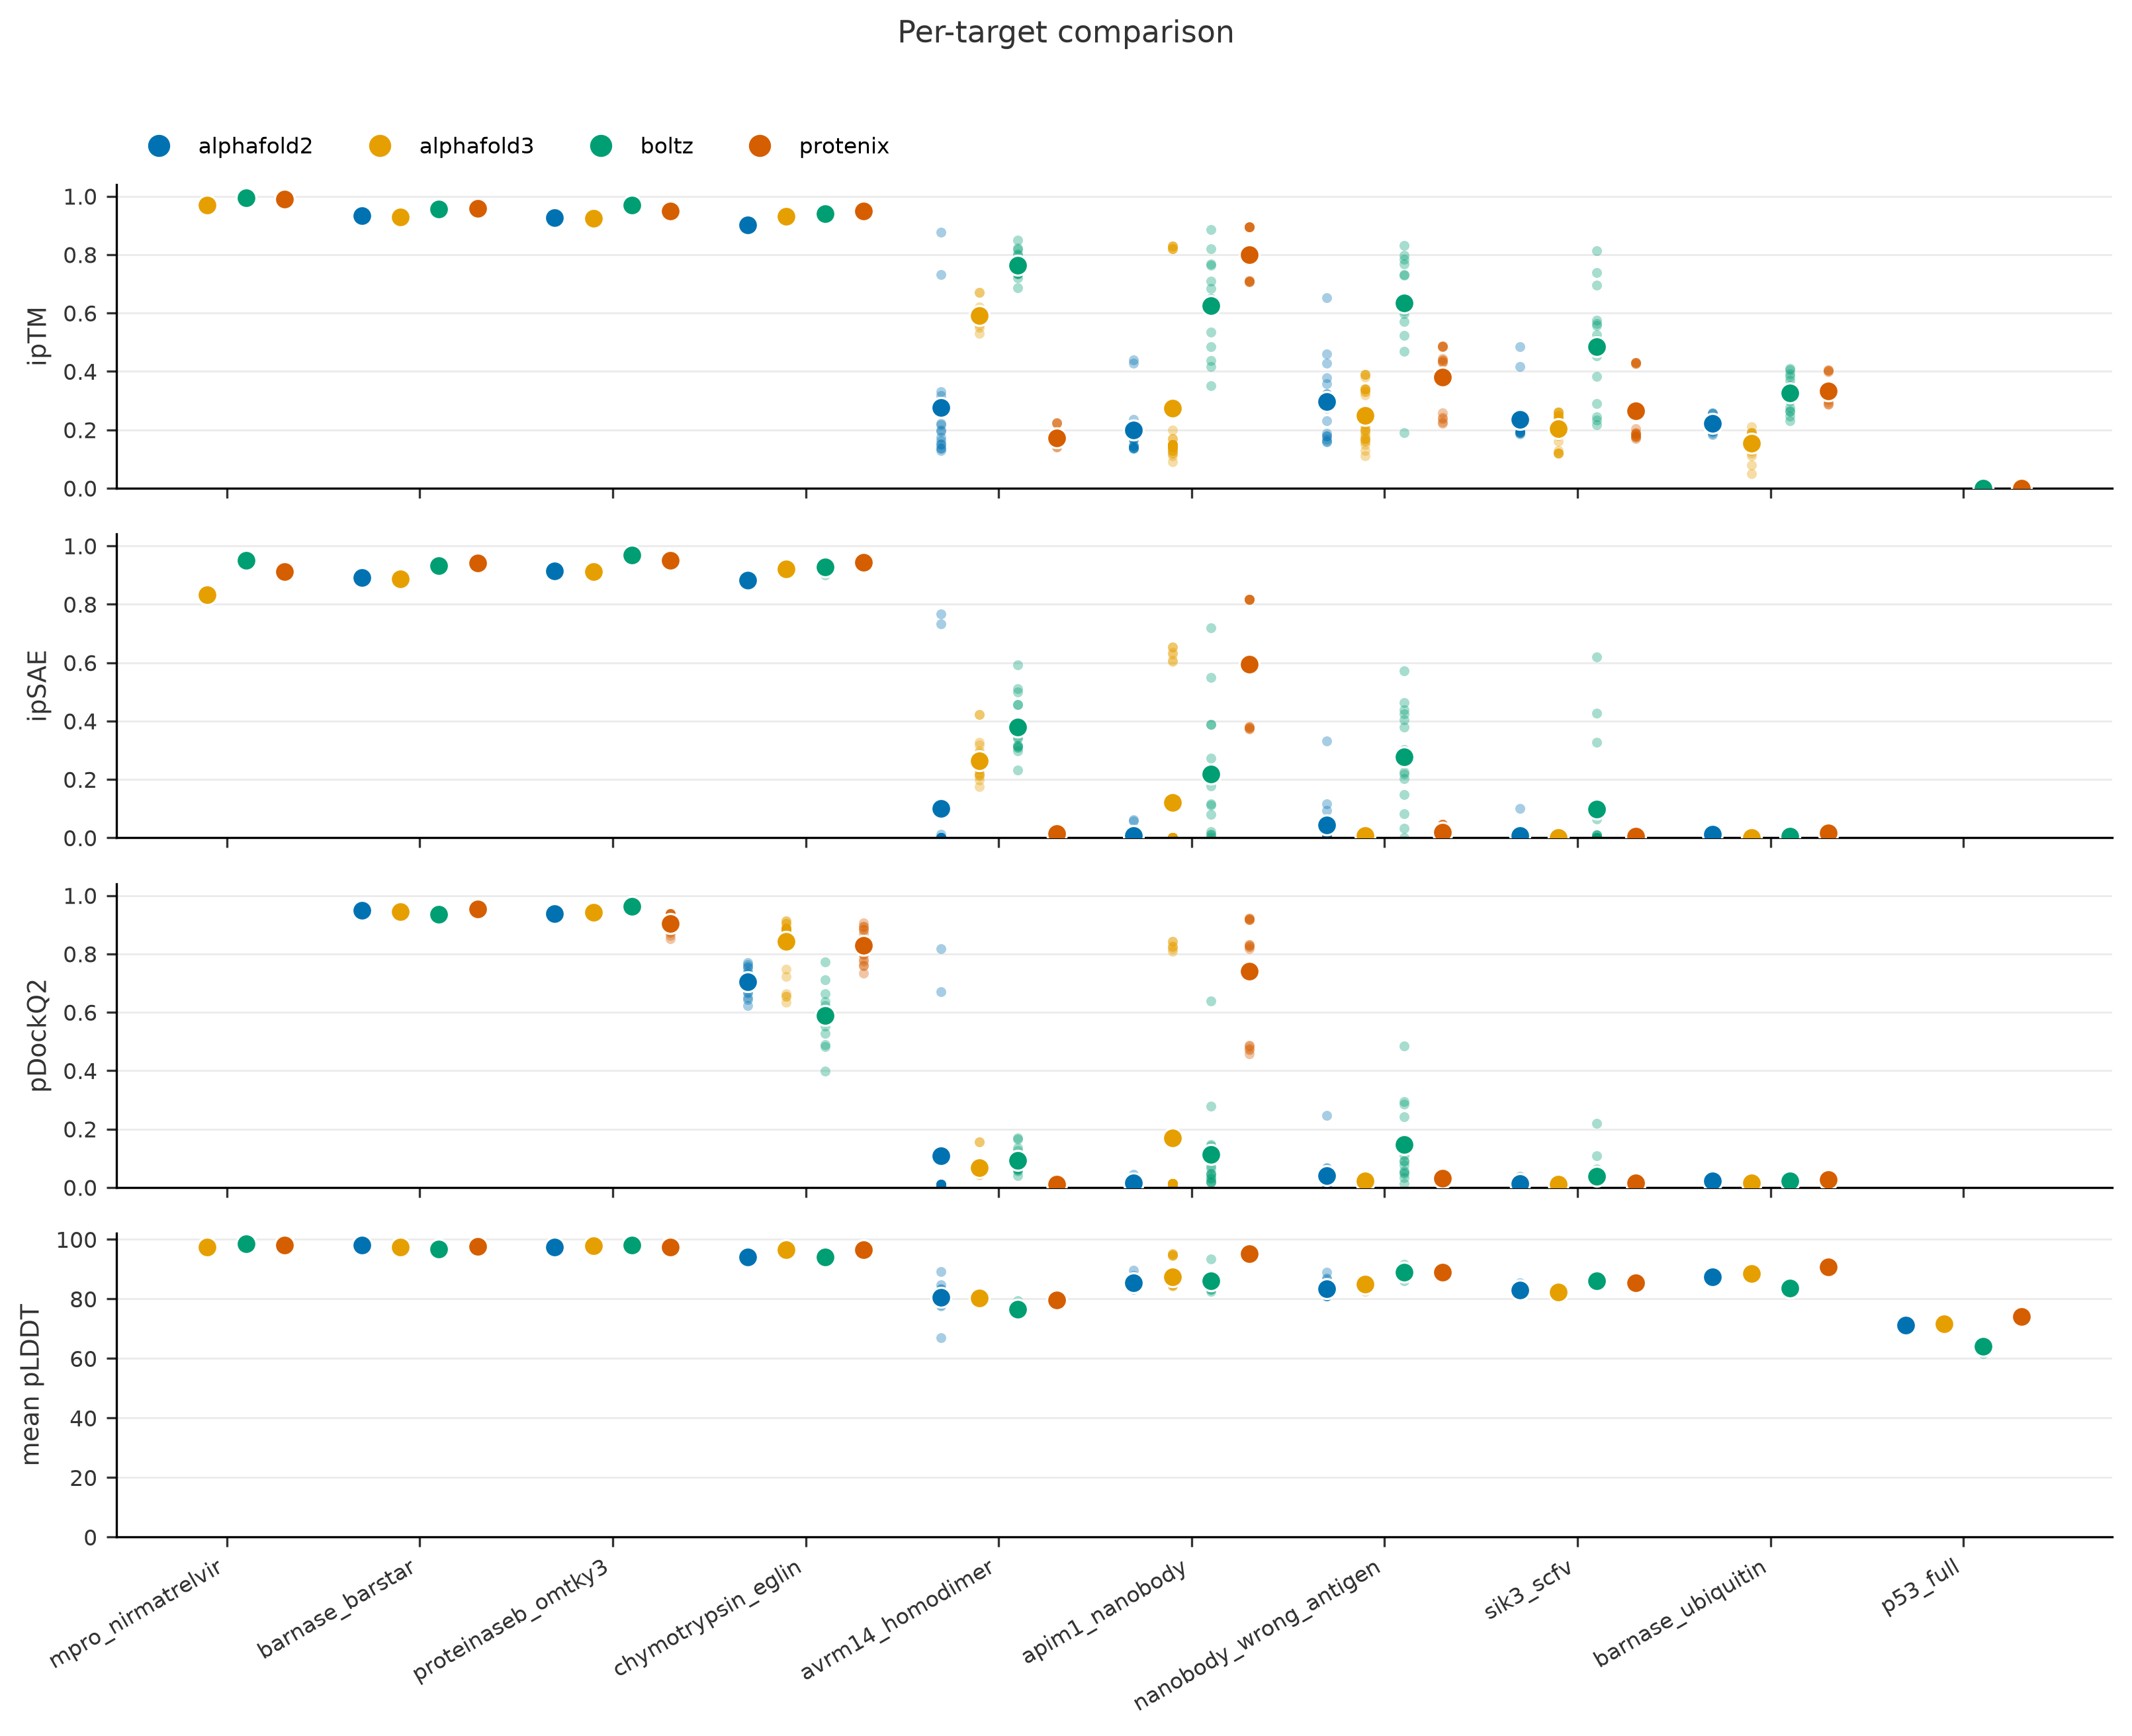
|
12
|
+
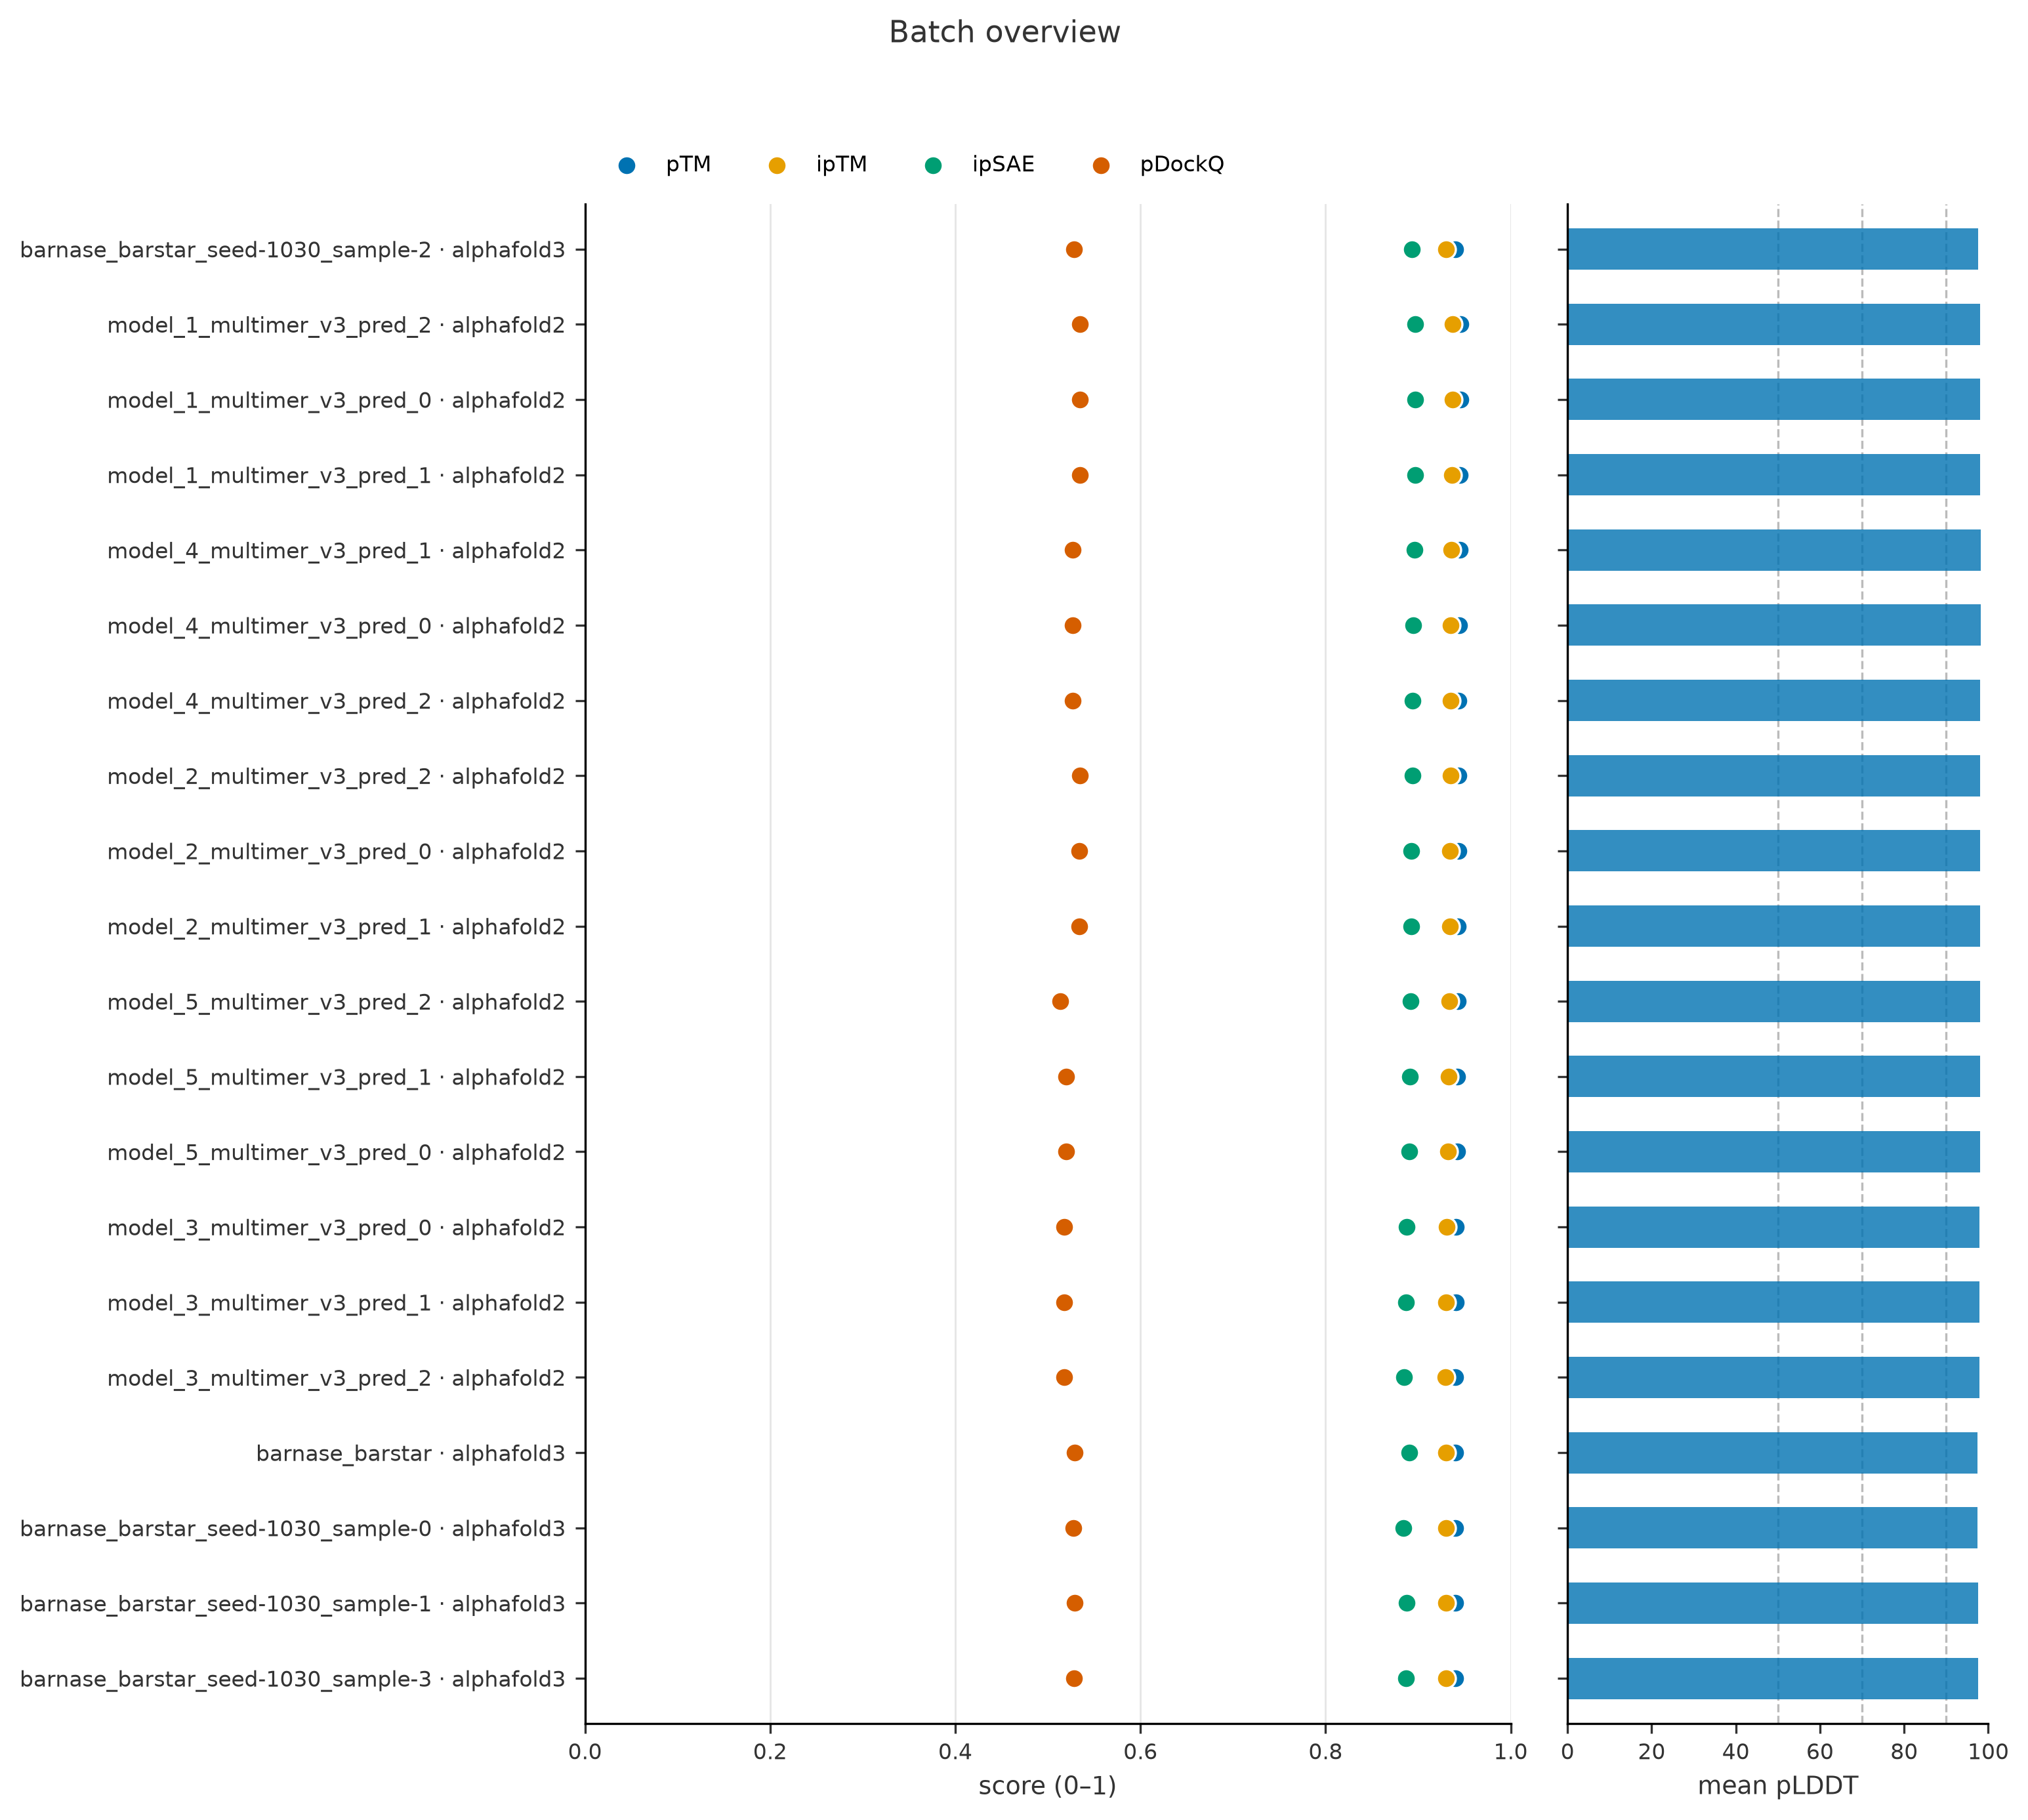
fail-fast: false
|
|
13
|
+
matrix:
|
|
14
|
+
os: [ubuntu-latest, macos-latest]
|
|
15
|
+
python: ["3.10", "3.13"]
|
|
16
|
+
steps:
|
|
17
|
+
- uses: actions/checkout@v4
|
|
18
|
+
- uses: astral-sh/setup-uv@v5
|
|
19
|
+
- name: Install
|
|
20
|
+
run: |
|
|
21
|
+
uv venv --python ${{ matrix.python }}
|
|
22
|
+
uv pip install -e ".[dev]"
|
|
23
|
+
- name: Test
|
|
24
|
+
run: .venv/bin/pytest
|
|
25
|
+
- name: Lint
|
|
26
|
+
run: .venv/bin/ruff check src tests examples
|
|
@@ -0,0 +1,36 @@
|
|
|
1
|
+
name: Publish to PyPI
|
|
2
|
+
|
|
3
|
+
# Triggered by pushing a version tag, e.g.: git push origin v0.1.0
|
|
4
|
+
# Requires a PyPI "trusted publisher" configured for this repository
|
|
5
|
+
# (project: foldmetrics, workflow: publish.yml, environment: pypi).
|
|
6
|
+
on:
|
|
7
|
+
push:
|
|
8
|
+
tags: ["v*"]
|
|
9
|
+
|
|
10
|
+
jobs:
|
|
11
|
+
build:
|
|
12
|
+
runs-on: ubuntu-latest
|
|
13
|
+
steps:
|
|
14
|
+
- uses: actions/checkout@v4
|
|
15
|
+
- uses: astral-sh/setup-uv@v5
|
|
16
|
+
- name: Build sdist and wheel
|
|
17
|
+
run: uv build
|
|
18
|
+
- uses: actions/upload-artifact@v4
|
|
19
|
+
with:
|
|
20
|
+
name: dist
|
|
21
|
+
path: dist/
|
|
22
|
+
|
|
23
|
+
publish:
|
|
24
|
+
needs: build
|
|
25
|
+
runs-on: ubuntu-latest
|
|
26
|
+
environment:
|
|
27
|
+
name: pypi
|
|
28
|
+
url: https://pypi.org/p/foldmetrics
|
|
29
|
+
permissions:
|
|
30
|
+
id-token: write
|
|
31
|
+
steps:
|
|
32
|
+
- uses: actions/download-artifact@v4
|
|
33
|
+
with:
|
|
34
|
+
name: dist
|
|
35
|
+
path: dist/
|
|
36
|
+
- uses: pypa/gh-action-pypi-publish@release/v1
|
|
@@ -0,0 +1,30 @@
|
|
|
1
|
+
# Python
|
|
2
|
+
__pycache__/
|
|
3
|
+
*.py[cod]
|
|
4
|
+
*.egg-info/
|
|
5
|
+
.eggs/
|
|
6
|
+
build/
|
|
7
|
+
dist/
|
|
8
|
+
.venv/
|
|
9
|
+
venv/
|
|
10
|
+
|
|
11
|
+
# Tooling caches
|
|
12
|
+
.pytest_cache/
|
|
13
|
+
.ruff_cache/
|
|
14
|
+
.mypy_cache/
|
|
15
|
+
.coverage
|
|
16
|
+
htmlcov/
|
|
17
|
+
|
|
18
|
+
# Editors / OS
|
|
19
|
+
.DS_Store
|
|
20
|
+
.idea/
|
|
21
|
+
.vscode/
|
|
22
|
+
|
|
23
|
+
# Local working notes (not part of the published project)
|
|
24
|
+
CLAUDE.md
|
|
25
|
+
.claude/
|
|
26
|
+
|
|
27
|
+
# Local outputs
|
|
28
|
+
foldmetrics_plots/
|
|
29
|
+
*.tsv
|
|
30
|
+
!tests/**/*.tsv
|
|
@@ -0,0 +1,21 @@
|
|
|
1
|
+
MIT License
|
|
2
|
+
|
|
3
|
+
Copyright (c) 2026 Jiajun Li
|
|
4
|
+
|
|
5
|
+
Permission is hereby granted, free of charge, to any person obtaining a copy
|
|
6
|
+
of this software and associated documentation files (the "Software"), to deal
|
|
7
|
+
in the Software without restriction, including without limitation the rights
|
|
8
|
+
to use, copy, modify, merge, publish, distribute, sublicense, and/or sell
|
|
9
|
+
copies of the Software, and to permit persons to whom the Software is
|
|
10
|
+
furnished to do so, subject to the following conditions:
|
|
11
|
+
|
|
12
|
+
The above copyright notice and this permission notice shall be included in all
|
|
13
|
+
copies or substantial portions of the Software.
|
|
14
|
+
|
|
15
|
+
THE SOFTWARE IS PROVIDED "AS IS", WITHOUT WARRANTY OF ANY KIND, EXPRESS OR
|
|
16
|
+
IMPLIED, INCLUDING BUT NOT LIMITED TO THE WARRANTIES OF MERCHANTABILITY,
|
|
17
|
+
FITNESS FOR A PARTICULAR PURPOSE AND NONINFRINGEMENT. IN NO EVENT SHALL THE
|
|
18
|
+
AUTHORS OR COPYRIGHT HOLDERS BE LIABLE FOR ANY CLAIM, DAMAGES OR OTHER
|
|
19
|
+
LIABILITY, WHETHER IN AN ACTION OF CONTRACT, TORT OR OTHERWISE, ARISING FROM,
|
|
20
|
+
OUT OF OR IN CONNECTION WITH THE SOFTWARE OR THE USE OR OTHER DEALINGS IN THE
|
|
21
|
+
SOFTWARE.
|
|
@@ -0,0 +1,241 @@
|
|
|
1
|
+
Metadata-Version: 2.5
|
|
2
|
+
Name: foldmetrics
|
|
3
|
+
Version: 0.1.0
|
|
4
|
+
Summary: Unified confidence metrics (pTM, ipTM, pLDDT, ipLDDT, PAE, ipSAE, pDockQ, pDockQ2, LIS) for AlphaFold2/3, ColabFold, Boltz, Chai-1 and Protenix predictions
|
|
5
|
+
Project-URL: Homepage, https://github.com/ChiaChunL/foldmetrics
|
|
6
|
+
Project-URL: Repository, https://github.com/ChiaChunL/foldmetrics
|
|
7
|
+
Project-URL: Issues, https://github.com/ChiaChunL/foldmetrics/issues
|
|
8
|
+
Author-email: Jiajun Li <ChiaChun.Le@gmail.com>
|
|
9
|
+
License-Expression: MIT
|
|
10
|
+
License-File: LICENSE
|
|
11
|
+
Keywords: alphafold,bioinformatics,boltz,chai-1,ipsae,iptm,pae,pdockq,plddt,protein-complex,protenix,structure-prediction
|
|
12
|
+
Classifier: Development Status :: 3 - Alpha
|
|
13
|
+
Classifier: Intended Audience :: Science/Research
|
|
14
|
+
Classifier: Operating System :: OS Independent
|
|
15
|
+
Classifier: Programming Language :: Python :: 3
|
|
16
|
+
Classifier: Programming Language :: Python :: 3.10
|
|
17
|
+
Classifier: Programming Language :: Python :: 3.11
|
|
18
|
+
Classifier: Programming Language :: Python :: 3.12
|
|
19
|
+
Classifier: Programming Language :: Python :: 3.13
|
|
20
|
+
Classifier: Topic :: Scientific/Engineering :: Bio-Informatics
|
|
21
|
+
Requires-Python: >=3.10
|
|
22
|
+
Requires-Dist: gemmi>=0.6.4
|
|
23
|
+
Requires-Dist: matplotlib>=3.7
|
|
24
|
+
Requires-Dist: numpy>=1.23
|
|
25
|
+
Requires-Dist: pandas>=2.0
|
|
26
|
+
Provides-Extra: dev
|
|
27
|
+
Requires-Dist: pytest>=7.4; extra == 'dev'
|
|
28
|
+
Requires-Dist: ruff>=0.5; extra == 'dev'
|
|
29
|
+
Description-Content-Type: text/markdown
|
|
30
|
+
|
|
31
|
+
# foldmetrics
|
|
32
|
+
|
|
33
|
+
Unified confidence metrics for structure-prediction models.
|
|
34
|
+
|
|
35
|
+
`foldmetrics` ingests the raw output folders of the mainstream structure
|
|
36
|
+
predictors — **AlphaFold2 / AlphaFold-Multimer, ColabFold, AlphaFold3, Boltz,
|
|
37
|
+
Chai-1, Protenix** — and computes a consistent set of quality metrics for
|
|
38
|
+
monomers and complexes (protein, nucleic acid and small-molecule ligands),
|
|
39
|
+
for a single model or whole batches:
|
|
40
|
+
|
|
41
|
+
| Metric | What it tells you | Source |
|
|
42
|
+
|---|---|---|
|
|
43
|
+
| `ptm`, `iptm` | global / interface predicted TM-score | read from tool output |
|
|
44
|
+
| `ranking_score` | tool-native model ranking (AF3 `ranking_score`, Boltz `confidence_score`, Chai `aggregate_score`, AF2 `ranking_confidence`) | read from tool output |
|
|
45
|
+
| `plddt_mean` | mean per-token pLDDT | computed |
|
|
46
|
+
| `iplddt` | mean pLDDT over interface residues (contact atoms within 8 Å across chains) | computed |
|
|
47
|
+
| `pae_mean`, `ipae_mean` | mean PAE (all off-diagonal / inter-chain blocks) | computed |
|
|
48
|
+
| `ipsae` | interface score from PAE with per-residue d0 (Dunbrack 2025) | computed |
|
|
49
|
+
| `pdockq` | interface score from contacts + pLDDT (Bryant 2022) | computed |
|
|
50
|
+
| `pdockq2` | interface score from contacts + pLDDT + PAE (Zhu 2023) | computed |
|
|
51
|
+
| `lis` | Local Interaction Score from PAE (Kim 2024) | computed |
|
|
52
|
+
|
|
53
|
+
Computed metrics were validated against the `ipsae.py` reference
|
|
54
|
+
implementation (Dunbrack Lab), including its exact `d0` conventions.
|
|
55
|
+
|
|
56
|
+
## Install
|
|
57
|
+
|
|
58
|
+
```bash
|
|
59
|
+
pip install foldmetrics
|
|
60
|
+
```
|
|
61
|
+
|
|
62
|
+
(conda-forge packaging is planned; until then use pip inside a conda env.)
|
|
63
|
+
|
|
64
|
+
Development install:
|
|
65
|
+
|
|
66
|
+
```bash
|
|
67
|
+
git clone https://github.com/ChiaChunL/foldmetrics.git && cd foldmetrics
|
|
68
|
+
pip install -e ".[dev]"
|
|
69
|
+
```
|
|
70
|
+
|
|
71
|
+
## Quickstart
|
|
72
|
+
|
|
73
|
+
CLI (`foldmetrics`, short alias `fmx`):
|
|
74
|
+
|
|
75
|
+
```bash
|
|
76
|
+
# score every prediction found under a directory (any mix of tools)
|
|
77
|
+
foldmetrics score path/to/predictions/ -o metrics.tsv
|
|
78
|
+
|
|
79
|
+
# per chain-pair breakdown + summary figures (pLDDT track, PAE heatmap, metrics)
|
|
80
|
+
fmx score preds/ -o metrics.tsv --interfaces interfaces.tsv --plot plots/
|
|
81
|
+
|
|
82
|
+
# a single model: point at any of its files
|
|
83
|
+
fmx score run1/fold_job_full_data_0.json
|
|
84
|
+
|
|
85
|
+
# one metric only (every metric name is also a subcommand)
|
|
86
|
+
fmx ipsae preds/ --interfaces ipsae_per_pair.tsv
|
|
87
|
+
fmx score preds/ --metrics ipsae,pdockq2,lis
|
|
88
|
+
|
|
89
|
+
# what would be scored?
|
|
90
|
+
fmx detect preds/
|
|
91
|
+
|
|
92
|
+
# figures only
|
|
93
|
+
fmx plot preds/ -o plots/
|
|
94
|
+
```
|
|
95
|
+
|
|
96
|
+
Python:
|
|
97
|
+
|
|
98
|
+
```python
|
|
99
|
+
import foldmetrics as fm
|
|
100
|
+
|
|
101
|
+
df = fm.evaluate("path/to/predictions/") # one row per model
|
|
102
|
+
dfi = fm.evaluate_interfaces("path/to/predictions/") # one row per chain pair
|
|
103
|
+
|
|
104
|
+
# lower-level access
|
|
105
|
+
preds = fm.load_predictions("path/to/predictions/")
|
|
106
|
+
summary, interfaces = fm.compute_all(preds[0])
|
|
107
|
+
```
|
|
108
|
+
|
|
109
|
+
More recipes (including runnable demo data that needs no prediction tool) live
|
|
110
|
+
in [examples/](examples/).
|
|
111
|
+
|
|
112
|
+
## Visualization
|
|
113
|
+
|
|
114
|
+
`--plot DIR` (on `score` and every metric subcommand) or the `plot`
|
|
115
|
+
subcommand renders publication-oriented figures, adapting automatically to
|
|
116
|
+
the shape of the batch:
|
|
117
|
+
|
|
118
|
+
| Input shape | Figures written into DIR |
|
|
119
|
+
|---|---|
|
|
120
|
+
| every model | `<model>.png` — pLDDT-colored structure + pLDDT track + PAE heatmap + metrics panel |
|
|
121
|
+
| more than one model | plus `batch_overview.png` — ranked confidence dot plot + mean pLDDT bars |
|
|
122
|
+
| more than one target and/or tool | plus `comparison.png` — one panel per metric, grouped by target, one color per tool |
|
|
123
|
+
|
|
124
|
+
The structure panel uses **headless PyMOL** when available (auto-detected
|
|
125
|
+
from `FOLDMETRICS_PYMOL`, PATH, or common conda locations; ~2–3 s per
|
|
126
|
+
model) and falls back to a fast matplotlib backbone trace otherwise —
|
|
127
|
+
select explicitly with `--renderer pymol|trace`. The `plot` subcommand also
|
|
128
|
+
takes `--format png|pdf|svg` and `--dpi` (default 300).
|
|
129
|
+
|
|
130
|
+
Single model (AlphaFold3, SARS-CoV-2 Mpro + nirmatrelvir):
|
|
131
|
+
|
|
132
|
+
|
|
133
|
+
|
|
134
|
+
Targets × methods comparison (real batch: 10 complexes × 4 tools):
|
|
135
|
+
|
|
136
|
+
|
|
137
|
+
|
|
138
|
+
Batch overview (one target, AlphaFold2 + AlphaFold3 models):
|
|
139
|
+
|
|
140
|
+
|
|
141
|
+
|
|
142
|
+
## Supported tools and files
|
|
143
|
+
|
|
144
|
+
| Tool | Detected files | pTM/ipTM | pLDDT | PAE |
|
|
145
|
+
|---|---|---|---|---|
|
|
146
|
+
| ColabFold | `*_scores_rank_*.json` + `*_(un)relaxed_rank_*.pdb` | yes | yes | yes |
|
|
147
|
+
| AlphaFold2 (pickle layout) | `result_model_*.pkl` + `unrelaxed_*.pdb` / `ranked_*.pdb` | yes | yes | yes |
|
|
148
|
+
| AlphaFold2 (JSON layout) | `iptm_ptm.json` + `confidence_*.json` / `pae_*.json` + `unrelaxed_*.cif/.pdb` | yes | yes | yes |
|
|
149
|
+
| AlphaFold3 (server/local) | `*model*.cif` + `*summary_confidences*.json` + `*confidences*/full_data*.json` | yes | yes | yes |
|
|
150
|
+
| Boltz-1/2 | `confidence_*_model_*.json` + `*_model_*.cif` + `pae_*.npz` / `plddt_*.npz` | yes | yes | yes |
|
|
151
|
+
| Chai-1 | `scores.model_idx_*.npz` + `pred.model_idx_*.cif` | yes | yes | if exported |
|
|
152
|
+
| Protenix | `*summary_confidence*.json` + matching `.cif` (+ `*full_data*.json` with `token_pair_pae`) | yes | yes | yes |
|
|
153
|
+
| HelixFold3 | planned | — | — | — |
|
|
154
|
+
|
|
155
|
+
## Validation
|
|
156
|
+
|
|
157
|
+
- Numerical parity with the `ipsae.py` reference implementation (Dunbrack
|
|
158
|
+
Lab) verified digit-for-digit on real AlphaFold3 server output: ipSAE
|
|
159
|
+
(both directions and d0chn variant), pDockQ, pDockQ2 and LIS all match to
|
|
160
|
+
6 decimal places at the default cutoffs (10/10).
|
|
161
|
+
- Batch-tested on 720 real predictions across AlphaFold2-Multimer,
|
|
162
|
+
AlphaFold3 (server + local), Boltz-2 and Protenix — including
|
|
163
|
+
protein–small-molecule complexes, homodimers, monomers and negative
|
|
164
|
+
controls — with zero parse errors; known binders score ipSAE 0.9+, decoy
|
|
165
|
+
pairs < 0.1, monomers report NA.
|
|
166
|
+
- ColabFold and Chai-1 parsers are currently validated on synthetic
|
|
167
|
+
fixtures only; real-output samples welcome.
|
|
168
|
+
|
|
169
|
+
Native per-tool extras (e.g. Boltz `complex_iplddt`/`ligand_iptm`, AF3
|
|
170
|
+
`chain_pair_pae_min`, Chai clash flags) are preserved on
|
|
171
|
+
`Prediction.extras` and chain-pair ipTM is surfaced as `iptm_native` in the
|
|
172
|
+
interface table.
|
|
173
|
+
|
|
174
|
+
## What each metric needs
|
|
175
|
+
|
|
176
|
+
The structure file is always required (it defines chains and tokens); the
|
|
177
|
+
table shows which additional inputs each metric consumes. When an input is
|
|
178
|
+
missing the metric is `NA` and a note lands in the `warnings` column —
|
|
179
|
+
nothing crashes.
|
|
180
|
+
|
|
181
|
+
| Metric (= subcommand) | pLDDT | Coordinates | PAE | Source |
|
|
182
|
+
|---|---|---|---|---|
|
|
183
|
+
| `ptm`, `iptm`, `ranking` | – | – | – | read from the tool's confidence file |
|
|
184
|
+
| `plddt` (mean pLDDT, ipLDDT) | yes | ipLDDT only | – | B-factors, or the tool's pLDDT file |
|
|
185
|
+
| `pae` (mean PAE, inter-chain PAE) | – | – | yes | tool's PAE matrix |
|
|
186
|
+
| `pdockq` | yes | yes | – | contacts at 8 Å between CB/C3' atoms |
|
|
187
|
+
| `pdockq2` | yes | yes | yes | |
|
|
188
|
+
| `ipsae`, `lis` | – | – | yes | chain mapping from the structure |
|
|
189
|
+
|
|
190
|
+
## Outputs and paths
|
|
191
|
+
|
|
192
|
+
- Summary table → stdout; `-o FILE` writes it. The extension picks the
|
|
193
|
+
format: `.tsv` (default), `.csv`, `.json`; missing values are `NA`.
|
|
194
|
+
- `--interfaces FILE` → the per chain-pair table (same formats).
|
|
195
|
+
- `--plot DIR` → figures as described under Visualization; model names are
|
|
196
|
+
sanitized (`[^\w.-]` → `_`) for use as filenames.
|
|
197
|
+
- `plot -o DIR` defaults to `./foldmetrics_plots/`.
|
|
198
|
+
- Exit codes: `0` success, `1` nothing recognized/found, `2` bad arguments.
|
|
199
|
+
|
|
200
|
+
## Conventions worth knowing
|
|
201
|
+
|
|
202
|
+
- **Tokens.** Standard residues are one token; ligands and modified residues
|
|
203
|
+
are one token per heavy atom (AF3-style), so token-level PAE matrices line
|
|
204
|
+
up across tools. pLDDT is stored on the 0–100 scale everywhere (Boltz 0–1
|
|
205
|
+
values are rescaled).
|
|
206
|
+
- **Complex-level interface metrics are the best interface.** For >2 chains,
|
|
207
|
+
`ipsae`/`pdockq`/`pdockq2`/`lis` in the summary table are the maximum over
|
|
208
|
+
chain pairs; use `--interfaces` for the full breakdown.
|
|
209
|
+
- **Ligand interfaces.** `pdockq`/`pdockq2`/`iplddt` are defined for
|
|
210
|
+
polymer–polymer interfaces only. For chain pairs involving a ligand chain,
|
|
211
|
+
`ipsae`/`lis` are computed over ligand atom tokens (experimental) and marked
|
|
212
|
+
`ipsae_mode = "tokens"` in the interface table.
|
|
213
|
+
- **Missing data degrades gracefully.** No PAE → PAE-based metrics are NaN
|
|
214
|
+
and a note lands in the `warnings` column; nothing crashes.
|
|
215
|
+
- **Directionality.** PAE is asymmetric, so `pdockq2`/`ipsae`/`lis` have two
|
|
216
|
+
directional values; the interface table reports both (`*_ab`, `*_ba`) plus
|
|
217
|
+
the aggregate used everywhere else (max for ipSAE/pDockQ2, mean for LIS,
|
|
218
|
+
matching the reference implementations).
|
|
219
|
+
|
|
220
|
+
## References
|
|
221
|
+
|
|
222
|
+
- Bryant P, Pozzati G, Elofsson A. *Improved prediction of protein-protein
|
|
223
|
+
interactions using AlphaFold2.* Nat Commun 13, 1265 (2022). — pDockQ
|
|
224
|
+
- Zhu W, Shenoy A, Kundrotas P, Elofsson A. *Evaluation of AlphaFold-Multimer
|
|
225
|
+
prediction on multi-chain protein complexes.* Bioinformatics 39, btad424
|
|
226
|
+
(2023). — pDockQ2
|
|
227
|
+
- Dunbrack RL. *ipSAE: scoring pairwise interactions in AlphaFold models.*
|
|
228
|
+
bioRxiv 10.1101/2025.02.10.637595 (2025). — ipSAE
|
|
229
|
+
- Kim AR et al. *Enhanced protein-protein interaction discovery via
|
|
230
|
+
AlphaFold-Multimer.* bioRxiv 10.1101/2024.02.19.580970 (2024). — LIS
|
|
231
|
+
|
|
232
|
+
## Roadmap
|
|
233
|
+
|
|
234
|
+
- HelixFold3 parser (sample outputs welcome — please open an issue)
|
|
235
|
+
- Real-output samples for ColabFold and Chai-1
|
|
236
|
+
- Per-interface PAE/ipSAE figures; interactive HTML report
|
|
237
|
+
- conda-forge feedstock; CI (lint + tests) on GitHub Actions
|
|
238
|
+
|
|
239
|
+
## License
|
|
240
|
+
|
|
241
|
+
MIT
|
|
@@ -0,0 +1,211 @@
|
|
|
1
|
+
# foldmetrics
|
|
2
|
+
|
|
3
|
+
Unified confidence metrics for structure-prediction models.
|
|
4
|
+
|
|
5
|
+
`foldmetrics` ingests the raw output folders of the mainstream structure
|
|
6
|
+
predictors — **AlphaFold2 / AlphaFold-Multimer, ColabFold, AlphaFold3, Boltz,
|
|
7
|
+
Chai-1, Protenix** — and computes a consistent set of quality metrics for
|
|
8
|
+
monomers and complexes (protein, nucleic acid and small-molecule ligands),
|
|
9
|
+
for a single model or whole batches:
|
|
10
|
+
|
|
11
|
+
| Metric | What it tells you | Source |
|
|
12
|
+
|---|---|---|
|
|
13
|
+
| `ptm`, `iptm` | global / interface predicted TM-score | read from tool output |
|
|
14
|
+
| `ranking_score` | tool-native model ranking (AF3 `ranking_score`, Boltz `confidence_score`, Chai `aggregate_score`, AF2 `ranking_confidence`) | read from tool output |
|
|
15
|
+
| `plddt_mean` | mean per-token pLDDT | computed |
|
|
16
|
+
| `iplddt` | mean pLDDT over interface residues (contact atoms within 8 Å across chains) | computed |
|
|
17
|
+
| `pae_mean`, `ipae_mean` | mean PAE (all off-diagonal / inter-chain blocks) | computed |
|
|
18
|
+
| `ipsae` | interface score from PAE with per-residue d0 (Dunbrack 2025) | computed |
|
|
19
|
+
| `pdockq` | interface score from contacts + pLDDT (Bryant 2022) | computed |
|
|
20
|
+
| `pdockq2` | interface score from contacts + pLDDT + PAE (Zhu 2023) | computed |
|
|
21
|
+
| `lis` | Local Interaction Score from PAE (Kim 2024) | computed |
|
|
22
|
+
|
|
23
|
+
Computed metrics were validated against the `ipsae.py` reference
|
|
24
|
+
implementation (Dunbrack Lab), including its exact `d0` conventions.
|
|
25
|
+
|
|
26
|
+
## Install
|
|
27
|
+
|
|
28
|
+
```bash
|
|
29
|
+
pip install foldmetrics
|
|
30
|
+
```
|
|
31
|
+
|
|
32
|
+
(conda-forge packaging is planned; until then use pip inside a conda env.)
|
|
33
|
+
|
|
34
|
+
Development install:
|
|
35
|
+
|
|
36
|
+
```bash
|
|
37
|
+
git clone https://github.com/ChiaChunL/foldmetrics.git && cd foldmetrics
|
|
38
|
+
pip install -e ".[dev]"
|
|
39
|
+
```
|
|
40
|
+
|
|
41
|
+
## Quickstart
|
|
42
|
+
|
|
43
|
+
CLI (`foldmetrics`, short alias `fmx`):
|
|
44
|
+
|
|
45
|
+
```bash
|
|
46
|
+
# score every prediction found under a directory (any mix of tools)
|
|
47
|
+
foldmetrics score path/to/predictions/ -o metrics.tsv
|
|
48
|
+
|
|
49
|
+
# per chain-pair breakdown + summary figures (pLDDT track, PAE heatmap, metrics)
|
|
50
|
+
fmx score preds/ -o metrics.tsv --interfaces interfaces.tsv --plot plots/
|
|
51
|
+
|
|
52
|
+
# a single model: point at any of its files
|
|
53
|
+
fmx score run1/fold_job_full_data_0.json
|
|
54
|
+
|
|
55
|
+
# one metric only (every metric name is also a subcommand)
|
|
56
|
+
fmx ipsae preds/ --interfaces ipsae_per_pair.tsv
|
|
57
|
+
fmx score preds/ --metrics ipsae,pdockq2,lis
|
|
58
|
+
|
|
59
|
+
# what would be scored?
|
|
60
|
+
fmx detect preds/
|
|
61
|
+
|
|
62
|
+
# figures only
|
|
63
|
+
fmx plot preds/ -o plots/
|
|
64
|
+
```
|
|
65
|
+
|
|
66
|
+
Python:
|
|
67
|
+
|
|
68
|
+
```python
|
|
69
|
+
import foldmetrics as fm
|
|
70
|
+
|
|
71
|
+
df = fm.evaluate("path/to/predictions/") # one row per model
|
|
72
|
+
dfi = fm.evaluate_interfaces("path/to/predictions/") # one row per chain pair
|
|
73
|
+
|
|
74
|
+
# lower-level access
|
|
75
|
+
preds = fm.load_predictions("path/to/predictions/")
|
|
76
|
+
summary, interfaces = fm.compute_all(preds[0])
|
|
77
|
+
```
|
|
78
|
+
|
|
79
|
+
More recipes (including runnable demo data that needs no prediction tool) live
|
|
80
|
+
in [examples/](examples/).
|
|
81
|
+
|
|
82
|
+
## Visualization
|
|
83
|
+
|
|
84
|
+
`--plot DIR` (on `score` and every metric subcommand) or the `plot`
|
|
85
|
+
subcommand renders publication-oriented figures, adapting automatically to
|
|
86
|
+
the shape of the batch:
|
|
87
|
+
|
|
88
|
+
| Input shape | Figures written into DIR |
|
|
89
|
+
|---|---|
|
|
90
|
+
| every model | `<model>.png` — pLDDT-colored structure + pLDDT track + PAE heatmap + metrics panel |
|
|
91
|
+
| more than one model | plus `batch_overview.png` — ranked confidence dot plot + mean pLDDT bars |
|
|
92
|
+
| more than one target and/or tool | plus `comparison.png` — one panel per metric, grouped by target, one color per tool |
|
|
93
|
+
|
|
94
|
+
The structure panel uses **headless PyMOL** when available (auto-detected
|
|
95
|
+
from `FOLDMETRICS_PYMOL`, PATH, or common conda locations; ~2–3 s per
|
|
96
|
+
model) and falls back to a fast matplotlib backbone trace otherwise —
|
|
97
|
+
select explicitly with `--renderer pymol|trace`. The `plot` subcommand also
|
|
98
|
+
takes `--format png|pdf|svg` and `--dpi` (default 300).
|
|
99
|
+
|
|
100
|
+
Single model (AlphaFold3, SARS-CoV-2 Mpro + nirmatrelvir):
|
|
101
|
+
|
|
102
|
+

|
|
103
|
+
|
|
104
|
+
Targets × methods comparison (real batch: 10 complexes × 4 tools):
|
|
105
|
+
|
|
106
|
+

|
|
107
|
+
|
|
108
|
+
Batch overview (one target, AlphaFold2 + AlphaFold3 models):
|
|
109
|
+
|
|
110
|
+

|
|
111
|
+
|
|
112
|
+
## Supported tools and files
|
|
113
|
+
|
|
114
|
+
| Tool | Detected files | pTM/ipTM | pLDDT | PAE |
|
|
115
|
+
|---|---|---|---|---|
|
|
116
|
+
| ColabFold | `*_scores_rank_*.json` + `*_(un)relaxed_rank_*.pdb` | yes | yes | yes |
|
|
117
|
+
| AlphaFold2 (pickle layout) | `result_model_*.pkl` + `unrelaxed_*.pdb` / `ranked_*.pdb` | yes | yes | yes |
|
|
118
|
+
| AlphaFold2 (JSON layout) | `iptm_ptm.json` + `confidence_*.json` / `pae_*.json` + `unrelaxed_*.cif/.pdb` | yes | yes | yes |
|
|
119
|
+
| AlphaFold3 (server/local) | `*model*.cif` + `*summary_confidences*.json` + `*confidences*/full_data*.json` | yes | yes | yes |
|
|
120
|
+
| Boltz-1/2 | `confidence_*_model_*.json` + `*_model_*.cif` + `pae_*.npz` / `plddt_*.npz` | yes | yes | yes |
|
|
121
|
+
| Chai-1 | `scores.model_idx_*.npz` + `pred.model_idx_*.cif` | yes | yes | if exported |
|
|
122
|
+
| Protenix | `*summary_confidence*.json` + matching `.cif` (+ `*full_data*.json` with `token_pair_pae`) | yes | yes | yes |
|
|
123
|
+
| HelixFold3 | planned | — | — | — |
|
|
124
|
+
|
|
125
|
+
## Validation
|
|
126
|
+
|
|
127
|
+
- Numerical parity with the `ipsae.py` reference implementation (Dunbrack
|
|
128
|
+
Lab) verified digit-for-digit on real AlphaFold3 server output: ipSAE
|
|
129
|
+
(both directions and d0chn variant), pDockQ, pDockQ2 and LIS all match to
|
|
130
|
+
6 decimal places at the default cutoffs (10/10).
|
|
131
|
+
- Batch-tested on 720 real predictions across AlphaFold2-Multimer,
|
|
132
|
+
AlphaFold3 (server + local), Boltz-2 and Protenix — including
|
|
133
|
+
protein–small-molecule complexes, homodimers, monomers and negative
|
|
134
|
+
controls — with zero parse errors; known binders score ipSAE 0.9+, decoy
|
|
135
|
+
pairs < 0.1, monomers report NA.
|
|
136
|
+
- ColabFold and Chai-1 parsers are currently validated on synthetic
|
|
137
|
+
fixtures only; real-output samples welcome.
|
|
138
|
+
|
|
139
|
+
Native per-tool extras (e.g. Boltz `complex_iplddt`/`ligand_iptm`, AF3
|
|
140
|
+
`chain_pair_pae_min`, Chai clash flags) are preserved on
|
|
141
|
+
`Prediction.extras` and chain-pair ipTM is surfaced as `iptm_native` in the
|
|
142
|
+
interface table.
|
|
143
|
+
|
|
144
|
+
## What each metric needs
|
|
145
|
+
|
|
146
|
+
The structure file is always required (it defines chains and tokens); the
|
|
147
|
+
table shows which additional inputs each metric consumes. When an input is
|
|
148
|
+
missing the metric is `NA` and a note lands in the `warnings` column —
|
|
149
|
+
nothing crashes.
|
|
150
|
+
|
|
151
|
+
| Metric (= subcommand) | pLDDT | Coordinates | PAE | Source |
|
|
152
|
+
|---|---|---|---|---|
|
|
153
|
+
| `ptm`, `iptm`, `ranking` | – | – | – | read from the tool's confidence file |
|
|
154
|
+
| `plddt` (mean pLDDT, ipLDDT) | yes | ipLDDT only | – | B-factors, or the tool's pLDDT file |
|
|
155
|
+
| `pae` (mean PAE, inter-chain PAE) | – | – | yes | tool's PAE matrix |
|
|
156
|
+
| `pdockq` | yes | yes | – | contacts at 8 Å between CB/C3' atoms |
|
|
157
|
+
| `pdockq2` | yes | yes | yes | |
|
|
158
|
+
| `ipsae`, `lis` | – | – | yes | chain mapping from the structure |
|
|
159
|
+
|
|
160
|
+
## Outputs and paths
|
|
161
|
+
|
|
162
|
+
- Summary table → stdout; `-o FILE` writes it. The extension picks the
|
|
163
|
+
format: `.tsv` (default), `.csv`, `.json`; missing values are `NA`.
|
|
164
|
+
- `--interfaces FILE` → the per chain-pair table (same formats).
|
|
165
|
+
- `--plot DIR` → figures as described under Visualization; model names are
|
|
166
|
+
sanitized (`[^\w.-]` → `_`) for use as filenames.
|
|
167
|
+
- `plot -o DIR` defaults to `./foldmetrics_plots/`.
|
|
168
|
+
- Exit codes: `0` success, `1` nothing recognized/found, `2` bad arguments.
|
|
169
|
+
|
|
170
|
+
## Conventions worth knowing
|
|
171
|
+
|
|
172
|
+
- **Tokens.** Standard residues are one token; ligands and modified residues
|
|
173
|
+
are one token per heavy atom (AF3-style), so token-level PAE matrices line
|
|
174
|
+
up across tools. pLDDT is stored on the 0–100 scale everywhere (Boltz 0–1
|
|
175
|
+
values are rescaled).
|
|
176
|
+
- **Complex-level interface metrics are the best interface.** For >2 chains,
|
|
177
|
+
`ipsae`/`pdockq`/`pdockq2`/`lis` in the summary table are the maximum over
|
|
178
|
+
chain pairs; use `--interfaces` for the full breakdown.
|
|
179
|
+
- **Ligand interfaces.** `pdockq`/`pdockq2`/`iplddt` are defined for
|
|
180
|
+
polymer–polymer interfaces only. For chain pairs involving a ligand chain,
|
|
181
|
+
`ipsae`/`lis` are computed over ligand atom tokens (experimental) and marked
|
|
182
|
+
`ipsae_mode = "tokens"` in the interface table.
|
|
183
|
+
- **Missing data degrades gracefully.** No PAE → PAE-based metrics are NaN
|
|
184
|
+
and a note lands in the `warnings` column; nothing crashes.
|
|
185
|
+
- **Directionality.** PAE is asymmetric, so `pdockq2`/`ipsae`/`lis` have two
|
|
186
|
+
directional values; the interface table reports both (`*_ab`, `*_ba`) plus
|
|
187
|
+
the aggregate used everywhere else (max for ipSAE/pDockQ2, mean for LIS,
|
|
188
|
+
matching the reference implementations).
|
|
189
|
+
|
|
190
|
+
## References
|
|
191
|
+
|
|
192
|
+
- Bryant P, Pozzati G, Elofsson A. *Improved prediction of protein-protein
|
|
193
|
+
interactions using AlphaFold2.* Nat Commun 13, 1265 (2022). — pDockQ
|
|
194
|
+
- Zhu W, Shenoy A, Kundrotas P, Elofsson A. *Evaluation of AlphaFold-Multimer
|
|
195
|
+
prediction on multi-chain protein complexes.* Bioinformatics 39, btad424
|
|
196
|
+
(2023). — pDockQ2
|
|
197
|
+
- Dunbrack RL. *ipSAE: scoring pairwise interactions in AlphaFold models.*
|
|
198
|
+
bioRxiv 10.1101/2025.02.10.637595 (2025). — ipSAE
|
|
199
|
+
- Kim AR et al. *Enhanced protein-protein interaction discovery via
|
|
200
|
+
AlphaFold-Multimer.* bioRxiv 10.1101/2024.02.19.580970 (2024). — LIS
|
|
201
|
+
|
|
202
|
+
## Roadmap
|
|
203
|
+
|
|
204
|
+
- HelixFold3 parser (sample outputs welcome — please open an issue)
|
|
205
|
+
- Real-output samples for ColabFold and Chai-1
|
|
206
|
+
- Per-interface PAE/ipSAE figures; interactive HTML report
|
|
207
|
+
- conda-forge feedstock; CI (lint + tests) on GitHub Actions
|
|
208
|
+
|
|
209
|
+
## License
|
|
210
|
+
|
|
211
|
+
MIT
|
|
Binary file
|
|
Binary file
|
|
Binary file
|
|
@@ -0,0 +1,92 @@
|
|
|
1
|
+
# Examples
|
|
2
|
+
|
|
3
|
+
Everything here runs without any prediction tool installed: `make_demo_data.py`
|
|
4
|
+
generates realistic synthetic AlphaFold3-style outputs to play with. Substitute
|
|
5
|
+
your real prediction folders anywhere a `demo_predictions` path appears.
|
|
6
|
+
|
|
7
|
+
```bash
|
|
8
|
+
python examples/make_demo_data.py demo_predictions
|
|
9
|
+
```
|
|
10
|
+
|
|
11
|
+
## CLI recipes
|
|
12
|
+
|
|
13
|
+
`fmx` is a short alias for `foldmetrics`; they are identical.
|
|
14
|
+
|
|
15
|
+
### Score a batch (any mix of supported tools, scanned recursively)
|
|
16
|
+
|
|
17
|
+
```bash
|
|
18
|
+
fmx score demo_predictions -o metrics.tsv --interfaces interfaces.tsv --plot plots
|
|
19
|
+
```
|
|
20
|
+
|
|
21
|
+
stdout (also written to `metrics.tsv`; missing values are written as `NA`):
|
|
22
|
+
|
|
23
|
+
```
|
|
24
|
+
model tool chains n_chains n_tokens n_res ptm iptm ranking_score plddt_mean iplddt pae_mean ipae_mean ipsae pdockq pdockq2 lis n_interfaces has_pae
|
|
25
|
+
complex_with_ligand_poor alphafold3 A,B,C 3 180 170 0.680 0.380 0.450 69.624 68.924 12.315 19.943 0.266 0.467 0.011 0.473 1 True
|
|
26
|
+
dimer_good alphafold3 A,B 2 195 195 0.870 0.820 0.840 88.462 88.645 3.824 4.310 0.488 0.712 0.436 0.641 1 True
|
|
27
|
+
receptor_peptide_medium alphafold3 A,B 2 170 170 0.720 0.550 0.580 81.796 72.580 6.130 11.326 0.052 0.278 0.029 0.142 1 True
|
|
28
|
+
```
|
|
29
|
+
|
|
30
|
+
Reading `complex_with_ligand_poor` is instructive: `pdockq` is deceptively
|
|
31
|
+
decent (0.47 — it only sees contacts and pLDDT) while `pdockq2` (0.011) and the
|
|
32
|
+
per-pair ipSAE expose the bad protein–protein interface; the summary `ipsae`
|
|
33
|
+
(0.266) comes from the *best* interface, which is the protein–ligand pair.
|
|
34
|
+
The `--interfaces` table shows exactly this breakdown per chain pair, including
|
|
35
|
+
the two directional values (`*_ab`, `*_ba`) and the tool's own chain-pair ipTM
|
|
36
|
+
(`iptm_native`).
|
|
37
|
+
|
|
38
|
+
`--plot plots/` writes one summary figure per model (pLDDT-colored structure
|
|
39
|
+
+ pLDDT track + PAE heatmap + metrics panel), plus `batch_overview.png` when
|
|
40
|
+
there are several models, plus `comparison.png` (targets x methods, one panel
|
|
41
|
+
per metric) when the batch spans several targets or tools. The structure
|
|
42
|
+
panel uses headless PyMOL when installed (auto-detected; ~2-3 s per model) and
|
|
43
|
+
a fast matplotlib backbone trace otherwise:
|
|
44
|
+
|
|
45
|
+
```bash
|
|
46
|
+
fmx plot demo_predictions -o plots --renderer trace # fast, no PyMOL
|
|
47
|
+
fmx plot demo_predictions -o plots --format pdf # vector output
|
|
48
|
+
```
|
|
49
|
+
|
|
50
|
+
### Single metrics
|
|
51
|
+
|
|
52
|
+
Every metric name is also a subcommand, so computing just one metric over a
|
|
53
|
+
batch is:
|
|
54
|
+
|
|
55
|
+
```bash
|
|
56
|
+
fmx ipsae demo_predictions # only ipSAE columns
|
|
57
|
+
fmx pdockq2 demo_predictions -o pdockq2.tsv # same options as 'score'
|
|
58
|
+
fmx score demo_predictions --metrics ipsae,lis # any subset
|
|
59
|
+
```
|
|
60
|
+
|
|
61
|
+
Available names: `ptm`, `iptm`, `ranking`, `plddt`, `pae`, `ipsae`,
|
|
62
|
+
`pdockq`, `pdockq2`, `lis`.
|
|
63
|
+
|
|
64
|
+
### Other commands
|
|
65
|
+
|
|
66
|
+
```bash
|
|
67
|
+
fmx detect demo_predictions # list what would be scored, per tool
|
|
68
|
+
fmx plot demo_predictions -o plots # figures only
|
|
69
|
+
fmx score run1/fold_x_full_data_0.json # a single model, via any of its files
|
|
70
|
+
fmx score preds/ --tool boltz # restrict auto-detection to one tool
|
|
71
|
+
fmx score preds/ --pae-cutoff 15 # loosen the ipSAE PAE cutoff
|
|
72
|
+
fmx score run1/ run2/ model_dir/ # any number of paths
|
|
73
|
+
```
|
|
74
|
+
|
|
75
|
+
Output formats follow the file extension: `.tsv` (default), `.csv`, `.json`.
|
|
76
|
+
|
|
77
|
+
## Python API
|
|
78
|
+
|
|
79
|
+
See [python_api.py](python_api.py) for a complete walkthrough:
|
|
80
|
+
|
|
81
|
+
```bash
|
|
82
|
+
python examples/python_api.py demo_predictions
|
|
83
|
+
```
|
|
84
|
+
|
|
85
|
+
It covers:
|
|
86
|
+
|
|
87
|
+
1. `fm.evaluate(path)` — summary DataFrame (one row per model)
|
|
88
|
+
2. `fm.evaluate_interfaces(path)` — per chain-pair DataFrame
|
|
89
|
+
3. `fm.load_predictions` + `fm.compute_all` — full access to one model,
|
|
90
|
+
including per-residue ipSAE profiles via `foldmetrics.metrics.ipsae_asym`
|
|
91
|
+
4. Figures: `save_summary_plot`, `save_batch_plot`, and composing your own
|
|
92
|
+
figure from `plot_plddt` / `plot_pae`
|