financetoolkit 2.1.4__tar.gz → 2.2.1__tar.gz
This diff represents the content of publicly available package versions that have been released to one of the supported registries. The information contained in this diff is provided for informational purposes only and reflects changes between package versions as they appear in their respective public registries.
- {financetoolkit-2.1.4 → financetoolkit-2.2.1}/.gitignore +1 -0
- {financetoolkit-2.1.4 → financetoolkit-2.2.1}/PKG-INFO +88 -40
- {financetoolkit-2.1.4 → financetoolkit-2.2.1}/README.md +77 -33
- financetoolkit-2.2.1/financetoolkit/cache/__init__.py +25 -0
- financetoolkit-2.2.1/financetoolkit/cache/cache_controller.py +847 -0
- financetoolkit-2.2.1/financetoolkit/cache/coverage_model.py +156 -0
- financetoolkit-2.2.1/financetoolkit/cache/frame_model.py +161 -0
- financetoolkit-2.2.1/financetoolkit/cache/policy_model.py +135 -0
- financetoolkit-2.2.1/financetoolkit/cache/request_model.py +30 -0
- financetoolkit-2.2.1/financetoolkit/cache/serialization_model.py +160 -0
- financetoolkit-2.2.1/financetoolkit/cache/sqlite_model.py +756 -0
- financetoolkit-2.2.1/financetoolkit/cache/ticker_model.py +214 -0
- {financetoolkit-2.1.4 → financetoolkit-2.2.1}/financetoolkit/currencies_model.py +117 -5
- {financetoolkit-2.1.4 → financetoolkit-2.2.1}/financetoolkit/discovery/discovery_controller.py +153 -111
- {financetoolkit-2.1.4 → financetoolkit-2.2.1}/financetoolkit/discovery/discovery_model.py +274 -109
- financetoolkit-2.2.1/financetoolkit/econometrics/causal_inference_model.py +1078 -0
- financetoolkit-2.2.1/financetoolkit/econometrics/causality_model.py +76 -0
- financetoolkit-2.2.1/financetoolkit/econometrics/cointegration_model.py +220 -0
- financetoolkit-2.2.1/financetoolkit/econometrics/diagnostics_model.py +464 -0
- financetoolkit-2.2.1/financetoolkit/econometrics/econometrics_controller.py +5343 -0
- financetoolkit-2.2.1/financetoolkit/econometrics/event_study_model.py +152 -0
- financetoolkit-2.2.1/financetoolkit/econometrics/fama_macbeth_model.py +233 -0
- financetoolkit-2.2.1/financetoolkit/econometrics/forecast_evaluation_model.py +477 -0
- financetoolkit-2.2.1/financetoolkit/econometrics/hypothesis_testing_model.py +480 -0
- financetoolkit-2.2.1/financetoolkit/econometrics/panel_data_model.py +574 -0
- financetoolkit-2.2.1/financetoolkit/econometrics/regression_model.py +872 -0
- financetoolkit-2.2.1/financetoolkit/econometrics/specification_tests_model.py +510 -0
- financetoolkit-2.2.1/financetoolkit/econometrics/time_series_model.py +1015 -0
- financetoolkit-2.2.1/financetoolkit/econometrics/unitroot_model.py +478 -0
- {financetoolkit-2.1.4 → financetoolkit-2.2.1}/financetoolkit/economics/economics_controller.py +3088 -395
- financetoolkit-2.2.1/financetoolkit/economics/fred_model.py +297 -0
- financetoolkit-2.2.1/financetoolkit/economics/gmdb_model.py +469 -0
- financetoolkit-2.2.1/financetoolkit/economics/oecd_model.py +1451 -0
- financetoolkit-2.2.1/financetoolkit/economics/yfinance_model.py +161 -0
- financetoolkit-2.2.1/financetoolkit/fixedincome/bond_model.py +860 -0
- financetoolkit-2.2.1/financetoolkit/fixedincome/derivative_model.py +321 -0
- {financetoolkit-2.1.4 → financetoolkit-2.2.1}/financetoolkit/fixedincome/ecb_model.py +3 -6
- financetoolkit-2.2.1/financetoolkit/fixedincome/euribor_model.py +61 -0
- {financetoolkit-2.1.4 → financetoolkit-2.2.1}/financetoolkit/fixedincome/fed_model.py +30 -6
- {financetoolkit-2.1.4 → financetoolkit-2.2.1}/financetoolkit/fixedincome/fixedincome_controller.py +1438 -256
- financetoolkit-2.2.1/financetoolkit/fixedincome/fmp_model.py +195 -0
- {financetoolkit-2.1.4 → financetoolkit-2.2.1}/financetoolkit/fixedincome/fred_model.py +79 -29
- financetoolkit-2.2.1/financetoolkit/fixedincome/helpers.py +74 -0
- financetoolkit-2.2.1/financetoolkit/fixedincome/yieldcurve_model.py +254 -0
- {financetoolkit-2.1.4 → financetoolkit-2.2.1}/financetoolkit/fmp_model.py +471 -298
- {financetoolkit-2.1.4 → financetoolkit-2.2.1}/financetoolkit/fundamentals_model.py +221 -44
- financetoolkit-2.2.1/financetoolkit/helpers.py +337 -0
- financetoolkit-2.2.1/financetoolkit/historical_model.py +804 -0
- financetoolkit-2.2.1/financetoolkit/mcp_server/__init__.py +1 -0
- {financetoolkit-2.1.4 → financetoolkit-2.2.1}/financetoolkit/mcp_server/auth_model.py +149 -14
- {financetoolkit-2.1.4 → financetoolkit-2.2.1}/financetoolkit/mcp_server/config.yaml +157 -19
- {financetoolkit-2.1.4 → financetoolkit-2.2.1}/financetoolkit/mcp_server/formatting_model.py +7 -7
- {financetoolkit-2.1.4 → financetoolkit-2.2.1}/financetoolkit/mcp_server/inspection_controller.py +101 -0
- {financetoolkit-2.1.4 → financetoolkit-2.2.1}/financetoolkit/mcp_server/mcp_controller.py +237 -31
- {financetoolkit-2.1.4 → financetoolkit-2.2.1}/financetoolkit/mcp_server/mcpb/manifest.json +15 -11
- {financetoolkit-2.1.4 → financetoolkit-2.2.1}/financetoolkit/mcp_server/mcpb/pyproject.toml +3 -3
- {financetoolkit-2.1.4 → financetoolkit-2.2.1}/financetoolkit/mcp_server/provider_model.py +239 -87
- {financetoolkit-2.1.4 → financetoolkit-2.2.1}/financetoolkit/mcp_server/registry_controller.py +156 -33
- {financetoolkit-2.1.4 → financetoolkit-2.2.1}/financetoolkit/mcp_server/setup_model.py +175 -64
- {financetoolkit-2.1.4 → financetoolkit-2.2.1}/financetoolkit/models/altman_model.py +30 -4
- {financetoolkit-2.1.4 → financetoolkit-2.2.1}/financetoolkit/models/dupont_model.py +52 -16
- financetoolkit-2.2.1/financetoolkit/models/enterprise_model.py +135 -0
- {financetoolkit-2.1.4 → financetoolkit-2.2.1}/financetoolkit/models/eva_model.py +57 -0
- financetoolkit-2.2.1/financetoolkit/models/fulmer_model.py +402 -0
- financetoolkit-2.2.1/financetoolkit/models/grover_model.py +149 -0
- {financetoolkit-2.1.4 → financetoolkit-2.2.1}/financetoolkit/models/growth_model.py +16 -2
- {financetoolkit-2.1.4 → financetoolkit-2.2.1}/financetoolkit/models/helpers.py +9 -15
- financetoolkit-2.2.1/financetoolkit/models/intrinsic_model.py +462 -0
- financetoolkit-2.2.1/financetoolkit/models/models_controller.py +4751 -0
- financetoolkit-2.2.1/financetoolkit/models/ohlson_model.py +418 -0
- {financetoolkit-2.1.4 → financetoolkit-2.2.1}/financetoolkit/models/piotroski_model.py +145 -134
- financetoolkit-2.2.1/financetoolkit/models/springate_model.py +173 -0
- {financetoolkit-2.1.4 → financetoolkit-2.2.1}/financetoolkit/models/wacc_model.py +18 -11
- financetoolkit-2.2.1/financetoolkit/models/zmijewski_model.py +182 -0
- {financetoolkit-2.1.4 → financetoolkit-2.2.1}/financetoolkit/normalization/balance.csv +53 -54
- {financetoolkit-2.1.4 → financetoolkit-2.2.1}/financetoolkit/normalization/balance_yf.csv +80 -74
- {financetoolkit-2.1.4 → financetoolkit-2.2.1}/financetoolkit/normalization/cash.csv +39 -40
- {financetoolkit-2.1.4 → financetoolkit-2.2.1}/financetoolkit/normalization/cash_yf.csv +53 -52
- {financetoolkit-2.1.4 → financetoolkit-2.2.1}/financetoolkit/normalization/income_yf.csv +42 -36
- financetoolkit-2.2.1/financetoolkit/normalization/statistics_yf.csv +2 -0
- {financetoolkit-2.1.4 → financetoolkit-2.2.1}/financetoolkit/normalization_model.py +82 -83
- {financetoolkit-2.1.4 → financetoolkit-2.2.1}/financetoolkit/options/binomial_trees_model.py +187 -22
- financetoolkit-2.2.1/financetoolkit/options/black_scholes_model.py +783 -0
- financetoolkit-2.2.1/financetoolkit/options/exotics_model.py +380 -0
- {financetoolkit-2.1.4 → financetoolkit-2.2.1}/financetoolkit/options/greeks_model.py +76 -22
- {financetoolkit-2.1.4 → financetoolkit-2.2.1}/financetoolkit/options/helpers.py +13 -10
- {financetoolkit-2.1.4 → financetoolkit-2.2.1}/financetoolkit/options/options_controller.py +2003 -312
- financetoolkit-2.2.1/financetoolkit/options/options_model.py +255 -0
- financetoolkit-2.2.1/financetoolkit/options/risk_neutral_density_model.py +103 -0
- financetoolkit-2.2.1/financetoolkit/options/svi_model.py +257 -0
- {financetoolkit-2.1.4 → financetoolkit-2.2.1}/financetoolkit/performance/helpers.py +48 -48
- {financetoolkit-2.1.4 → financetoolkit-2.2.1}/financetoolkit/performance/performance_controller.py +1561 -452
- financetoolkit-2.2.1/financetoolkit/performance/performance_model.py +2676 -0
- financetoolkit-2.2.1/financetoolkit/portfolio/overview_model.py +949 -0
- {financetoolkit-2.1.4 → financetoolkit-2.2.1}/financetoolkit/portfolio/portfolio_controller.py +1648 -1599
- {financetoolkit-2.1.4 → financetoolkit-2.2.1}/financetoolkit/portfolio/portfolio_model.py +62 -40
- {financetoolkit-2.1.4 → financetoolkit-2.2.1}/financetoolkit/ratios/efficiency_model.py +99 -61
- financetoolkit-2.2.1/financetoolkit/ratios/liquidity_model.py +206 -0
- financetoolkit-2.2.1/financetoolkit/ratios/profitability_model.py +546 -0
- {financetoolkit-2.1.4 → financetoolkit-2.2.1}/financetoolkit/ratios/ratios_controller.py +1081 -301
- {financetoolkit-2.1.4 → financetoolkit-2.2.1}/financetoolkit/ratios/solvency_model.py +139 -45
- {financetoolkit-2.1.4 → financetoolkit-2.2.1}/financetoolkit/ratios/valuation_model.py +131 -80
- financetoolkit-2.2.1/financetoolkit/risk/__init__.py +0 -0
- financetoolkit-2.2.1/financetoolkit/risk/backtesting_model.py +298 -0
- financetoolkit-2.2.1/financetoolkit/risk/copula_model.py +951 -0
- financetoolkit-2.2.1/financetoolkit/risk/covar_model.py +172 -0
- financetoolkit-2.2.1/financetoolkit/risk/cvar_model.py +431 -0
- {financetoolkit-2.1.4 → financetoolkit-2.2.1}/financetoolkit/risk/evar_model.py +4 -11
- financetoolkit-2.2.1/financetoolkit/risk/garch_model.py +924 -0
- financetoolkit-2.2.1/financetoolkit/risk/helpers.py +93 -0
- financetoolkit-2.2.1/financetoolkit/risk/market_liquidity_model.py +212 -0
- financetoolkit-2.2.1/financetoolkit/risk/realized_volatility_model.py +490 -0
- financetoolkit-2.2.1/financetoolkit/risk/risk_controller.py +5216 -0
- {financetoolkit-2.1.4 → financetoolkit-2.2.1}/financetoolkit/risk/risk_model.py +517 -113
- financetoolkit-2.2.1/financetoolkit/risk/var_model.py +547 -0
- financetoolkit-2.2.1/financetoolkit/technicals/__init__.py +0 -0
- financetoolkit-2.2.1/financetoolkit/technicals/breadth_model.py +563 -0
- {financetoolkit-2.1.4 → financetoolkit-2.2.1}/financetoolkit/technicals/helpers.py +3 -2
- financetoolkit-2.2.1/financetoolkit/technicals/momentum_model.py +1164 -0
- financetoolkit-2.2.1/financetoolkit/technicals/overlap_model.py +734 -0
- {financetoolkit-2.1.4 → financetoolkit-2.2.1}/financetoolkit/technicals/technicals_controller.py +2606 -826
- financetoolkit-2.2.1/financetoolkit/technicals/volatility_model.py +536 -0
- {financetoolkit-2.1.4 → financetoolkit-2.2.1}/financetoolkit/toolkit_controller.py +990 -537
- financetoolkit-2.2.1/financetoolkit/utilities/dataframe_model.py +288 -0
- {financetoolkit-2.1.4 → financetoolkit-2.2.1}/financetoolkit/utilities/error_model.py +137 -40
- {financetoolkit-2.1.4 → financetoolkit-2.2.1}/financetoolkit/utilities/logger_model.py +2 -4
- {financetoolkit-2.1.4 → financetoolkit-2.2.1}/financetoolkit/utilities/requests_model.py +36 -2
- {financetoolkit-2.1.4 → financetoolkit-2.2.1}/financetoolkit/utilities/statistics_model.py +200 -35
- financetoolkit-2.2.1/financetoolkit/utilities/validation_model.py +153 -0
- {financetoolkit-2.1.4 → financetoolkit-2.2.1}/financetoolkit/yfinance_model.py +178 -40
- {financetoolkit-2.1.4 → financetoolkit-2.2.1}/pyproject.toml +35 -8
- financetoolkit-2.1.4/financetoolkit/economics/gmdb_model.py +0 -217
- financetoolkit-2.1.4/financetoolkit/economics/oecd_model.py +0 -666
- financetoolkit-2.1.4/financetoolkit/fixedincome/bond_model.py +0 -381
- financetoolkit-2.1.4/financetoolkit/fixedincome/derivative_model.py +0 -175
- financetoolkit-2.1.4/financetoolkit/fixedincome/euribor_model.py +0 -34
- financetoolkit-2.1.4/financetoolkit/fixedincome/helpers.py +0 -40
- financetoolkit-2.1.4/financetoolkit/helpers.py +0 -171
- financetoolkit-2.1.4/financetoolkit/historical_model.py +0 -479
- financetoolkit-2.1.4/financetoolkit/mcp_server/__init__.py +0 -1
- financetoolkit-2.1.4/financetoolkit/mcp_server/cache_model.py +0 -210
- financetoolkit-2.1.4/financetoolkit/models/enterprise_model.py +0 -72
- financetoolkit-2.1.4/financetoolkit/models/intrinsic_model.py +0 -158
- financetoolkit-2.1.4/financetoolkit/models/models_controller.py +0 -2530
- financetoolkit-2.1.4/financetoolkit/options/black_scholes_model.py +0 -99
- financetoolkit-2.1.4/financetoolkit/options/options_model.py +0 -74
- financetoolkit-2.1.4/financetoolkit/performance/performance_model.py +0 -1354
- financetoolkit-2.1.4/financetoolkit/portfolio/overview_model.py +0 -654
- financetoolkit-2.1.4/financetoolkit/ratios/liquidity_model.py +0 -143
- financetoolkit-2.1.4/financetoolkit/ratios/profitability_model.py +0 -390
- financetoolkit-2.1.4/financetoolkit/risk/cvar_model.py +0 -244
- financetoolkit-2.1.4/financetoolkit/risk/garch_model.py +0 -247
- financetoolkit-2.1.4/financetoolkit/risk/helpers.py +0 -89
- financetoolkit-2.1.4/financetoolkit/risk/risk_controller.py +0 -2570
- financetoolkit-2.1.4/financetoolkit/risk/var_model.py +0 -254
- financetoolkit-2.1.4/financetoolkit/technicals/breadth_model.py +0 -187
- financetoolkit-2.1.4/financetoolkit/technicals/momentum_model.py +0 -511
- financetoolkit-2.1.4/financetoolkit/technicals/overlap_model.py +0 -370
- financetoolkit-2.1.4/financetoolkit/technicals/volatility_model.py +0 -207
- financetoolkit-2.1.4/financetoolkit/utilities/cache_model.py +0 -82
- financetoolkit-2.1.4/financetoolkit/utilities/dataframe_model.py +0 -181
- {financetoolkit-2.1.4 → financetoolkit-2.2.1}/LICENSE.txt +0 -0
- {financetoolkit-2.1.4 → financetoolkit-2.2.1}/financetoolkit/__init__.py +0 -0
- {financetoolkit-2.1.4 → financetoolkit-2.2.1}/financetoolkit/discovery/__init__.py +0 -0
- {financetoolkit-2.1.4/financetoolkit/economics → financetoolkit-2.2.1/financetoolkit/econometrics}/__init__.py +0 -0
- {financetoolkit-2.1.4/financetoolkit/fixedincome → financetoolkit-2.2.1/financetoolkit/economics}/__init__.py +0 -0
- {financetoolkit-2.1.4/financetoolkit/models → financetoolkit-2.2.1/financetoolkit/fixedincome}/__init__.py +0 -0
- {financetoolkit-2.1.4 → financetoolkit-2.2.1}/financetoolkit/mcp_server/__main__.py +0 -0
- {financetoolkit-2.1.4 → financetoolkit-2.2.1}/financetoolkit/mcp_server/coercion_model.py +0 -0
- {financetoolkit-2.1.4 → financetoolkit-2.2.1}/financetoolkit/mcp_server/mcpb/.mcpbignore +0 -0
- {financetoolkit-2.1.4 → financetoolkit-2.2.1}/financetoolkit/mcp_server/mcpb/LICENSE +0 -0
- {financetoolkit-2.1.4 → financetoolkit-2.2.1}/financetoolkit/mcp_server/mcpb/README.md +0 -0
- {financetoolkit-2.1.4 → financetoolkit-2.2.1}/financetoolkit/mcp_server/mcpb/build-mcpb.sh +0 -0
- {financetoolkit-2.1.4 → financetoolkit-2.2.1}/financetoolkit/mcp_server/mcpb/finance_toolkit_icon.png +0 -0
- {financetoolkit-2.1.4 → financetoolkit-2.2.1}/financetoolkit/mcp_server/tools_model.py +0 -0
- {financetoolkit-2.1.4/financetoolkit/options → financetoolkit-2.2.1/financetoolkit/models}/__init__.py +0 -0
- {financetoolkit-2.1.4 → financetoolkit-2.2.1}/financetoolkit/models/beneish_model.py +0 -0
- {financetoolkit-2.1.4 → financetoolkit-2.2.1}/financetoolkit/normalization/income.csv +0 -0
- {financetoolkit-2.1.4 → financetoolkit-2.2.1}/financetoolkit/normalization/statistics.csv +0 -0
- {financetoolkit-2.1.4/financetoolkit/performance → financetoolkit-2.2.1/financetoolkit/options}/__init__.py +0 -0
- {financetoolkit-2.1.4/financetoolkit/portfolio → financetoolkit-2.2.1/financetoolkit/performance}/__init__.py +0 -0
- {financetoolkit-2.1.4/financetoolkit/ratios → financetoolkit-2.2.1/financetoolkit/portfolio}/__init__.py +0 -0
- {financetoolkit-2.1.4 → financetoolkit-2.2.1}/financetoolkit/portfolio/config.yaml +0 -0
- {financetoolkit-2.1.4 → financetoolkit-2.2.1}/financetoolkit/portfolio/example_datasets/example_portfolio.csv +0 -0
- {financetoolkit-2.1.4 → financetoolkit-2.2.1}/financetoolkit/portfolio/example_datasets/example_portfolio.xlsx +0 -0
- {financetoolkit-2.1.4 → financetoolkit-2.2.1}/financetoolkit/portfolio/helpers.py +0 -0
- /financetoolkit-2.1.4/financetoolkit/risk/__init__.py → /financetoolkit-2.2.1/financetoolkit/py.typed +0 -0
- {financetoolkit-2.1.4/financetoolkit/technicals → financetoolkit-2.2.1/financetoolkit/ratios}/__init__.py +0 -0
- {financetoolkit-2.1.4 → financetoolkit-2.2.1}/financetoolkit/ratios/helpers.py +0 -0
|
@@ -1,6 +1,6 @@
|
|
|
1
|
-
Metadata-Version: 2.
|
|
1
|
+
Metadata-Version: 2.5
|
|
2
2
|
Name: financetoolkit
|
|
3
|
-
Version: 2.1
|
|
3
|
+
Version: 2.2.1
|
|
4
4
|
Summary: Transparent and Efficient Financial Analysis
|
|
5
5
|
Author: Jeroen Bouma
|
|
6
6
|
License: MIT
|
|
@@ -10,25 +10,29 @@ Classifier: Development Status :: 5 - Production/Stable
|
|
|
10
10
|
Classifier: Intended Audience :: Financial and Insurance Industry
|
|
11
11
|
Classifier: License :: OSI Approved :: MIT License
|
|
12
12
|
Classifier: Operating System :: OS Independent
|
|
13
|
-
Classifier: Programming Language :: Python :: 3.10
|
|
14
13
|
Classifier: Programming Language :: Python :: 3.11
|
|
15
14
|
Classifier: Programming Language :: Python :: 3.12
|
|
16
15
|
Classifier: Programming Language :: Python :: 3.13
|
|
17
16
|
Classifier: Programming Language :: Python :: 3.14
|
|
18
17
|
Classifier: Programming Language :: Python :: 3.15
|
|
19
18
|
Classifier: Topic :: Office/Business :: Financial :: Investment
|
|
20
|
-
Requires-Python: <3.16,>=3.
|
|
19
|
+
Requires-Python: <3.16,>=3.11
|
|
21
20
|
Requires-Dist: openpyxl>=3.1
|
|
22
|
-
Requires-Dist: pandas>=
|
|
21
|
+
Requires-Dist: pandas>=3.0
|
|
22
|
+
Requires-Dist: pyyaml>=6.0
|
|
23
23
|
Requires-Dist: requests>=2.32
|
|
24
24
|
Requires-Dist: scikit-learn>=1.6
|
|
25
25
|
Requires-Dist: yfinance
|
|
26
|
+
Provides-Extra: econometrics
|
|
27
|
+
Requires-Dist: linearmodels>=6.0; extra == 'econometrics'
|
|
28
|
+
Requires-Dist: statsmodels>=0.14; extra == 'econometrics'
|
|
26
29
|
Provides-Extra: mcp
|
|
27
30
|
Requires-Dist: fastmcp>=3.4.2; extra == 'mcp'
|
|
28
|
-
Requires-Dist:
|
|
31
|
+
Requires-Dist: linearmodels>=6.0; extra == 'mcp'
|
|
32
|
+
Requires-Dist: mcp[cli]<2,>=1.27.0; extra == 'mcp'
|
|
29
33
|
Requires-Dist: python-dotenv>=1.0; extra == 'mcp'
|
|
30
|
-
Requires-Dist: pyyaml>=6.0; extra == 'mcp'
|
|
31
34
|
Requires-Dist: rich>=13.0; extra == 'mcp'
|
|
35
|
+
Requires-Dist: statsmodels>=0.14; extra == 'mcp'
|
|
32
36
|
Requires-Dist: tabulate>=0.9.0; extra == 'mcp'
|
|
33
37
|
Description-Content-Type: text/markdown
|
|
34
38
|
|
|
@@ -51,7 +55,7 @@ While browsing a variety of websites, I repeatedly observed significant fluctuat
|
|
|
51
55
|
|
|
52
56
|
For example, Microsoft's Price-to-Earnings (PE) ratio on the 6th of May, 2023 is reported to be 28.93 (Stockopedia), 32.05 (Morningstar), 32.66 (Macrotrends), 33.09 (Finance Charts), 33.66 (Y Charts), 33.67 (Wall Street Journal), 33.80 (Yahoo Finance) and 34.4 (Companies Market Cap). All of these calculations are correct, however the method of calculation varies leading to different results. Therefore, collecting data from multiple sources can lead to wrong interpretation of the results given that one source could apply a different definition than another. And that is, if that definition is even available as often the underlying methods are hidden behind a paid subscription.
|
|
53
57
|
|
|
54
|
-
**This is why I designed the FinanceToolkit**, this is an open-source toolkit in which all relevant financial
|
|
58
|
+
**This is why I designed the FinanceToolkit**, this is an open-source toolkit in which all relevant financial methods ([500+](https://www.jeroenbouma.com/projects/financetoolkit/docs)) are written down in the most simplistic way allowing for complete transparency of the method of calculation ([proof](https://github.com/JerBouma/FinanceToolkit/blob/main/financetoolkit/ratios/valuation_model.py)). This enables you to avoid dependence on metrics from other providers that do not provide their methods. With a large selection of financial statements in hand, it facilitates streamlined calculations, promoting the adoption of a consistent and universally understood methods and formulas.
|
|
55
59
|
|
|
56
60
|
Beyond Equities, it supports Options, Currencies, Cryptocurrencies, ETFs, Mutual Funds, Indices, Money Markets, Commodities, Key Economic Indicators and more, allowing you to obtain historical data as well as important performance and risk measurements such as the Sharpe Ratio and Value at Risk.
|
|
57
61
|
|
|
@@ -60,7 +64,7 @@ Complementing this is the [Finance Database 🌎](https://github.com/JerBouma/Fi
|
|
|
60
64
|
___
|
|
61
65
|
**🔌 The Finance Toolkit is also available as an [MCP Server](https://www.jeroenbouma.com/projects/financetoolkit/mcp)**
|
|
62
66
|
|
|
63
|
-
Query
|
|
67
|
+
Query 500+ methods from Claude, Copilot, Cursor, Windsurf or any MCP-compatible client without writing code.
|
|
64
68
|
|
|
65
69
|
- **Hosted:** connect to `https://financetoolkit.jeroenbouma.com/mcp` — OAuth handles the rest on first use.
|
|
66
70
|
- **Local:** `uvx --from "financetoolkit[mcp]" financetoolkit-mcp-setup` — sets up your client config and API key automatically. See [MCP Server Documentation](https://www.jeroenbouma.com/projects/financetoolkit/mcp#local-clients) for manual setup.
|
|
@@ -111,6 +115,8 @@ Through the link you are able to subscribe for the free plan and also premium pl
|
|
|
111
115
|
|
|
112
116
|
**By default, the Finance Toolkit prioritizes Financial Modeling Prep for data retrieval. If data acquisition from Financial Modeling Prep is unsuccessful (e.g., due to plan restrictions or API key issues), the toolkit automatically switches to Yahoo Finance as a secondary source.** To disable this fallback behavior and exclusively use Financial Modeling Prep, set `enforce_source="FinancialModelingPrep"` during Toolkit initialization. This configuration ensures that an error is raised if Financial Modeling Prep data cannot be accessed. Alternatively, you can set `enforce_source="YahooFinance"` to exclusively use Yahoo Finance as the data source.
|
|
113
117
|
|
|
118
|
+
The same `enforce_source` argument is also accepted per call on `get_historical_data`, `get_treasury_data` and the four statement functions (`get_balance_sheet_statement`, `get_income_statement`, `get_cash_flow_statement` and `get_statistics_statement`), where it overrides whatever the Toolkit was initialised with.
|
|
119
|
+
|
|
114
120
|
# Functionality
|
|
115
121
|
|
|
116
122
|
This section is an introduction to the Finance Toolkit. Find with the link below fully-fledged code documentation as well as Jupyter Notebooks in which you can see many examples ranging from basic examples to creating custom ratios to working with your own datasets.
|
|
@@ -168,12 +174,12 @@ Which returns:
|
|
|
168
174
|
| SAF.PA | Safran SA | 66234006559 | Industrials | Aerospace & Defense | 1.339 | 160.16 | 1.35 | Paris | FR |
|
|
169
175
|
| ROST | Ross Stores, Inc. | 46724188589 | Consumer Cyclical | Apparel Retail | 1.026 | 138.785 | 1.34 | NASDAQ Global Select | US |
|
|
170
176
|
|
|
171
|
-
Furthermore, you can find in this module [stock screeners](https://www.jeroenbouma.com/projects/financetoolkit/docs/discovery
|
|
177
|
+
Furthermore, you can find in this module [stock screeners](https://www.jeroenbouma.com/projects/financetoolkit/docs/discovery/stock-screener), [sector/industry performance](https://www.jeroenbouma.com/projects/financetoolkit/docs/discovery/sector-performance) and [news feeds](https://www.jeroenbouma.com/projects/financetoolkit/docs/discovery/stock-market-news) and more. **Find the Notebook [here](https://www.jeroenbouma.com/projects/financetoolkit/discovery-notebook) and the full instrument discovery documentation [here](https://www.jeroenbouma.com/projects/financetoolkit/docs/discovery).**
|
|
172
178
|
|
|
173
179
|
|
|
174
180
|
### Obtaining Historical Data
|
|
175
181
|
|
|
176
|
-
Obtain [historical data](https://www.jeroenbouma.com/projects/financetoolkit/docs
|
|
182
|
+
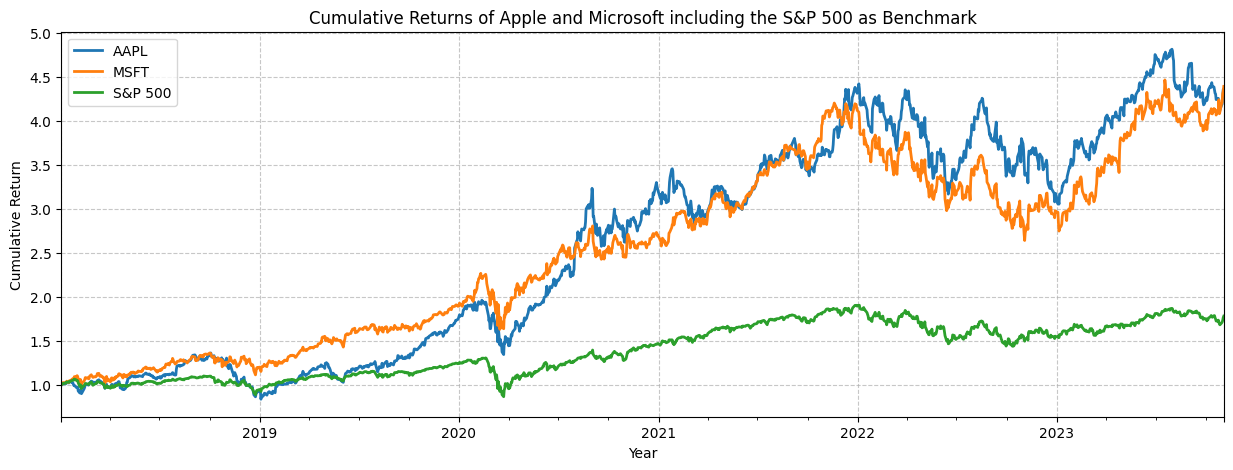
Obtain [historical data](https://www.jeroenbouma.com/projects/financetoolkit/docs/historical-data) on a daily, weekly, monthly or yearly basis. This includes OHLC, volumes, dividends, returns and cumulative returns for each corresponding period.
|
|
177
183
|
|
|
178
184
|
```python
|
|
179
185
|
# Obtain historical market data for all tickers
|
|
@@ -197,11 +203,11 @@ And below the cumulative returns are plotted which include the S&P 500 as benchm
|
|
|
197
203
|
|
|
198
204
|
|
|
199
205
|
|
|
200
|
-
Metrics such as `Volatility`, `Excess Return` and `Excess Volatility` are calculated as dedicated [Risk](https://www.jeroenbouma.com/projects/financetoolkit/docs/risk
|
|
206
|
+
Metrics such as `Volatility`, `Excess Return` and `Excess Volatility` are calculated as dedicated [Risk](https://www.jeroenbouma.com/projects/financetoolkit/docs/risk/volatility) and [Performance](https://www.jeroenbouma.com/projects/financetoolkit/docs/performance/excess-return) methods rather than columns on this table to create more efficient and flexible functionalities. **Find the Notebook [here](https://www.jeroenbouma.com/projects/financetoolkit/getting-started) and the full historical data documentation [here](https://www.jeroenbouma.com/projects/financetoolkit/docs/historical-data).**
|
|
201
207
|
|
|
202
208
|
### Obtaining Financial Statements
|
|
203
209
|
|
|
204
|
-
Obtain an [Income Statement](https://www.jeroenbouma.com/projects/financetoolkit/docs
|
|
210
|
+
Obtain an [Income Statement](https://www.jeroenbouma.com/projects/financetoolkit/docs/income-statements) on an annual or quarterly basis. This can also be a [balance statement](https://www.jeroenbouma.com/projects/financetoolkit/docs/balance-sheet-statements) or [cash flow statement](https://www.jeroenbouma.com/projects/financetoolkit/docs/cash-flow-statements).
|
|
205
211
|
|
|
206
212
|
```python
|
|
207
213
|
# Obtain the Income Statement for all tickers
|
|
@@ -227,7 +233,7 @@ And below the Earnings Before Interest, Taxes, Depreciation and Amortization (EB
|
|
|
227
233
|
|
|
228
234
|
### Obtaining Financial Ratios
|
|
229
235
|
|
|
230
|
-
Get [Profitability Ratios](https://www.jeroenbouma.com/projects/financetoolkit/docs/ratios
|
|
236
|
+
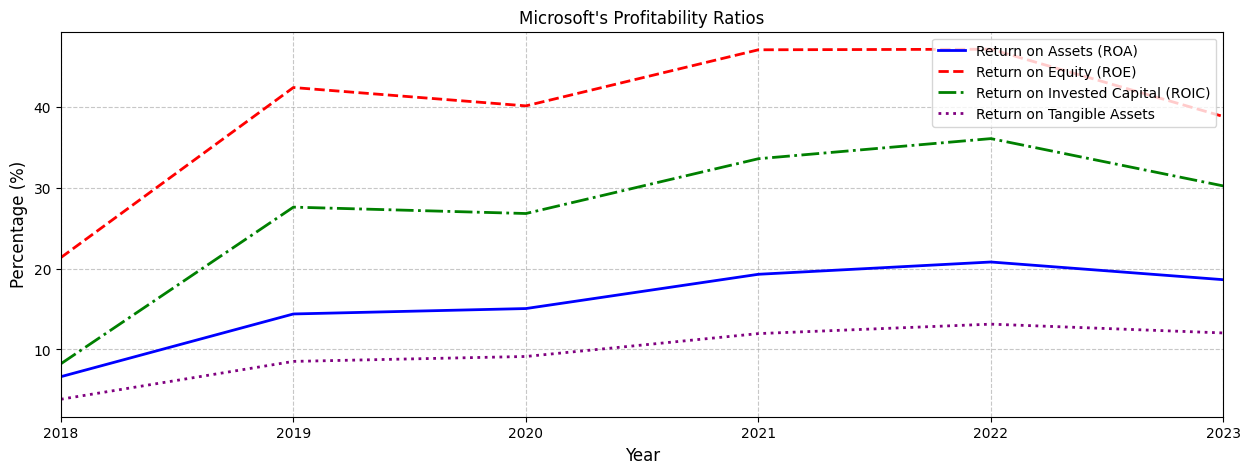
Get [Profitability Ratios](https://www.jeroenbouma.com/projects/financetoolkit/docs/ratios/all-profitability-ratios) based on the inputted balance sheet, income and cash flow statements. This can be any of the 80+ ratios within the `ratios` module.
|
|
231
237
|
|
|
232
238
|
```python
|
|
233
239
|
# Collect all Profitability Ratios for all tickers
|
|
@@ -251,11 +257,11 @@ And below a few of the profitability ratios are plotted for Microsoft.
|
|
|
251
257
|
|
|
252
258
|
|
|
253
259
|
|
|
254
|
-
The 80+ ratios are divided into five categories: [**Efficiency**](https://www.jeroenbouma.com/projects/financetoolkit/docs/ratios
|
|
260
|
+
The 80+ ratios are divided into five categories: [**Efficiency**](https://www.jeroenbouma.com/projects/financetoolkit/docs/ratios/all-efficiency-ratios) (asset/inventory/receivables turnover, cash conversion cycle, R&D/SG&A/SBC-to-revenue), [**Liquidity**](https://www.jeroenbouma.com/projects/financetoolkit/docs/ratios/all-liquidity-ratios) (current, quick and cash ratios, working capital), [**Profitability**](https://www.jeroenbouma.com/projects/financetoolkit/docs/ratios/all-profitability-ratios) (margins, ROE/ROA/ROIC, cash vs. effective tax rate), [**Solvency**](https://www.jeroenbouma.com/projects/financetoolkit/docs/ratios/all-solvency-ratios) (debt-to-equity, debt-to-capital, interest and dividend coverage) and [**Valuation**](https://www.jeroenbouma.com/projects/financetoolkit/docs/ratios/all-valuation-ratios) (P/E, PEG, Forward P/E, EV multiples, buyback and shareholder yield). It's also possible to define fully [custom ratios](https://www.jeroenbouma.com/projects/financetoolkit/docs/ratios/custom-ratios) calculated automatically from the balance sheet, income and cash flow statements. **Find the Notebook [here](https://www.jeroenbouma.com/projects/financetoolkit/ratios-notebook) and the full ratio-by-ratio documentation [here](https://www.jeroenbouma.com/projects/financetoolkit/docs/ratios).**
|
|
255
261
|
|
|
256
262
|
### Obtaining Financial Models
|
|
257
263
|
|
|
258
|
-
Get an [Extended DuPont Analysis](https://www.jeroenbouma.com/projects/financetoolkit/docs/models
|
|
264
|
+
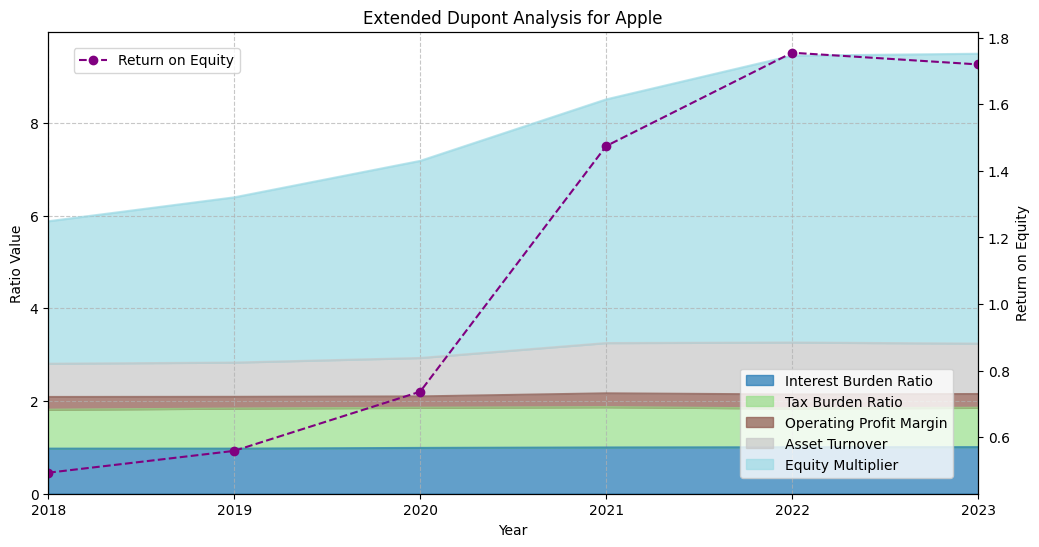
Get an [Extended DuPont Analysis](https://www.jeroenbouma.com/projects/financetoolkit/docs/models/extended-dupont-analysis) based on the inputted balance sheet, income and cash flow statements.
|
|
259
265
|
|
|
260
266
|
```python
|
|
261
267
|
# Get the Extended DuPont Analysis for all tickers
|
|
@@ -280,11 +286,11 @@ And below each component of the Extended Dupont Analysis is plotted including th
|
|
|
280
286
|
|
|
281
287
|
|
|
282
288
|
|
|
283
|
-
The `models` module covers 10+ models in total, for example [DuPont Analysis](https://www.jeroenbouma.com/projects/financetoolkit/docs/models
|
|
289
|
+
The `models` module covers 10+ models in total, for example [DuPont Analysis](https://www.jeroenbouma.com/projects/financetoolkit/docs/models/dupont-analysis), [WACC](https://www.jeroenbouma.com/projects/financetoolkit/docs/models/weighted-average-cost-of-capital-wacc), [Economic Value Added (EVA)](https://www.jeroenbouma.com/projects/financetoolkit/docs/models/economic-value-added-eva), [Altman Z-Score](https://www.jeroenbouma.com/projects/financetoolkit/docs/models/altman-z-score), [Beneish M-Score](https://www.jeroenbouma.com/projects/financetoolkit/docs/models/beneish-m-score) and the [Graham Number](https://www.jeroenbouma.com/projects/financetoolkit/docs/models/graham-number). **Find the Notebook [here](https://www.jeroenbouma.com/projects/financetoolkit/models-notebook) and the full model-by-model documentation [here](https://www.jeroenbouma.com/projects/financetoolkit/docs/models).**
|
|
284
290
|
|
|
285
291
|
### Obtaining Options and Greeks
|
|
286
292
|
|
|
287
|
-
Get the [Black Scholes Model](https://www.jeroenbouma.com/projects/financetoolkit/docs/options
|
|
293
|
+
Get the [Black Scholes Model](https://www.jeroenbouma.com/projects/financetoolkit/docs/options/black-scholes-model) for both call and put options including the relevant Greeks, in this case [Delta](https://www.jeroenbouma.com/projects/financetoolkit/docs/options/delta), [Gamma](https://www.jeroenbouma.com/projects/financetoolkit/docs/options/gamma), [Theta](https://www.jeroenbouma.com/projects/financetoolkit/docs/options/theta) and [Vega](https://www.jeroenbouma.com/projects/financetoolkit/docs/options/vega). This can be any of the First, Second or Third Order Greeks.
|
|
288
294
|
|
|
289
295
|
```python
|
|
290
296
|
# Get Delta for all tickers across strikes and expirations
|
|
@@ -308,11 +314,11 @@ Which can also be plotted together with Gamma, Theta and Vega as follows:
|
|
|
308
314
|
|
|
309
315
|

|
|
310
316
|
|
|
311
|
-
The `options` module is divided into four categories: [**Option Pricing**](https://www.jeroenbouma.com/projects/financetoolkit/docs/options
|
|
317
|
+
The `options` module is divided into four categories: [**Option Pricing**](https://www.jeroenbouma.com/projects/financetoolkit/docs/options/black-scholes-model) (Black-Scholes, Binomial Model, Implied Volatility), [**First-Order Greeks**](https://www.jeroenbouma.com/projects/financetoolkit/docs/options/first-order-greeks) (Delta, Vega, Theta, Rho), [**Second-Order Greeks**](https://www.jeroenbouma.com/projects/financetoolkit/docs/options/second-order-greeks) (Gamma, Vanna, Charm, Vomma) and [**Third-Order Greeks**](https://www.jeroenbouma.com/projects/financetoolkit/docs/options/third-order-greeks) (Speed, Zomma, Color, Ultima). **Find the Notebook [here](https://www.jeroenbouma.com/projects/financetoolkit/options-notebook) and the full option pricing and Greeks documentation [here](https://www.jeroenbouma.com/projects/financetoolkit/docs/options).**
|
|
312
318
|
|
|
313
319
|
### Obtaining Performance Metrics
|
|
314
320
|
|
|
315
|
-
Get the correlations with the [factors as defined by Fama-and-French](https://www.jeroenbouma.com/projects/financetoolkit/docs/performance
|
|
321
|
+
Get the correlations with the [factors as defined by Fama-and-French](https://www.jeroenbouma.com/projects/financetoolkit/docs/performance/factor-asset-correlations). These include market, size, value, operating profitability and investment. The beauty of all functionality here is that it can be based on any period as the function accepts the period `intraday`, `weekly`, `monthly`, `quarterly` and `yearly`.
|
|
316
322
|
|
|
317
323
|
```python
|
|
318
324
|
# Get the Fama-French factor correlations for all tickers, quarterly
|
|
@@ -336,11 +342,11 @@ And below the correlations with each factor are plotted over time for both Apple
|
|
|
336
342
|
|
|
337
343
|

|
|
338
344
|
|
|
339
|
-
Beyond Beta, CAPM and the Fama-French factors, the `performance` module covers around 20+ metrics in total, for example [Sharpe Ratio](https://www.jeroenbouma.com/projects/financetoolkit/docs/performance
|
|
345
|
+
Beyond Beta, CAPM and the Fama-French factors, the `performance` module covers around 20+ metrics in total, for example [Sharpe Ratio](https://www.jeroenbouma.com/projects/financetoolkit/docs/performance/sharpe-ratio), [Sortino Ratio](https://www.jeroenbouma.com/projects/financetoolkit/docs/performance/sortino-ratio), [Calmar Ratio](https://www.jeroenbouma.com/projects/financetoolkit/docs/performance/calmar-ratio), [Omega Ratio](https://www.jeroenbouma.com/projects/financetoolkit/docs/performance/omega-ratio) and the [Correlation Matrix](https://www.jeroenbouma.com/projects/financetoolkit/docs/performance/correlation-matrix). Most of these also support `rolling=<n>` for a value that evolves through time instead of one number per period. **Find the Notebook [here](https://www.jeroenbouma.com/projects/financetoolkit/performance-notebook) and the full performance metric documentation [here](https://www.jeroenbouma.com/projects/financetoolkit/docs/performance).**
|
|
340
346
|
|
|
341
347
|
### Obtaining Risk Metrics
|
|
342
348
|
|
|
343
|
-
Get the [Value at Risk](https://www.jeroenbouma.com/projects/financetoolkit/docs/risk
|
|
349
|
+
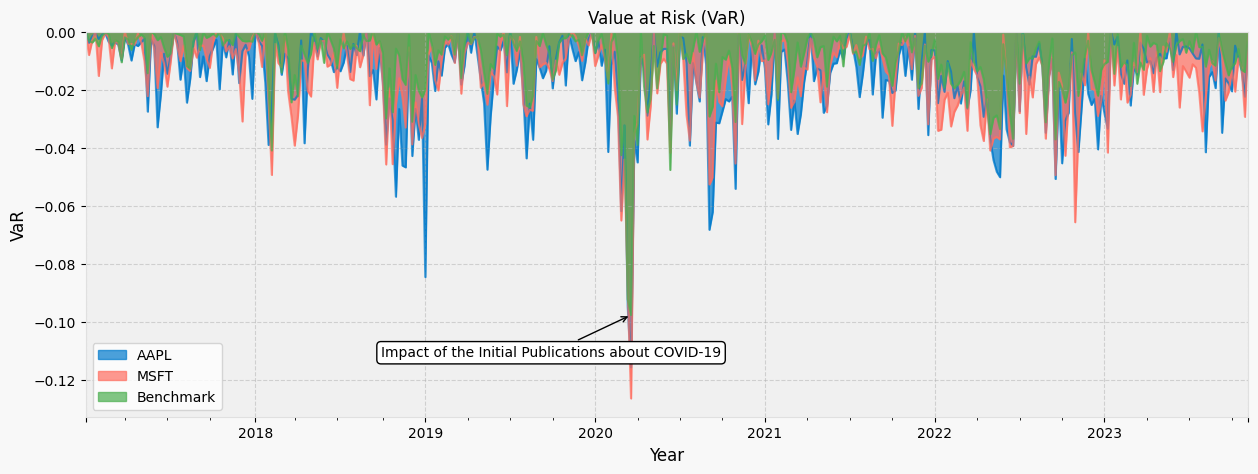
Get the [Value at Risk](https://www.jeroenbouma.com/projects/financetoolkit/docs/risk/value-at-risk-var) for each week. Here, the days within each week are considered for the Value at Risk. This makes it so that you can understand within each period what is the expected Value at Risk (VaR) which can again be any period but also based on distributions such as Historical, Gaussian, Student-t, Cornish-Fisher, or a Peak-over-Threshold Extreme Value Theory (`distribution="evt"`) fit for the tail.
|
|
344
350
|
|
|
345
351
|
```python
|
|
346
352
|
# Get the weekly Value at Risk for all tickers
|
|
@@ -359,11 +365,11 @@ And below the Value at Risk (VaR) for Apple, Microsoft and the benchmark (S&P 50
|
|
|
359
365
|
|
|
360
366
|
|
|
361
367
|
|
|
362
|
-
Beyond VaR/CVaR/Entropic VaR, the `risk` module covers around 20+ metrics in total, for example [Conditional Drawdown at Risk](https://www.jeroenbouma.com/projects/financetoolkit/docs/risk
|
|
368
|
+
Beyond VaR/CVaR/Entropic VaR, the `risk` module covers around 20+ metrics in total, for example [Conditional Drawdown at Risk](https://www.jeroenbouma.com/projects/financetoolkit/docs/risk/conditional-drawdown-at-risk-cdar), [Maximum Drawdown Duration](https://www.jeroenbouma.com/projects/financetoolkit/docs/risk/maximum-drawdown-duration), [EWMA Volatility](https://www.jeroenbouma.com/projects/financetoolkit/docs/risk/ewma-volatility) and the [Hurst Exponent](https://www.jeroenbouma.com/projects/financetoolkit/docs/risk/hurst-exponent). Most of these support `rolling=<n>` for a value that evolves through time instead of one number per period. **Find the Notebook [here](https://www.jeroenbouma.com/projects/financetoolkit/risk-notebook) and the full risk metric documentation [here](https://www.jeroenbouma.com/projects/financetoolkit/docs/risk).**
|
|
363
369
|
|
|
364
370
|
### Obtaining Technical Indicators
|
|
365
371
|
|
|
366
|
-
Get the [Ichimoku Cloud](https://www.jeroenbouma.com/projects/financetoolkit/docs/technicals
|
|
372
|
+
Get the [Ichimoku Cloud](https://www.jeroenbouma.com/projects/financetoolkit/docs/technicals/ichimoku-cloud) parameters based on the historical market data. This can be any of the 40+ technical indicators within the `technicals` module.
|
|
367
373
|
|
|
368
374
|
```python
|
|
369
375
|
# Get the Ichimoku Cloud for all tickers
|
|
@@ -387,11 +393,11 @@ And below the Ichimoku Cloud parameters are plotted for Apple and Microsoft side
|
|
|
387
393
|
|
|
388
394
|
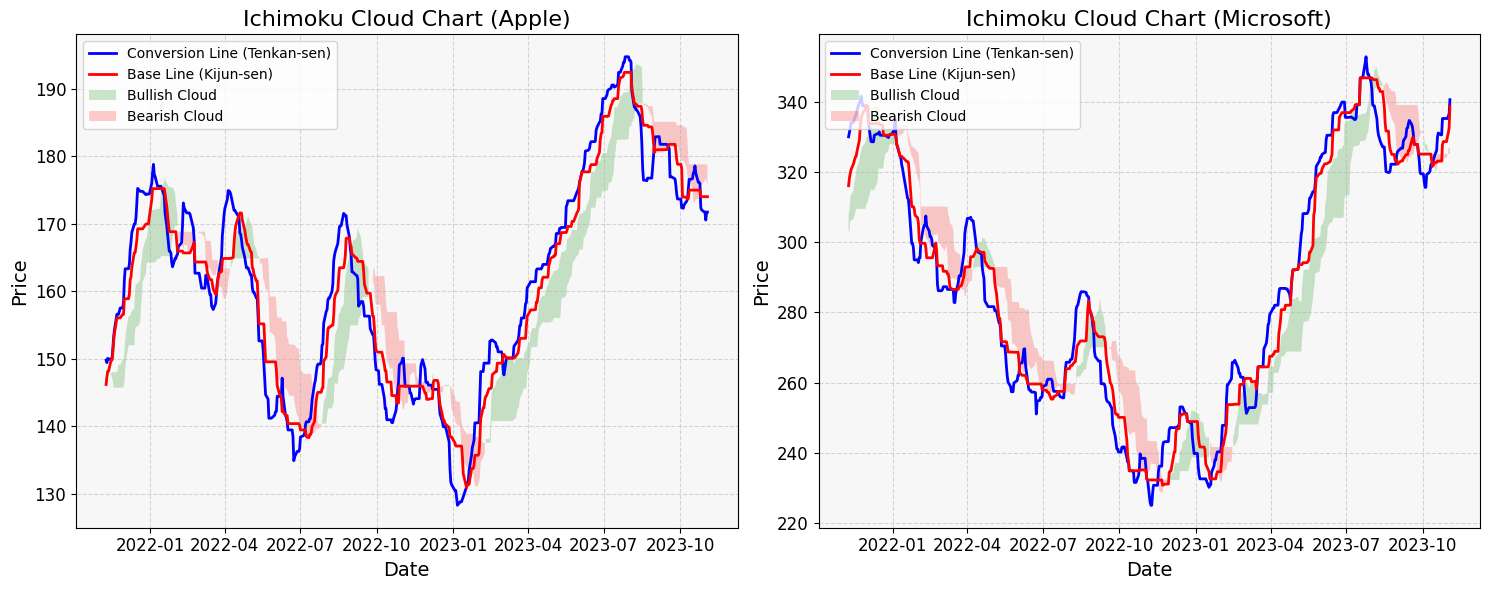
|
|
389
395
|
|
|
390
|
-
The 40+ indicators are divided into four categories: [**Breadth**](https://www.jeroenbouma.com/projects/financetoolkit/docs/technicals
|
|
396
|
+
The 40+ indicators are divided into four categories: [**Breadth**](https://www.jeroenbouma.com/projects/financetoolkit/docs/technicals/all-breadth-indicators) (McClellan Oscillator, Advancers/Decliners, OBV, ADL, Chaikin Oscillator, TRIN, New Highs - New Lows), [**Momentum**](https://www.jeroenbouma.com/projects/financetoolkit/docs/technicals/all-momentum-indicators) (RSI, MACD, Stochastic, Williams %R, Aroon, CCI, ADX and more), [**Overlap**](https://www.jeroenbouma.com/projects/financetoolkit/docs/technicals/all-overlap-indicators) (SMA, EMA, DEMA, TRIX, WMA, Hull MA, VWAP, Parabolic SAR, Pivot Points, Support/Resistance) and [**Volatility**](https://www.jeroenbouma.com/projects/financetoolkit/docs/technicals/all-volatility-indicators) (ATR, Keltner Channels, Bollinger Bands, Donchian Channels, Volatility Cone). **Find the Notebook [here](https://www.jeroenbouma.com/projects/financetoolkit/technicals-notebook) and the full technical indicator documentation [here](https://www.jeroenbouma.com/projects/financetoolkit/docs/technicals).**
|
|
391
397
|
|
|
392
398
|
### Obtaining Fixed Income Metrics
|
|
393
399
|
|
|
394
|
-
Get access to the [ICE BofA Corporate Bond](https://www.jeroenbouma.com/projects/financetoolkit/docs/fixedincome
|
|
400
|
+
Get access to the [ICE BofA Corporate Bond](https://www.jeroenbouma.com/projects/financetoolkit/docs/fixedincome/effective-yield) benchmark indices and a variety of other bond and derivative related valuations within the `fixedincome` module.
|
|
395
401
|
|
|
396
402
|
```python
|
|
397
403
|
# Get the ICE BofA Effective Yield for each Credit Rating
|
|
@@ -412,11 +418,11 @@ And below a variety of Fixed Income metrics are shown all acquired from the Fixe
|
|
|
412
418
|
|
|
413
419
|

|
|
414
420
|
|
|
415
|
-
Beyond ICE BofA benchmarks, the `fixedincome` module covers [**Bond Valuations**](https://www.jeroenbouma.com/projects/financetoolkit/docs/fixedincome
|
|
421
|
+
Beyond ICE BofA benchmarks, the `fixedincome` module covers [**Bond Valuations**](https://www.jeroenbouma.com/projects/financetoolkit/docs/fixedincome/general-statistics) (Present Value, Macaulay/Modified Duration, Convexity, Yield to Maturity), [**Derivative Valuations**](https://www.jeroenbouma.com/projects/financetoolkit/docs/fixedincome/black-model) (Black and Bachelier models for Swaptions), [**Government Bonds**](https://www.jeroenbouma.com/projects/financetoolkit/docs/fixedincome/3-month-government-bond-yield) (3-month and 10-year yields) and **Central Bank rates** ([Euribor](https://www.jeroenbouma.com/projects/financetoolkit/docs/fixedincome/euro-interbank-offered-rate-euribor), [ECB](https://www.jeroenbouma.com/projects/financetoolkit/docs/fixedincome/main-refinancing-operations-ecb) and [Federal Reserve rates](https://www.jeroenbouma.com/projects/financetoolkit/docs/fixedincome/secured-overnight-financing-rate-sofr) incl. SOFR). It can be called via `companies.fixedincome` or standalone through `from financetoolkit import FixedIncome`. **Find the Notebook [here](https://www.jeroenbouma.com/projects/financetoolkit/fixed-income-notebook) and the full fixed income documentation [here](https://www.jeroenbouma.com/projects/financetoolkit/docs/fixedincome).**
|
|
416
422
|
|
|
417
423
|
### Understanding Key Economic Indicators
|
|
418
424
|
|
|
419
|
-
Get insights for 60+ countries into key economic indicators such as the [Consumer Price Index (CPI)](https://www.jeroenbouma.com/projects/financetoolkit/docs/economics
|
|
425
|
+
Get insights for 60+ countries into key economic indicators such as the [Consumer Price Index (CPI)](https://www.jeroenbouma.com/projects/financetoolkit/docs/economics/consumer-price-index), [Gross Domestic Product (GDP)](https://www.jeroenbouma.com/projects/financetoolkit/docs/economics/gross-domestic-product-gdp), [Unemployment Rates](https://www.jeroenbouma.com/projects/financetoolkit/docs/economics/unemployment-rates) and [3-month](https://www.jeroenbouma.com/projects/financetoolkit/docs/economics/short-term-interest-rate) and [10-year](https://www.jeroenbouma.com/projects/financetoolkit/docs/economics/long-term-interest-rate) Government Interest Rates. This is done through the `economics` module and can be used as a standalone module as well by using `from financetoolkit import Economics`.
|
|
420
426
|
|
|
421
427
|
```python
|
|
422
428
|
# Get the Unemployment Rate for a selection of countries
|
|
@@ -438,7 +444,7 @@ And below these Unemployment Rates are plotted over time:
|
|
|
438
444
|
|
|
439
445
|

|
|
440
446
|
|
|
441
|
-
The 40+ indicators are divided into five categories: [**Government**](https://www.jeroenbouma.com/projects/financetoolkit/docs/economics
|
|
447
|
+
The 40+ indicators are divided into five categories: [**Government**](https://www.jeroenbouma.com/projects/financetoolkit/docs/economics/government-debt) (GDP, government debt/revenue/expenditure/deficit, trust in government), [**Economy**](https://www.jeroenbouma.com/projects/financetoolkit/docs/economics/consumer-price-index) (CPI, inflation, consumer/business confidence, house/rent/share prices), [**Finance**](https://www.jeroenbouma.com/projects/financetoolkit/docs/economics/money-supply) (money supply, central bank policy rate, short/long-term interest rates), [**Environment**](https://www.jeroenbouma.com/projects/financetoolkit/docs/economics/renewable-energy) (renewable energy, carbon footprint) and [**Jobs & Society**](https://www.jeroenbouma.com/projects/financetoolkit/docs/economics/unemployment-rates) (unemployment, labour productivity, income inequality, population, poverty rate). **Find the Notebook [here](https://www.jeroenbouma.com/projects/financetoolkit/economics-notebook) and the full economic indicator documentation [here](https://www.jeroenbouma.com/projects/financetoolkit/docs/economics).**
|
|
442
448
|
|
|
443
449
|
### Explore your own Portfolio
|
|
444
450
|
|
|
@@ -475,9 +481,37 @@ In which the weights and returns can be depicted as follows:
|
|
|
475
481
|
|
|
476
482
|

|
|
477
483
|
|
|
484
|
+
### Applying Econometric Techniques
|
|
485
|
+
|
|
486
|
+
The `econometrics` module provides [regression](https://www.jeroenbouma.com/projects/financetoolkit/docs/econometrics/ordinary-least-squares-ols), [hypothesis testing](https://www.jeroenbouma.com/projects/financetoolkit/docs/econometrics/jarque-bera-test), [unit root and cointegration](https://www.jeroenbouma.com/projects/financetoolkit/docs/econometrics/augmented-dickey-fuller-adf), [Granger causality](https://www.jeroenbouma.com/projects/financetoolkit/docs/econometrics/granger-causality) and [panel data](https://www.jeroenbouma.com/projects/financetoolkit/docs/econometrics/fixed-effects) methods built on `statsmodels` and `linearmodels`. It requires the optional `financetoolkit[econometrics]` extra (`pip install financetoolkit[econometrics]`) and can be used via `companies.econometrics`.
|
|
487
|
+
|
|
488
|
+
```python
|
|
489
|
+
# AAPL is the Toolkit's first ticker, so it's the default dependent ticker;
|
|
490
|
+
# every other ticker becomes the default independent set
|
|
491
|
+
companies.econometrics.get_ols(period="weekly")
|
|
492
|
+
```
|
|
493
|
+
|
|
494
|
+
Regressing Apple's returns on a mix of its chip suppliers, megacap peers and two unrelated names (Benchmark excluded) gives:
|
|
495
|
+
|
|
496
|
+
| | Coefficient | Std. Error | t-Statistic | P-Value |
|
|
497
|
+
|:----------|--------------:|-------------:|--------------:|----------:|
|
|
498
|
+
| Intercept | 0.0028 | 0.0017 | 1.6815 | 0.0943 |
|
|
499
|
+
| TSM | -0.0054 | 0.0523 | -0.1028 | 0.9182 |
|
|
500
|
+
| QCOM | 0.1432 | 0.0361 | 3.9717 | 0.0001 |
|
|
501
|
+
| SWKS | 0.2141 | 0.0484 | 4.4221 | 0.0000 |
|
|
502
|
+
| MSFT | 0.3036 | 0.0864 | 3.5144 | 0.0005 |
|
|
503
|
+
| GOOGL | 0.1448 | 0.0689 | 2.1015 | 0.0369 |
|
|
504
|
+
| AMZN | 0.0617 | 0.0529 | 1.1664 | 0.2448 |
|
|
505
|
+
| META | -0.0132 | 0.0389 | -0.3398 | 0.7343 |
|
|
506
|
+
| NVDA | -0.0024 | 0.0415 | -0.0575 | 0.9542 |
|
|
507
|
+
| XOM | -0.0291 | 0.0373 | -0.7799 | 0.4364 |
|
|
508
|
+
| PG | 0.2858 | 0.0707 | 4.0393 | 0.0001 |
|
|
509
|
+
|
|
510
|
+
Only `QCOM`, `SWKS`, `MSFT` and `GOOGL` come out statistically significant once every regressor is controlled for at once. The `econometrics` module covers 48 methods in total, including [unit root tests](https://www.jeroenbouma.com/projects/financetoolkit/docs/econometrics/augmented-dickey-fuller-adf) (ADF, KPSS, Phillips-Perron), [cointegration and Granger causality](https://www.jeroenbouma.com/projects/financetoolkit/docs/econometrics/engle-granger-cointegration), [panel data estimators](https://www.jeroenbouma.com/projects/financetoolkit/docs/econometrics/fixed-effects) (Fixed/Random Effects), [causal inference](https://www.jeroenbouma.com/projects/financetoolkit/docs/econometrics/propensity-score-matching-psm) (IV-2SLS, Difference-in-Differences, Regression Discontinuity, Propensity Score Matching, Synthetic Control) and [time-series forecasting](https://www.jeroenbouma.com/projects/financetoolkit/docs/econometrics/arima-forecast) (ARIMA, VAR, VECM). **Find the Notebook [here](https://www.jeroenbouma.com/projects/financetoolkit/econometrics-notebook) and the full econometrics documentation [here](https://www.jeroenbouma.com/projects/financetoolkit/docs/econometrics).**
|
|
511
|
+
|
|
478
512
|
# MCP Server
|
|
479
513
|
|
|
480
|
-
The Finance Toolkit MCP Server exposes
|
|
514
|
+
The Finance Toolkit MCP Server exposes 500+ financial methods directly to any AI assistant that supports the [Model Context Protocol](https://modelcontextprotocol.io) (MCP). Ask questions in plain English — the AI fetches live financial data on your behalf, backed by the transparent, open-source calculation methods of the Finance Toolkit.
|
|
481
515
|
|
|
482
516
|
See an example of the Finance Toolkit MCP server in action in Claude Desktop below:
|
|
483
517
|
|
|
@@ -538,23 +572,37 @@ Most functions will have the option to define the `trailing` parameter. This let
|
|
|
538
572
|
|
|
539
573
|
> **How can I save the data periodically so that I don't have to retrieve it every single time again?**
|
|
540
574
|
|
|
541
|
-
The Toolkit has the option to work with cached data through `use_cached_data=True` when initializing the Toolkit class.
|
|
575
|
+
The Toolkit has the option to work with cached data through `use_cached_data=True` when initializing the Toolkit class. Any data that comes from an external source (financial statements, historical prices, economic indicators, and so on) is then stored in a local SQLite database and reused on the next run. Anything the Toolkit calculates itself is never cached, it is always derived from that data on demand.
|
|
576
|
+
|
|
577
|
+
The cache keeps track of what it already holds per ticker and per date range, which means changing a parameter does not throw the rest away:
|
|
542
578
|
|
|
543
|
-
|
|
579
|
+
- Repeating the same request retrieves nothing at all.
|
|
580
|
+
- Widening the period only retrieves the years that were missing.
|
|
581
|
+
- Adding a ticker only retrieves that one ticker.
|
|
544
582
|
|
|
545
|
-
|
|
583
|
+
By default the database lives in your user configuration directory, which is the same one the MCP server uses, so both share a single cache. You can also select a specific location by providing a string to the `use_cached_data` parameter, which will store the database in the provided folder.
|
|
546
584
|
|
|
547
|
-
|
|
585
|
+
To see what is currently stored, use `toolkit.get_cache_contents()`. It reports the entries grouped by source and dataset:
|
|
548
586
|
|
|
549
|
-
|
|
587
|
+
| source | dataset | entities | entries | oldest_write | newest_write |
|
|
588
|
+
|:----------------------|:-----------|---------:|--------:|:--------------------|:--------------------|
|
|
589
|
+
| FinancialModelingPrep | historical | 2 | 2 | 2025-01-14 09:12:03 | 2025-01-14 09:12:05 |
|
|
590
|
+
| FinancialModelingPrep | statements | 2 | 2 | 2025-01-14 09:12:01 | 2025-01-14 09:12:02 |
|
|
550
591
|
|
|
551
|
-
|
|
592
|
+
The Finance Toolkit never clears the cache on its own, not even when its own internal structure changes. Removing data is always something you ask for explicitly with `toolkit.clear_cache()`, and it can be narrowed instead of wholesale:
|
|
552
593
|
|
|
553
|
-
|
|
594
|
+
```python
|
|
595
|
+
# Remove only the price history of a single ticker
|
|
596
|
+
toolkit.clear_cache(source="FinancialModelingPrep", ticker="AAPL")
|
|
597
|
+
|
|
598
|
+
# Remove everything retrieved from the OECD
|
|
599
|
+
toolkit.clear_cache(source="OECD")
|
|
554
600
|
|
|
555
|
-
|
|
601
|
+
# Remove the entire cache, which has to be confirmed
|
|
602
|
+
toolkit.clear_cache(confirm=True)
|
|
603
|
+
```
|
|
556
604
|
|
|
557
|
-
|
|
605
|
+
The `source` names match the ones used by the `enforce_source` parameter, so "FinancialModelingPrep" and "YahooFinance" mean the same thing in both places.
|
|
558
606
|
|
|
559
607
|
> **What is the "Benchmark" that is automatically obtained when acquiring historical data?**
|
|
560
608
|
|
|
@@ -562,7 +610,7 @@ This is related to the `benchmark_ticker` parameter which is set to "SPY" (S&P 5
|
|
|
562
610
|
|
|
563
611
|
> **Data collection seems to be slow, what could be the issue?**
|
|
564
612
|
|
|
565
|
-
Generally, it should take less than 15 seconds to retrieve the historical data of 100 tickers. If it takes much longer, this could be due to reaching the API limit (the Starter plan has 250 requests per minute), due to a slow internet connection or due to unoptimized code.
|
|
613
|
+
Generally, it should take less than 15 seconds to retrieve the historical data of 100 tickers. If it takes much longer, this could be due to reaching the API limit (the Starter plan has 250 requests per minute), due to a slow internet connection or due to unoptimized code. The Finance Toolkit collects data with a bounded pool of worker threads (10 by default, configurable through the `FINANCETOOLKIT_MAX_WORKERS` environment variable) over a shared connection, so it is recommended to initialize the Toolkit with all tickers you want to analyze at once rather than one at a time. If it is taking 10+ minutes consider having a look at [this issue](https://github.com/JerBouma/FinanceToolkit/issues/99#issuecomment-1889726000) that managed to resolve the problem.
|
|
566
614
|
|
|
567
615
|
> **Are you part of FinancialModelingPrep?**
|
|
568
616
|
|