eulumdat-plot 0.0.1__tar.gz → 1.0.1__tar.gz
This diff represents the content of publicly available package versions that have been released to one of the supported registries. The information contained in this diff is provided for informational purposes only and reflects changes between package versions as they appear in their respective public registries.
- eulumdat_plot-1.0.1/PKG-INFO +243 -0
- eulumdat_plot-1.0.1/README.md +203 -0
- eulumdat_plot-1.0.1/pyproject.toml +73 -0
- eulumdat_plot-1.0.1/src/eulumdat_plot/__init__.py +50 -0
- eulumdat_plot-1.0.1/src/eulumdat_plot/export.py +145 -0
- eulumdat_plot-1.0.1/src/eulumdat_plot/plot.py +365 -0
- eulumdat_plot-1.0.1/src/eulumdat_plot/renderer.py +512 -0
- eulumdat_plot-1.0.1/src/eulumdat_plot.egg-info/PKG-INFO +243 -0
- {eulumdat_plot-0.0.1 → eulumdat_plot-1.0.1}/src/eulumdat_plot.egg-info/SOURCES.txt +6 -1
- eulumdat_plot-1.0.1/src/eulumdat_plot.egg-info/requires.txt +20 -0
- eulumdat_plot-1.0.1/tests/test_scaling.py +195 -0
- eulumdat_plot-1.0.1/tests/test_smoke.py +142 -0
- eulumdat_plot-0.0.1/PKG-INFO +0 -31
- eulumdat_plot-0.0.1/README.md +0 -11
- eulumdat_plot-0.0.1/pyproject.toml +0 -32
- eulumdat_plot-0.0.1/src/eulumdat_plot/__init__.py +0 -1
- eulumdat_plot-0.0.1/src/eulumdat_plot.egg-info/PKG-INFO +0 -31
- eulumdat_plot-0.0.1/src/eulumdat_plot.egg-info/requires.txt +0 -5
- {eulumdat_plot-0.0.1 → eulumdat_plot-1.0.1}/setup.cfg +0 -0
- {eulumdat_plot-0.0.1 → eulumdat_plot-1.0.1}/src/eulumdat_plot.egg-info/dependency_links.txt +0 -0
- {eulumdat_plot-0.0.1 → eulumdat_plot-1.0.1}/src/eulumdat_plot.egg-info/top_level.txt +0 -0
|
@@ -0,0 +1,243 @@
|
|
|
1
|
+
Metadata-Version: 2.4
|
|
2
|
+
Name: eulumdat-plot
|
|
3
|
+
Version: 1.0.1
|
|
4
|
+
Summary: Photometric polar diagram generator for EULUMDAT (.ldt) files — extension to eulumdat-py
|
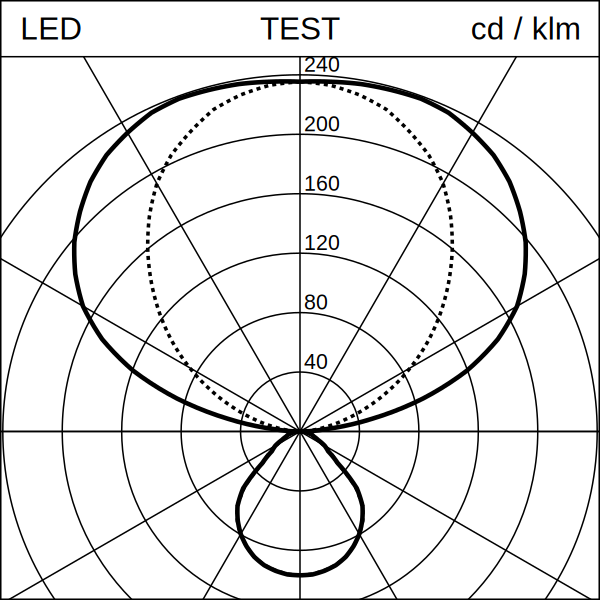
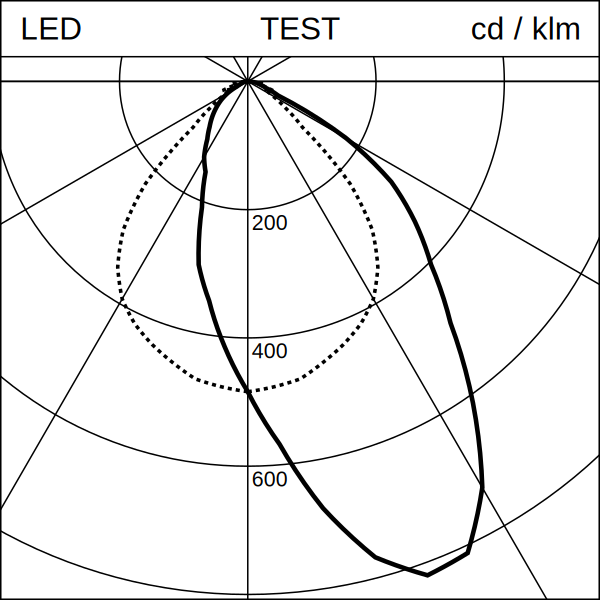
|
5
|
+
Author: 123VincentB
|
|
6
|
+
License: MIT
|
|
7
|
+
Project-URL: Homepage, https://github.com/123VincentB/eulumdat-plot
|
|
8
|
+
Project-URL: Repository, https://github.com/123VincentB/eulumdat-plot
|
|
9
|
+
Project-URL: Issues, https://github.com/123VincentB/eulumdat-plot/issues
|
|
10
|
+
Project-URL: Changelog, https://github.com/123VincentB/eulumdat-plot/blob/main/CHANGELOG.md
|
|
11
|
+
Keywords: eulumdat,ldt,photometry,lighting,luminaire,polar,candela,diagram,svg,lumtopic
|
|
12
|
+
Classifier: Development Status :: 5 - Production/Stable
|
|
13
|
+
Classifier: Intended Audience :: Science/Research
|
|
14
|
+
Classifier: Intended Audience :: Manufacturing
|
|
15
|
+
Classifier: Topic :: Scientific/Engineering :: Physics
|
|
16
|
+
Classifier: License :: OSI Approved :: MIT License
|
|
17
|
+
Classifier: Programming Language :: Python :: 3
|
|
18
|
+
Classifier: Programming Language :: Python :: 3.9
|
|
19
|
+
Classifier: Programming Language :: Python :: 3.10
|
|
20
|
+
Classifier: Programming Language :: Python :: 3.11
|
|
21
|
+
Classifier: Programming Language :: Python :: 3.12
|
|
22
|
+
Requires-Python: >=3.9
|
|
23
|
+
Description-Content-Type: text/markdown
|
|
24
|
+
Requires-Dist: eulumdat-py>=1.0.0
|
|
25
|
+
Requires-Dist: numpy>=1.21
|
|
26
|
+
Requires-Dist: svgwrite>=1.4
|
|
27
|
+
Provides-Extra: export
|
|
28
|
+
Requires-Dist: vl-convert-python>=1.6; extra == "export"
|
|
29
|
+
Requires-Dist: Pillow>=9.0; extra == "export"
|
|
30
|
+
Provides-Extra: cubic
|
|
31
|
+
Requires-Dist: scipy>=1.7; extra == "cubic"
|
|
32
|
+
Provides-Extra: full
|
|
33
|
+
Requires-Dist: eulumdat-plot[export]; extra == "full"
|
|
34
|
+
Requires-Dist: eulumdat-plot[cubic]; extra == "full"
|
|
35
|
+
Provides-Extra: dev
|
|
36
|
+
Requires-Dist: build; extra == "dev"
|
|
37
|
+
Requires-Dist: twine; extra == "dev"
|
|
38
|
+
Requires-Dist: pytest>=7.0; extra == "dev"
|
|
39
|
+
Requires-Dist: eulumdat-plot[full]; extra == "dev"
|
|
40
|
+
|
|
41
|
+
# eulumdat-plot
|
|
42
|
+
|
|
43
|
+
[](https://pypi.org/project/eulumdat-plot/)
|
|
44
|
+
[](https://pypi.org/project/eulumdat-plot/)
|
|
45
|
+
[](https://github.com/123VincentB/eulumdat-plot/blob/main/LICENSE)
|
|
46
|
+
[](https://doi.org/10.5281/zenodo.19096110)
|
|
47
|
+
|
|
48
|
+
Photometric polar diagram generator for EULUMDAT (`.ldt`) files —
|
|
49
|
+
designed for **product datasheets and publication-ready documents**.
|
|
50
|
+
|
|
51
|
+
Reads a `.ldt` file and produces a **Lumtopic-style SVG**: a square image
|
|
52
|
+
with a top banner and a polar candela distribution diagram showing the
|
|
53
|
+
C0/C180 (solid) and C90/C270 (dotted) curves, scaled to fill the plot area.
|
|
54
|
+
|
|
55
|
+
> **For scientific / interactive plots** (matplotlib, axis labels, legends),
|
|
56
|
+
> see the
|
|
57
|
+
> [eulumdat-py examples](https://github.com/123VincentB/eulumdat-py/blob/main/examples/02_polar_diagram.md).
|
|
58
|
+
|
|
59
|
+
Part of the [`eulumdat-*`](https://github.com/123VincentB) ecosystem, built
|
|
60
|
+
on top of [`eulumdat-py`](https://pypi.org/project/eulumdat-py/).
|
|
61
|
+
|
|
62
|
+
---
|
|
63
|
+
|
|
64
|
+
|
|
65
|
+
|
|
66
|
+
---
|
|
67
|
+
|
|
68
|
+
## Features
|
|
69
|
+
|
|
70
|
+
- Reads any EULUMDAT file — all symmetry types (ISYM 0–4) handled by `eulumdat-py`
|
|
71
|
+
- Generates a **publication-ready SVG** polar diagram (Lumtopic style)
|
|
72
|
+
- Dynamic radial scale (3–6 concentric circles, round values)
|
|
73
|
+
- Dominant-hemisphere detection for automatic scale label placement
|
|
74
|
+
- Proportional scaling via `Layout.for_size(n)` — one parameter controls everything
|
|
75
|
+
- Optional I(γ) interpolation (linear or cubic spline) for smooth curves
|
|
76
|
+
- Optional raster export to **PNG** and **JPEG** (cross-platform, no native DLL)
|
|
77
|
+
- Debug mode for visual validation of C-plane assignment
|
|
78
|
+
|
|
79
|
+
## Installation
|
|
80
|
+
|
|
81
|
+
Core package (SVG generation only):
|
|
82
|
+
|
|
83
|
+
```bash
|
|
84
|
+
pip install eulumdat-plot
|
|
85
|
+
```
|
|
86
|
+
|
|
87
|
+
With raster export (PNG / JPEG):
|
|
88
|
+
|
|
89
|
+
```bash
|
|
90
|
+
pip install "eulumdat-plot[export]"
|
|
91
|
+
```
|
|
92
|
+
|
|
93
|
+
With cubic spline interpolation:
|
|
94
|
+
|
|
95
|
+
```bash
|
|
96
|
+
pip install "eulumdat-plot[cubic]"
|
|
97
|
+
```
|
|
98
|
+
|
|
99
|
+
Everything:
|
|
100
|
+
|
|
101
|
+
```bash
|
|
102
|
+
pip install "eulumdat-plot[full]"
|
|
103
|
+
```
|
|
104
|
+
|
|
105
|
+
## Quick start
|
|
106
|
+
|
|
107
|
+
```python
|
|
108
|
+
from eulumdat_plot import plot_ldt
|
|
109
|
+
|
|
110
|
+
# Generate an SVG next to the source file
|
|
111
|
+
svg = plot_ldt("luminaire.ldt")
|
|
112
|
+
|
|
113
|
+
# With a distribution code in the banner centre
|
|
114
|
+
svg = plot_ldt("luminaire.ldt", code="D53")
|
|
115
|
+
```
|
|
116
|
+
|
|
117
|
+
## Scaling
|
|
118
|
+
|
|
119
|
+
All visual parameters (stroke widths, font sizes, margins) scale
|
|
120
|
+
proportionally from the 1181 px reference with a single call:
|
|
121
|
+
|
|
122
|
+
```python
|
|
123
|
+
from eulumdat_plot import plot_ldt, Layout
|
|
124
|
+
|
|
125
|
+
svg = plot_ldt("luminaire.ldt", layout=Layout.for_size(600))
|
|
126
|
+
```
|
|
127
|
+
|
|
128
|
+
## Raster export
|
|
129
|
+
|
|
130
|
+
```python
|
|
131
|
+
from eulumdat_plot import plot_ldt, Layout
|
|
132
|
+
from eulumdat_plot.export import svg_to_png, svg_to_jpg
|
|
133
|
+
|
|
134
|
+
svg = plot_ldt("luminaire.ldt", layout=Layout.for_size(1181))
|
|
135
|
+
png = svg_to_png(svg, size_px=600)
|
|
136
|
+
jpg = svg_to_jpg(svg, size_px=600, quality=95)
|
|
137
|
+
```
|
|
138
|
+
|
|
139
|
+
The export size is independent of the SVG canvas size.
|
|
140
|
+
|
|
141
|
+
## API reference
|
|
142
|
+
|
|
143
|
+
### `plot_ldt()`
|
|
144
|
+
|
|
145
|
+
```python
|
|
146
|
+
def plot_ldt(
|
|
147
|
+
ldt_path: str | Path,
|
|
148
|
+
svg_path: str | Path | None = None,
|
|
149
|
+
*,
|
|
150
|
+
code: str = "",
|
|
151
|
+
layout: Layout | None = None,
|
|
152
|
+
interpolate: bool = True,
|
|
153
|
+
interp_step_deg: float = 1.0,
|
|
154
|
+
interp_method: str = "linear",
|
|
155
|
+
debug: bool = False,
|
|
156
|
+
) -> Path
|
|
157
|
+
```
|
|
158
|
+
|
|
159
|
+
| Parameter | Default | Description |
|
|
160
|
+
| ----------------- | ----------------- | -------------------------------------------- |
|
|
161
|
+
| `ldt_path` | — | Source `.ldt` file |
|
|
162
|
+
| `svg_path` | same name, `.svg` | Output SVG path |
|
|
163
|
+
| `code` | `""` | Distribution code shown in the banner centre |
|
|
164
|
+
| `layout` | `Layout()` | Visual parameters |
|
|
165
|
+
| `interpolate` | `True` | Resample I(γ) before plotting |
|
|
166
|
+
| `interp_step_deg` | `1.0` | Angular step for resampling (degrees) |
|
|
167
|
+
| `interp_method` | `"linear"` | `"linear"` or `"cubic"` (requires scipy) |
|
|
168
|
+
| `debug` | `False` | Colour-code C-planes for visual validation |
|
|
169
|
+
|
|
170
|
+
### `Layout.for_size()`
|
|
171
|
+
|
|
172
|
+
```python
|
|
173
|
+
Layout.for_size(size_px: int) -> Layout
|
|
174
|
+
```
|
|
175
|
+
|
|
176
|
+
Creates a `Layout` with all dimensions scaled proportionally from the
|
|
177
|
+
1181 px reference. `Layout.for_size(1181)` is identical to `Layout()`.
|
|
178
|
+
|
|
179
|
+
### `svg_to_png()` / `svg_to_jpg()`
|
|
180
|
+
|
|
181
|
+
```python
|
|
182
|
+
svg_to_png(svg_path, png_path=None, *, size_px=1181, background="#FFFFFF") -> Path
|
|
183
|
+
svg_to_jpg(svg_path, jpg_path=None, *, size_px=1181, background="#FFFFFF", quality=95) -> Path
|
|
184
|
+
```
|
|
185
|
+
|
|
186
|
+
Requires `pip install "eulumdat-plot[export]"`.
|
|
187
|
+
|
|
188
|
+
## Examples
|
|
189
|
+
|
|
190
|
+
| File | Description |
|
|
191
|
+
| ---------------------------------------------------------------------- | ---------------------------------------- |
|
|
192
|
+
| [`examples/01_basic_usage.md`](examples/01_basic_usage.md) | Generate an SVG from a `.ldt` file |
|
|
193
|
+
| [`examples/02_resize_and_export.md`](examples/02_resize_and_export.md) | Scaling, raster export, batch processing |
|
|
194
|
+
|
|
195
|
+
## Project structure
|
|
196
|
+
|
|
197
|
+
```
|
|
198
|
+
eulumdat-plot/
|
|
199
|
+
├── data/
|
|
200
|
+
│ ├── input/ # sample .ldt files (ISYM 0–4)
|
|
201
|
+
│ └── output/ # generated SVG / PNG / JPEG
|
|
202
|
+
├── docs/
|
|
203
|
+
│ └── img/
|
|
204
|
+
│ └── sample_01.svg
|
|
205
|
+
├── examples/
|
|
206
|
+
│ ├── 01_basic_usage.md
|
|
207
|
+
│ └── 02_resize_and_export.md
|
|
208
|
+
├── src/
|
|
209
|
+
│ └── eulumdat_plot/
|
|
210
|
+
│ ├── __init__.py
|
|
211
|
+
│ ├── plot.py # public API — LDT → SVG pipeline
|
|
212
|
+
│ ├── renderer.py # SVG renderer + Layout dataclass
|
|
213
|
+
│ └── export.py # raster export (PNG / JPEG)
|
|
214
|
+
├── tests/
|
|
215
|
+
│ ├── test_smoke.py # 46 real LDT files, all ISYM types
|
|
216
|
+
│ └── test_scaling.py # Layout.for_size() proportionality
|
|
217
|
+
├── pyproject.toml
|
|
218
|
+
├── CHANGELOG.md
|
|
219
|
+
└── README.md
|
|
220
|
+
```
|
|
221
|
+
|
|
222
|
+
## EULUMDAT ecosystem
|
|
223
|
+
|
|
224
|
+
| Package | Status | Description |
|
|
225
|
+
| ------------------------------------------------------------------ | ------- | -------------------------------------------- |
|
|
226
|
+
| [`eulumdat-py`](https://pypi.org/project/eulumdat-py/) | v0.1.4 | Read / write EULUMDAT files |
|
|
227
|
+
| [`eulumdat-symmetry`](https://pypi.org/project/eulumdat-symmetry/) | v1.0.0 | Symmetrise EULUMDAT files |
|
|
228
|
+
| `eulumdat-plot` | v1.0.0 | Photometric polar diagram — **this package** |
|
|
229
|
+
| `eulumdat-luminance` | planned | Luminance table cd/m² (γ 55°–85°) |
|
|
230
|
+
| `eulumdat-ugr` | planned | UGR calculation (CIE 117, CIE 190) |
|
|
231
|
+
|
|
232
|
+
## Requirements
|
|
233
|
+
|
|
234
|
+
- Python ≥ 3.9
|
|
235
|
+
- `eulumdat-py` ≥ 1.0.0
|
|
236
|
+
- `numpy` ≥ 1.21
|
|
237
|
+
- `svgwrite` ≥ 1.4
|
|
238
|
+
- *(optional)* `vl-convert-python` ≥ 1.6 + `Pillow` ≥ 9.0 — raster export
|
|
239
|
+
- *(optional)* `scipy` ≥ 1.7 — cubic spline interpolation
|
|
240
|
+
|
|
241
|
+
## License
|
|
242
|
+
|
|
243
|
+
MIT — © 2024 [123VincentB](https://github.com/123VincentB)
|
|
@@ -0,0 +1,203 @@
|
|
|
1
|
+
# eulumdat-plot
|
|
2
|
+
|
|
3
|
+
[](https://pypi.org/project/eulumdat-plot/)
|
|
4
|
+
[](https://pypi.org/project/eulumdat-plot/)
|
|
5
|
+
[](https://github.com/123VincentB/eulumdat-plot/blob/main/LICENSE)
|
|
6
|
+
[](https://doi.org/10.5281/zenodo.19096110)
|
|
7
|
+
|
|
8
|
+
Photometric polar diagram generator for EULUMDAT (`.ldt`) files —
|
|
9
|
+
designed for **product datasheets and publication-ready documents**.
|
|
10
|
+
|
|
11
|
+
Reads a `.ldt` file and produces a **Lumtopic-style SVG**: a square image
|
|
12
|
+
with a top banner and a polar candela distribution diagram showing the
|
|
13
|
+
C0/C180 (solid) and C90/C270 (dotted) curves, scaled to fill the plot area.
|
|
14
|
+
|
|
15
|
+
> **For scientific / interactive plots** (matplotlib, axis labels, legends),
|
|
16
|
+
> see the
|
|
17
|
+
> [eulumdat-py examples](https://github.com/123VincentB/eulumdat-py/blob/main/examples/02_polar_diagram.md).
|
|
18
|
+
|
|
19
|
+
Part of the [`eulumdat-*`](https://github.com/123VincentB) ecosystem, built
|
|
20
|
+
on top of [`eulumdat-py`](https://pypi.org/project/eulumdat-py/).
|
|
21
|
+
|
|
22
|
+
---
|
|
23
|
+
|
|
24
|
+
 
|
|
25
|
+
|
|
26
|
+
---
|
|
27
|
+
|
|
28
|
+
## Features
|
|
29
|
+
|
|
30
|
+
- Reads any EULUMDAT file — all symmetry types (ISYM 0–4) handled by `eulumdat-py`
|
|
31
|
+
- Generates a **publication-ready SVG** polar diagram (Lumtopic style)
|
|
32
|
+
- Dynamic radial scale (3–6 concentric circles, round values)
|
|
33
|
+
- Dominant-hemisphere detection for automatic scale label placement
|
|
34
|
+
- Proportional scaling via `Layout.for_size(n)` — one parameter controls everything
|
|
35
|
+
- Optional I(γ) interpolation (linear or cubic spline) for smooth curves
|
|
36
|
+
- Optional raster export to **PNG** and **JPEG** (cross-platform, no native DLL)
|
|
37
|
+
- Debug mode for visual validation of C-plane assignment
|
|
38
|
+
|
|
39
|
+
## Installation
|
|
40
|
+
|
|
41
|
+
Core package (SVG generation only):
|
|
42
|
+
|
|
43
|
+
```bash
|
|
44
|
+
pip install eulumdat-plot
|
|
45
|
+
```
|
|
46
|
+
|
|
47
|
+
With raster export (PNG / JPEG):
|
|
48
|
+
|
|
49
|
+
```bash
|
|
50
|
+
pip install "eulumdat-plot[export]"
|
|
51
|
+
```
|
|
52
|
+
|
|
53
|
+
With cubic spline interpolation:
|
|
54
|
+
|
|
55
|
+
```bash
|
|
56
|
+
pip install "eulumdat-plot[cubic]"
|
|
57
|
+
```
|
|
58
|
+
|
|
59
|
+
Everything:
|
|
60
|
+
|
|
61
|
+
```bash
|
|
62
|
+
pip install "eulumdat-plot[full]"
|
|
63
|
+
```
|
|
64
|
+
|
|
65
|
+
## Quick start
|
|
66
|
+
|
|
67
|
+
```python
|
|
68
|
+
from eulumdat_plot import plot_ldt
|
|
69
|
+
|
|
70
|
+
# Generate an SVG next to the source file
|
|
71
|
+
svg = plot_ldt("luminaire.ldt")
|
|
72
|
+
|
|
73
|
+
# With a distribution code in the banner centre
|
|
74
|
+
svg = plot_ldt("luminaire.ldt", code="D53")
|
|
75
|
+
```
|
|
76
|
+
|
|
77
|
+
## Scaling
|
|
78
|
+
|
|
79
|
+
All visual parameters (stroke widths, font sizes, margins) scale
|
|
80
|
+
proportionally from the 1181 px reference with a single call:
|
|
81
|
+
|
|
82
|
+
```python
|
|
83
|
+
from eulumdat_plot import plot_ldt, Layout
|
|
84
|
+
|
|
85
|
+
svg = plot_ldt("luminaire.ldt", layout=Layout.for_size(600))
|
|
86
|
+
```
|
|
87
|
+
|
|
88
|
+
## Raster export
|
|
89
|
+
|
|
90
|
+
```python
|
|
91
|
+
from eulumdat_plot import plot_ldt, Layout
|
|
92
|
+
from eulumdat_plot.export import svg_to_png, svg_to_jpg
|
|
93
|
+
|
|
94
|
+
svg = plot_ldt("luminaire.ldt", layout=Layout.for_size(1181))
|
|
95
|
+
png = svg_to_png(svg, size_px=600)
|
|
96
|
+
jpg = svg_to_jpg(svg, size_px=600, quality=95)
|
|
97
|
+
```
|
|
98
|
+
|
|
99
|
+
The export size is independent of the SVG canvas size.
|
|
100
|
+
|
|
101
|
+
## API reference
|
|
102
|
+
|
|
103
|
+
### `plot_ldt()`
|
|
104
|
+
|
|
105
|
+
```python
|
|
106
|
+
def plot_ldt(
|
|
107
|
+
ldt_path: str | Path,
|
|
108
|
+
svg_path: str | Path | None = None,
|
|
109
|
+
*,
|
|
110
|
+
code: str = "",
|
|
111
|
+
layout: Layout | None = None,
|
|
112
|
+
interpolate: bool = True,
|
|
113
|
+
interp_step_deg: float = 1.0,
|
|
114
|
+
interp_method: str = "linear",
|
|
115
|
+
debug: bool = False,
|
|
116
|
+
) -> Path
|
|
117
|
+
```
|
|
118
|
+
|
|
119
|
+
| Parameter | Default | Description |
|
|
120
|
+
| ----------------- | ----------------- | -------------------------------------------- |
|
|
121
|
+
| `ldt_path` | — | Source `.ldt` file |
|
|
122
|
+
| `svg_path` | same name, `.svg` | Output SVG path |
|
|
123
|
+
| `code` | `""` | Distribution code shown in the banner centre |
|
|
124
|
+
| `layout` | `Layout()` | Visual parameters |
|
|
125
|
+
| `interpolate` | `True` | Resample I(γ) before plotting |
|
|
126
|
+
| `interp_step_deg` | `1.0` | Angular step for resampling (degrees) |
|
|
127
|
+
| `interp_method` | `"linear"` | `"linear"` or `"cubic"` (requires scipy) |
|
|
128
|
+
| `debug` | `False` | Colour-code C-planes for visual validation |
|
|
129
|
+
|
|
130
|
+
### `Layout.for_size()`
|
|
131
|
+
|
|
132
|
+
```python
|
|
133
|
+
Layout.for_size(size_px: int) -> Layout
|
|
134
|
+
```
|
|
135
|
+
|
|
136
|
+
Creates a `Layout` with all dimensions scaled proportionally from the
|
|
137
|
+
1181 px reference. `Layout.for_size(1181)` is identical to `Layout()`.
|
|
138
|
+
|
|
139
|
+
### `svg_to_png()` / `svg_to_jpg()`
|
|
140
|
+
|
|
141
|
+
```python
|
|
142
|
+
svg_to_png(svg_path, png_path=None, *, size_px=1181, background="#FFFFFF") -> Path
|
|
143
|
+
svg_to_jpg(svg_path, jpg_path=None, *, size_px=1181, background="#FFFFFF", quality=95) -> Path
|
|
144
|
+
```
|
|
145
|
+
|
|
146
|
+
Requires `pip install "eulumdat-plot[export]"`.
|
|
147
|
+
|
|
148
|
+
## Examples
|
|
149
|
+
|
|
150
|
+
| File | Description |
|
|
151
|
+
| ---------------------------------------------------------------------- | ---------------------------------------- |
|
|
152
|
+
| [`examples/01_basic_usage.md`](examples/01_basic_usage.md) | Generate an SVG from a `.ldt` file |
|
|
153
|
+
| [`examples/02_resize_and_export.md`](examples/02_resize_and_export.md) | Scaling, raster export, batch processing |
|
|
154
|
+
|
|
155
|
+
## Project structure
|
|
156
|
+
|
|
157
|
+
```
|
|
158
|
+
eulumdat-plot/
|
|
159
|
+
├── data/
|
|
160
|
+
│ ├── input/ # sample .ldt files (ISYM 0–4)
|
|
161
|
+
│ └── output/ # generated SVG / PNG / JPEG
|
|
162
|
+
├── docs/
|
|
163
|
+
│ └── img/
|
|
164
|
+
│ └── sample_01.svg
|
|
165
|
+
├── examples/
|
|
166
|
+
│ ├── 01_basic_usage.md
|
|
167
|
+
│ └── 02_resize_and_export.md
|
|
168
|
+
├── src/
|
|
169
|
+
│ └── eulumdat_plot/
|
|
170
|
+
│ ├── __init__.py
|
|
171
|
+
│ ├── plot.py # public API — LDT → SVG pipeline
|
|
172
|
+
│ ├── renderer.py # SVG renderer + Layout dataclass
|
|
173
|
+
│ └── export.py # raster export (PNG / JPEG)
|
|
174
|
+
├── tests/
|
|
175
|
+
│ ├── test_smoke.py # 46 real LDT files, all ISYM types
|
|
176
|
+
│ └── test_scaling.py # Layout.for_size() proportionality
|
|
177
|
+
├── pyproject.toml
|
|
178
|
+
├── CHANGELOG.md
|
|
179
|
+
└── README.md
|
|
180
|
+
```
|
|
181
|
+
|
|
182
|
+
## EULUMDAT ecosystem
|
|
183
|
+
|
|
184
|
+
| Package | Status | Description |
|
|
185
|
+
| ------------------------------------------------------------------ | ------- | -------------------------------------------- |
|
|
186
|
+
| [`eulumdat-py`](https://pypi.org/project/eulumdat-py/) | v0.1.4 | Read / write EULUMDAT files |
|
|
187
|
+
| [`eulumdat-symmetry`](https://pypi.org/project/eulumdat-symmetry/) | v1.0.0 | Symmetrise EULUMDAT files |
|
|
188
|
+
| `eulumdat-plot` | v1.0.0 | Photometric polar diagram — **this package** |
|
|
189
|
+
| `eulumdat-luminance` | planned | Luminance table cd/m² (γ 55°–85°) |
|
|
190
|
+
| `eulumdat-ugr` | planned | UGR calculation (CIE 117, CIE 190) |
|
|
191
|
+
|
|
192
|
+
## Requirements
|
|
193
|
+
|
|
194
|
+
- Python ≥ 3.9
|
|
195
|
+
- `eulumdat-py` ≥ 1.0.0
|
|
196
|
+
- `numpy` ≥ 1.21
|
|
197
|
+
- `svgwrite` ≥ 1.4
|
|
198
|
+
- *(optional)* `vl-convert-python` ≥ 1.6 + `Pillow` ≥ 9.0 — raster export
|
|
199
|
+
- *(optional)* `scipy` ≥ 1.7 — cubic spline interpolation
|
|
200
|
+
|
|
201
|
+
## License
|
|
202
|
+
|
|
203
|
+
MIT — © 2024 [123VincentB](https://github.com/123VincentB)
|
|
@@ -0,0 +1,73 @@
|
|
|
1
|
+
[build-system]
|
|
2
|
+
requires = ["setuptools>=61.0"]
|
|
3
|
+
build-backend = "setuptools.build_meta"
|
|
4
|
+
|
|
5
|
+
[project]
|
|
6
|
+
name = "eulumdat-plot"
|
|
7
|
+
version = "1.0.1"
|
|
8
|
+
description = "Photometric polar diagram generator for EULUMDAT (.ldt) files — extension to eulumdat-py"
|
|
9
|
+
readme = "README.md"
|
|
10
|
+
license = { text = "MIT" }
|
|
11
|
+
authors = [{ name = "123VincentB" }]
|
|
12
|
+
requires-python = ">=3.9"
|
|
13
|
+
|
|
14
|
+
dependencies = [
|
|
15
|
+
"eulumdat-py >= 1.0.0",
|
|
16
|
+
"numpy >= 1.21",
|
|
17
|
+
"svgwrite >= 1.4",
|
|
18
|
+
]
|
|
19
|
+
|
|
20
|
+
keywords = [
|
|
21
|
+
"eulumdat", "ldt", "photometry", "lighting", "luminaire",
|
|
22
|
+
"polar", "candela", "diagram", "svg", "lumtopic",
|
|
23
|
+
]
|
|
24
|
+
|
|
25
|
+
classifiers = [
|
|
26
|
+
"Development Status :: 5 - Production/Stable",
|
|
27
|
+
"Intended Audience :: Science/Research",
|
|
28
|
+
"Intended Audience :: Manufacturing",
|
|
29
|
+
"Topic :: Scientific/Engineering :: Physics",
|
|
30
|
+
"License :: OSI Approved :: MIT License",
|
|
31
|
+
"Programming Language :: Python :: 3",
|
|
32
|
+
"Programming Language :: Python :: 3.9",
|
|
33
|
+
"Programming Language :: Python :: 3.10",
|
|
34
|
+
"Programming Language :: Python :: 3.11",
|
|
35
|
+
"Programming Language :: Python :: 3.12",
|
|
36
|
+
]
|
|
37
|
+
|
|
38
|
+
[project.optional-dependencies]
|
|
39
|
+
# Raster export (SVG → PNG / JPEG)
|
|
40
|
+
export = [
|
|
41
|
+
"vl-convert-python >= 1.6",
|
|
42
|
+
"Pillow >= 9.0",
|
|
43
|
+
]
|
|
44
|
+
# Smooth curve interpolation
|
|
45
|
+
cubic = [
|
|
46
|
+
"scipy >= 1.7",
|
|
47
|
+
]
|
|
48
|
+
# Everything
|
|
49
|
+
full = [
|
|
50
|
+
"eulumdat-plot[export]",
|
|
51
|
+
"eulumdat-plot[cubic]",
|
|
52
|
+
]
|
|
53
|
+
# Development tools
|
|
54
|
+
dev = [
|
|
55
|
+
"build",
|
|
56
|
+
"twine",
|
|
57
|
+
"pytest >= 7.0",
|
|
58
|
+
"eulumdat-plot[full]",
|
|
59
|
+
]
|
|
60
|
+
|
|
61
|
+
[project.urls]
|
|
62
|
+
Homepage = "https://github.com/123VincentB/eulumdat-plot"
|
|
63
|
+
Repository = "https://github.com/123VincentB/eulumdat-plot"
|
|
64
|
+
Issues = "https://github.com/123VincentB/eulumdat-plot/issues"
|
|
65
|
+
Changelog = "https://github.com/123VincentB/eulumdat-plot/blob/main/CHANGELOG.md"
|
|
66
|
+
|
|
67
|
+
[tool.setuptools.packages.find]
|
|
68
|
+
where = ["src"]
|
|
69
|
+
|
|
70
|
+
[tool.pytest.ini_options]
|
|
71
|
+
# Add src/ to sys.path so pytest finds eulumdat_plot without editable install.
|
|
72
|
+
pythonpath = ["src"]
|
|
73
|
+
testpaths = ["tests"]
|
|
@@ -0,0 +1,50 @@
|
|
|
1
|
+
"""
|
|
2
|
+
eulumdat-plot — Photometric polar diagram generator for EULUMDAT (.ldt) files.
|
|
3
|
+
|
|
4
|
+
This package is an extension of ``eulumdat-py`` (``pyldt``).
|
|
5
|
+
It reads a ``.ldt`` file and generates a photometric polar diagram in the
|
|
6
|
+
style of the Lumtopic software: a square SVG image with a top banner
|
|
7
|
+
("LED" / distribution code / "cd / klm") and a polar plot showing the
|
|
8
|
+
C0/C180 distribution (solid curve) and C90/C270 distribution (dotted curve).
|
|
9
|
+
|
|
10
|
+
Quick start
|
|
11
|
+
-----------
|
|
12
|
+
::
|
|
13
|
+
|
|
14
|
+
from eulumdat_plot import plot_ldt
|
|
15
|
+
|
|
16
|
+
# Minimal — outputs "luminaire.svg" next to the source file.
|
|
17
|
+
svg = plot_ldt("luminaire.ldt")
|
|
18
|
+
|
|
19
|
+
# With distribution code and custom canvas size.
|
|
20
|
+
from eulumdat_plot import Layout
|
|
21
|
+
layout = Layout(width=800, height=800)
|
|
22
|
+
svg = plot_ldt("luminaire.ldt", code="D53", layout=layout)
|
|
23
|
+
|
|
24
|
+
# Raster export (requires the ``[export]`` optional dependency).
|
|
25
|
+
from eulumdat_plot.export import svg_to_png, svg_to_jpg
|
|
26
|
+
png = svg_to_png(svg)
|
|
27
|
+
jpg = svg_to_jpg(svg)
|
|
28
|
+
|
|
29
|
+
Public API
|
|
30
|
+
----------
|
|
31
|
+
:func:`plot_ldt`
|
|
32
|
+
Main entry point: LDT file → SVG diagram.
|
|
33
|
+
:class:`Layout`
|
|
34
|
+
Dataclass holding all visual parameters (sizes, stroke widths, fonts…).
|
|
35
|
+
:func:`make_svg`
|
|
36
|
+
Low-level renderer: pre-computed NAT curves → SVG.
|
|
37
|
+
Useful if you need to build curves yourself and bypass the LDT pipeline.
|
|
38
|
+
:func:`polar_to_nat`
|
|
39
|
+
Convert polar ``(r, θ)`` to NAT ``(x, y)`` Cartesian coordinates.
|
|
40
|
+
"""
|
|
41
|
+
|
|
42
|
+
from .plot import plot_ldt
|
|
43
|
+
from .renderer import Layout, make_svg, polar_to_nat
|
|
44
|
+
|
|
45
|
+
__all__ = [
|
|
46
|
+
"plot_ldt",
|
|
47
|
+
"Layout",
|
|
48
|
+
"make_svg",
|
|
49
|
+
"polar_to_nat",
|
|
50
|
+
]
|