errorbars 0.1.2__tar.gz
This diff represents the content of publicly available package versions that have been released to one of the supported registries. The information contained in this diff is provided for informational purposes only and reflects changes between package versions as they appear in their respective public registries.
- errorbars-0.1.2/.gitignore +22 -0
- errorbars-0.1.2/CHANGELOG.md +74 -0
- errorbars-0.1.2/LICENSE +21 -0
- errorbars-0.1.2/PKG-INFO +297 -0
- errorbars-0.1.2/README.md +259 -0
- errorbars-0.1.2/docs/formulas.md +205 -0
- errorbars-0.1.2/pyproject.toml +127 -0
- errorbars-0.1.2/src/errorbars/__init__.py +28 -0
- errorbars-0.1.2/src/errorbars/adapters/__init__.py +1 -0
- errorbars-0.1.2/src/errorbars/adapters/inspect_ai.py +83 -0
- errorbars-0.1.2/src/errorbars/adapters/lm_eval.py +103 -0
- errorbars-0.1.2/src/errorbars/cli.py +426 -0
- errorbars-0.1.2/src/errorbars/compare.py +178 -0
- errorbars-0.1.2/src/errorbars/io.py +197 -0
- errorbars-0.1.2/src/errorbars/leaderboard.py +181 -0
- errorbars-0.1.2/src/errorbars/plot.py +141 -0
- errorbars-0.1.2/src/errorbars/power.py +137 -0
- errorbars-0.1.2/src/errorbars/py.typed +0 -0
- errorbars-0.1.2/src/errorbars/stats.py +329 -0
|
@@ -0,0 +1,22 @@
|
|
|
1
|
+
__pycache__/
|
|
2
|
+
*.py[cod]
|
|
3
|
+
*.egg-info/
|
|
4
|
+
.pytest_cache/
|
|
5
|
+
.mypy_cache/
|
|
6
|
+
.ruff_cache/
|
|
7
|
+
.coverage
|
|
8
|
+
htmlcov/
|
|
9
|
+
.venv/
|
|
10
|
+
venv/
|
|
11
|
+
dist/
|
|
12
|
+
build/
|
|
13
|
+
*.egg
|
|
14
|
+
|
|
15
|
+
node_modules/
|
|
16
|
+
web/dist/
|
|
17
|
+
web/.vite/
|
|
18
|
+
npm-debug.log*
|
|
19
|
+
|
|
20
|
+
.DS_Store
|
|
21
|
+
*.swp
|
|
22
|
+
web/*.tsbuildinfo
|
|
@@ -0,0 +1,74 @@
|
|
|
1
|
+
# Changelog
|
|
2
|
+
|
|
3
|
+
All notable changes to this project are documented in this file.
|
|
4
|
+
|
|
5
|
+
## [0.1.2] - 2026-10-01
|
|
6
|
+
|
|
7
|
+
### Added
|
|
8
|
+
|
|
9
|
+
- Published to PyPI: `pip install "errorbars[cli]"`. The README's images and
|
|
10
|
+
links are rewritten to absolute URLs at build time so they work on the
|
|
11
|
+
project page.
|
|
12
|
+
- `errorbars --version`.
|
|
13
|
+
- `py.typed`, so type checkers use the package's annotations (the `Typing ::
|
|
14
|
+
Typed` classifier was already declared).
|
|
15
|
+
|
|
16
|
+
## [0.1.1] - 2026-09-30
|
|
17
|
+
|
|
18
|
+
### Fixed
|
|
19
|
+
|
|
20
|
+
- The paired test's p-value and CI used the normal distribution, and the
|
|
21
|
+
README called that "somewhat conservative" for small n; it is the opposite
|
|
22
|
+
(at 8 degrees of freedom, a statistic of 2.2 gave p = 0.028 instead of
|
|
23
|
+
0.059). Paired comparisons now use Student's t with n - 1 degrees of freedom
|
|
24
|
+
and match `scipy.stats.ttest_rel` to 1e-7, and clustered SEs (the clustered
|
|
25
|
+
CI in `summarize`, the clustered paired CI and p-value, and so the
|
|
26
|
+
leaderboard's Holm-corrected tests) use t with G - 1 degrees of freedom for
|
|
27
|
+
G clusters. No scipy at runtime: the t tail comes from a continued-fraction
|
|
28
|
+
incomplete beta function. On the bundled example the headline pair's paired
|
|
29
|
+
p moves from 0.1116 to 0.1131, its clustered p from 0.1154 to 0.1235, and
|
|
30
|
+
its Holm-adjusted p from 0.298 to 0.322; groups are unchanged.
|
|
31
|
+
With a single cluster, where the clustered SE falls back to the plain one,
|
|
32
|
+
the clustered test keeps the n - 1 reference too.
|
|
33
|
+
|
|
34
|
+
- A non-finite score (`nan`, `inf`) was accepted and propagated into every
|
|
35
|
+
mean, CI and p-value; on a leaderboard the NaN model sorted to rank 1.
|
|
36
|
+
Loading now fails with the row number.
|
|
37
|
+
- A repeated (model, question, sample) row was counted as another question,
|
|
38
|
+
inflating n and shrinking standard errors. Loading now fails with both row
|
|
39
|
+
numbers and says to give repeated generations distinct `sample` values.
|
|
40
|
+
- `power` answered "2 questions" for a baseline of 0 or 1 (where p(1-p) = 0)
|
|
41
|
+
and accepted targets above 100% (`--baseline 0.98 --delta 0.05`). The
|
|
42
|
+
baseline must be strictly between 0 and 1, baseline + delta can't exceed
|
|
43
|
+
1, and a continuous-metric variance must be positive; the web calculator's
|
|
44
|
+
effect-size slider is capped at 1 - baseline to match.
|
|
45
|
+
- `compare`/`summarize` with an unknown model name said "fewer than 2 shared
|
|
46
|
+
question_ids" or "no rows"; they now name the missing model and list the
|
|
47
|
+
models in the file.
|
|
48
|
+
- Install hints for the optional extras named `errorbars` on PyPI, where it
|
|
49
|
+
isn't published; they now name the dependency or the Git URL.
|
|
50
|
+
|
|
51
|
+
## [0.1.0] - 2026-09-24
|
|
52
|
+
|
|
53
|
+
Initial release.
|
|
54
|
+
|
|
55
|
+
- `summarize`: CLT, Wilson, and bootstrap confidence intervals; clustered
|
|
56
|
+
standard errors with design effect and ICC; within/between-question
|
|
57
|
+
variance decomposition for repeated samples.
|
|
58
|
+
- `compare`: paired mean difference, SE, CI, p-value; correlation and
|
|
59
|
+
variance reduction from pairing; clustered paired SE; exact McNemar test
|
|
60
|
+
for binary scores.
|
|
61
|
+
- `leaderboard`: per-model CIs, Holm-corrected pairwise paired tests,
|
|
62
|
+
maximal-clique grouping of statistically indistinguishable models, SVG and
|
|
63
|
+
(optional) matplotlib forest plots.
|
|
64
|
+
- `power`: questions needed for a target effect/power, and minimum
|
|
65
|
+
detectable effect for a given n, accounting for pairing correlation,
|
|
66
|
+
repeated sampling, and cluster design effect.
|
|
67
|
+
- CLI (`errorbars summarize|compare|leaderboard|power|import`) with `rich`
|
|
68
|
+
tables and `--json` output.
|
|
69
|
+
- Adapters: `errorbars import lm-eval|inspect` converts
|
|
70
|
+
lm-evaluation-harness `--log_samples` JSONL or an Inspect AI `.eval` log
|
|
71
|
+
into the canonical format, verified against real output from lm-eval
|
|
72
|
+
0.4.13 and inspect-ai 0.3.268.
|
|
73
|
+
- Web calculator (Vite + TypeScript) mirroring the Python power formulas,
|
|
74
|
+
with shared JSON test vectors.
|
errorbars-0.1.2/LICENSE
ADDED
|
@@ -0,0 +1,21 @@
|
|
|
1
|
+
MIT License
|
|
2
|
+
|
|
3
|
+
Copyright (c) 2026 Anton Soloviev
|
|
4
|
+
|
|
5
|
+
Permission is hereby granted, free of charge, to any person obtaining a copy
|
|
6
|
+
of this software and associated documentation files (the "Software"), to deal
|
|
7
|
+
in the Software without restriction, including without limitation the rights
|
|
8
|
+
to use, copy, modify, merge, publish, distribute, sublicense, and/or sell
|
|
9
|
+
copies of the Software, and to permit persons to whom the Software is
|
|
10
|
+
furnished to do so, subject to the following conditions:
|
|
11
|
+
|
|
12
|
+
The above copyright notice and this permission notice shall be included in all
|
|
13
|
+
copies or substantial portions of the Software.
|
|
14
|
+
|
|
15
|
+
THE SOFTWARE IS PROVIDED "AS IS", WITHOUT WARRANTY OF ANY KIND, EXPRESS OR
|
|
16
|
+
IMPLIED, INCLUDING BUT NOT LIMITED TO THE WARRANTIES OF MERCHANTABILITY,
|
|
17
|
+
FITNESS FOR A PARTICULAR PURPOSE AND NONINFRINGEMENT. IN NO EVENT SHALL THE
|
|
18
|
+
AUTHORS OR COPYRIGHT HOLDERS BE LIABLE FOR ANY CLAIM, DAMAGES OR OTHER
|
|
19
|
+
LIABILITY, WHETHER IN AN ACTION OF CONTRACT, TORT OR OTHERWISE, ARISING FROM,
|
|
20
|
+
OUT OF OR IN CONNECTION WITH THE SOFTWARE OR THE USE OR OTHER DEALINGS IN THE
|
|
21
|
+
SOFTWARE.
|
errorbars-0.1.2/PKG-INFO
ADDED
|
@@ -0,0 +1,297 @@
|
|
|
1
|
+
Metadata-Version: 2.5
|
|
2
|
+
Name: errorbars
|
|
3
|
+
Version: 0.1.2
|
|
4
|
+
Summary: Error bars for LLM evals: standard errors, clustering, paired comparisons, leaderboards, and power analysis.
|
|
5
|
+
Project-URL: Homepage, https://antonsoo.github.io/errorbars/
|
|
6
|
+
Project-URL: Repository, https://github.com/antonsoo/errorbars
|
|
7
|
+
Project-URL: Issues, https://github.com/antonsoo/errorbars/issues
|
|
8
|
+
Author-email: Anton Soloviev <anton@praviel.com>
|
|
9
|
+
License-Expression: MIT
|
|
10
|
+
License-File: LICENSE
|
|
11
|
+
Keywords: benchmarking,confidence-intervals,evaluation,language-models,llm-evals,statistics
|
|
12
|
+
Classifier: Development Status :: 4 - Beta
|
|
13
|
+
Classifier: Intended Audience :: Science/Research
|
|
14
|
+
Classifier: License :: OSI Approved :: MIT License
|
|
15
|
+
Classifier: Programming Language :: Python :: 3
|
|
16
|
+
Classifier: Programming Language :: Python :: 3.10
|
|
17
|
+
Classifier: Programming Language :: Python :: 3.11
|
|
18
|
+
Classifier: Programming Language :: Python :: 3.12
|
|
19
|
+
Classifier: Topic :: Scientific/Engineering :: Artificial Intelligence
|
|
20
|
+
Classifier: Typing :: Typed
|
|
21
|
+
Requires-Python: >=3.10
|
|
22
|
+
Requires-Dist: numpy>=1.24
|
|
23
|
+
Provides-Extra: all
|
|
24
|
+
Requires-Dist: matplotlib>=3.7; extra == 'all'
|
|
25
|
+
Requires-Dist: pandas>=1.5; extra == 'all'
|
|
26
|
+
Requires-Dist: rich>=13.0; extra == 'all'
|
|
27
|
+
Provides-Extra: cli
|
|
28
|
+
Requires-Dist: rich>=13.0; extra == 'cli'
|
|
29
|
+
Provides-Extra: inspect
|
|
30
|
+
Requires-Dist: agent-client-protocol<1.0,>=0.12; extra == 'inspect'
|
|
31
|
+
Requires-Dist: httpx<1.0,>=0.27; extra == 'inspect'
|
|
32
|
+
Requires-Dist: inspect-ai>=0.3.268; extra == 'inspect'
|
|
33
|
+
Provides-Extra: pandas
|
|
34
|
+
Requires-Dist: pandas>=1.5; extra == 'pandas'
|
|
35
|
+
Provides-Extra: plot
|
|
36
|
+
Requires-Dist: matplotlib>=3.7; extra == 'plot'
|
|
37
|
+
Description-Content-Type: text/markdown
|
|
38
|
+
|
|
39
|
+
# errorbars
|
|
40
|
+
|
|
41
|
+
**Error bars for LLM evals. Know whether model B is actually better, or you're reading noise.**
|
|
42
|
+
|
|
43
|
+
[](https://github.com/antonsoo/errorbars/blob/main/LICENSE)
|
|
44
|
+
[](https://antonsoo.github.io/errorbars/)
|
|
45
|
+
[](https://huggingface.co/spaces/antonsoloviev/errorbars)
|
|
46
|
+
|
|
47
|
+
LLM eval results get reported as bare accuracies — "model B scored 71.2%, up from 69.7%" — with
|
|
48
|
+
no error bar, no significance test, and no accounting for the fact that the questions came in
|
|
49
|
+
correlated groups. On a 500-question benchmark, a 1.5-point gain is very often noise: at a 50%
|
|
50
|
+
baseline you'd need roughly a 9-point gap to reliably detect anything at 80% power, α=0.05
|
|
51
|
+
(`errorbars power --n 500 --baseline 0.5` → minimum detectable effect ≈ 8.9 points). Evan Miller's
|
|
52
|
+
"[Adding Error Bars to Evals: A Statistical Approach to Language Model
|
|
53
|
+
Evaluations](https://arxiv.org/abs/2411.00640)" (arXiv:2411.00640, 2024) lays out the right
|
|
54
|
+
practice — CLT and clustered standard errors, variance reduction through pairing, power analysis —
|
|
55
|
+
and this package turns it into a one-liner.
|
|
56
|
+
|
|
57
|
+
|
|
58
|
+
|
|
59
|
+
## Why this exists
|
|
60
|
+
|
|
61
|
+
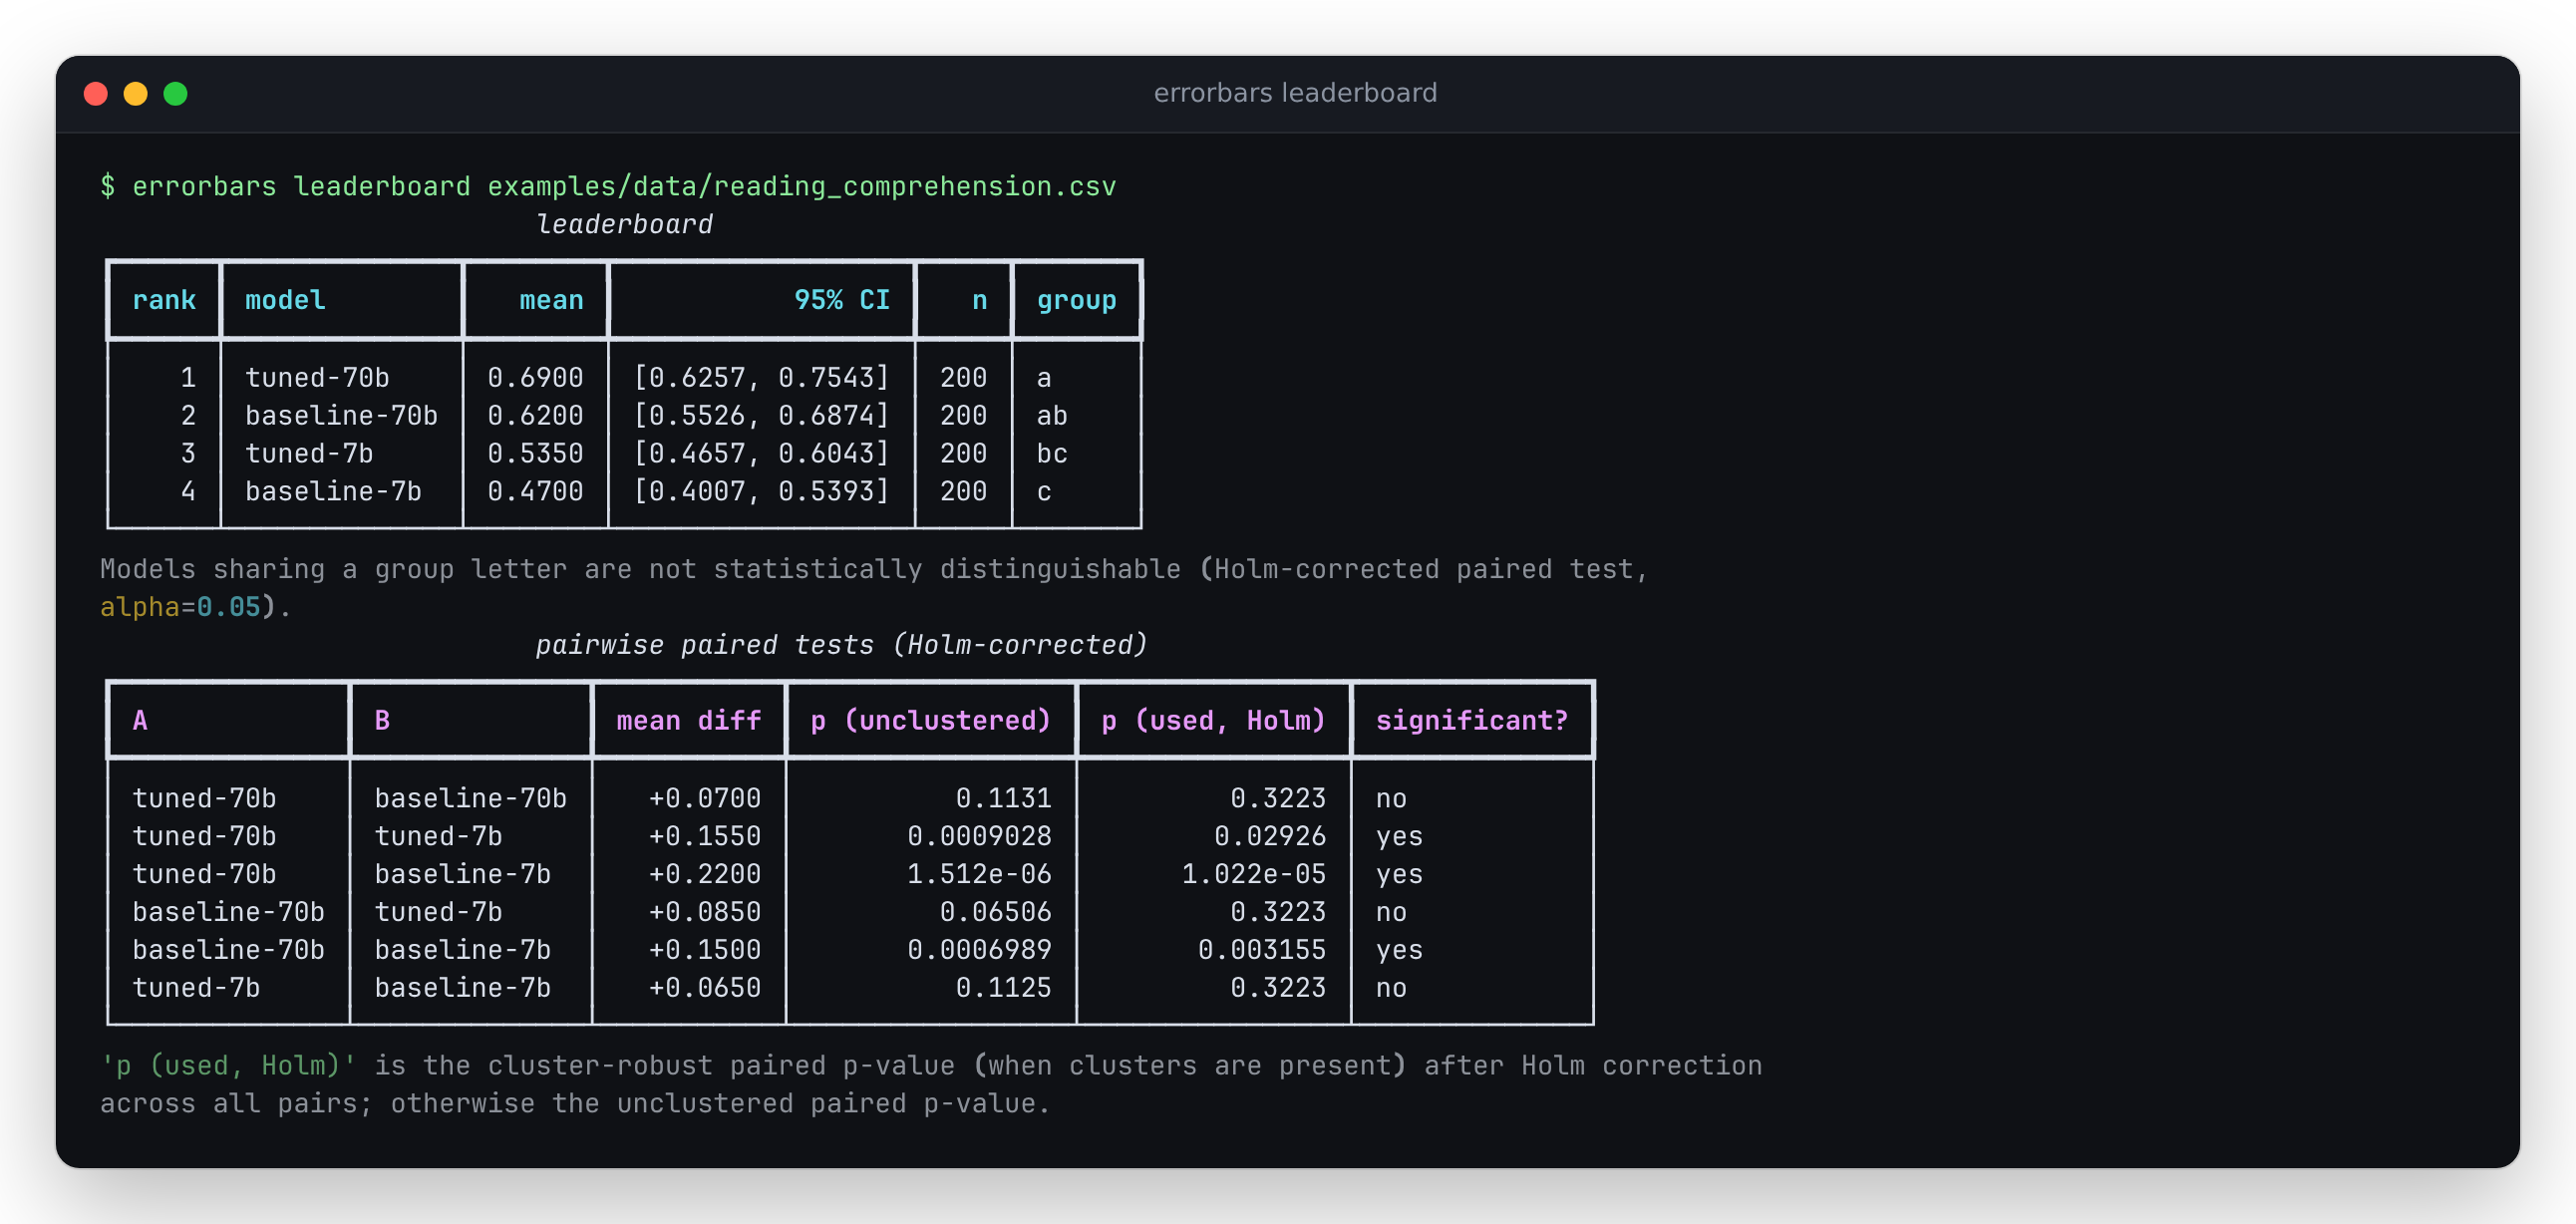
Run `errorbars leaderboard` on a synthetic benchmark (below) and one apparent 7-point win —
|
|
62
|
+
`tuned-70b` over `baseline-70b`, 0.690 vs. 0.620 — is not statistically significant once it has a
|
|
63
|
+
proper error bar: the paired test already gives p = 0.11. Accounting for the fact that questions
|
|
64
|
+
come 5-to-a-passage, and Holm-correcting across all 6 pairwise comparisons on the board, pushes
|
|
65
|
+
that to p = 0.32. A naive leaderboard that ranks by bare accuracy would still have shipped the gap
|
|
66
|
+
as a win. The full walkthrough, with every number copied from a real command, is in
|
|
67
|
+
[`examples/README.md`](https://github.com/antonsoo/errorbars/blob/main/examples/README.md).
|
|
68
|
+
|
|
69
|
+
## Quickstart
|
|
70
|
+
|
|
71
|
+
```bash
|
|
72
|
+
pip install "errorbars[cli]"
|
|
73
|
+
errorbars power --delta 0.03 --baseline 0.5
|
|
74
|
+
```
|
|
75
|
+
|
|
76
|
+
```
|
|
77
|
+
Questions needed: 4361
|
|
78
|
+
```
|
|
79
|
+
|
|
80
|
+
That's how many questions you'd need to reliably detect a 3-point accuracy gap at a 50% baseline,
|
|
81
|
+
with the defaults (80% power, α=0.05, no pairing correlation, no clustering). Clone the repo to
|
|
82
|
+
try it against real per-item scores:
|
|
83
|
+
|
|
84
|
+
```bash
|
|
85
|
+
git clone https://github.com/antonsoo/errorbars && cd errorbars
|
|
86
|
+
errorbars leaderboard examples/data/reading_comprehension.csv
|
|
87
|
+
```
|
|
88
|
+
|
|
89
|
+
## Features
|
|
90
|
+
|
|
91
|
+
- **`summarize`** — mean, SE, and 95% CI (CLT by default, Wilson for small-n binary scores,
|
|
92
|
+
bootstrap on request); clustered SE with design effect and ICC when a `cluster_id` column is
|
|
93
|
+
present; within/between-question variance decomposition when a `sample` column is present.
|
|
94
|
+
- **`compare`** — paired mean difference, SE, CI, p-value; the correlation between the two models'
|
|
95
|
+
per-question scores and how much pairing shrank the SE vs. an unpaired comparison; a
|
|
96
|
+
cluster-robust paired SE/p-value when clusters are present; exact McNemar test for binary scores.
|
|
97
|
+
- **`leaderboard`** — every model with its CI, Holm-corrected pairwise paired tests, and groups of
|
|
98
|
+
statistically indistinguishable models (maximal cliques of the "not significantly different"
|
|
99
|
+
graph); a forest plot (SVG, no dependency; matplotlib if installed).
|
|
100
|
+
- **`power`** — number of questions needed to detect an effect δ at a given α and power, or the
|
|
101
|
+
minimum detectable effect for a given n, accounting for pairing correlation, repeated sampling,
|
|
102
|
+
and cluster design effect.
|
|
103
|
+
- **CLI** — `errorbars summarize|compare|leaderboard|power|import`, `rich` tables by default,
|
|
104
|
+
`--json` for scripting.
|
|
105
|
+
- **Adapters** — `errorbars import lm-eval|inspect` converts lm-evaluation-harness `--log_samples`
|
|
106
|
+
output or an Inspect AI `.eval` log into the canonical format (see below).
|
|
107
|
+
- **Web calculator** — a static "how many eval questions do I need?" power calculator
|
|
108
|
+
([live demo](https://antonsoo.github.io/errorbars/)), whose TypeScript formulas are checked
|
|
109
|
+
against the Python ones by the test suite.
|
|
110
|
+
- Typed Python ≥3.10, `numpy` the only runtime dependency; `pandas` and `matplotlib` are optional
|
|
111
|
+
extras; `scipy`/`statsmodels` are test-only oracles, never imported at runtime.
|
|
112
|
+
|
|
113
|
+
## Usage
|
|
114
|
+
|
|
115
|
+
```bash
|
|
116
|
+
errorbars summarize examples/data/reading_comprehension.csv --model tuned-70b
|
|
117
|
+
```
|
|
118
|
+
|
|
119
|
+
```
|
|
120
|
+
summarize: tuned-70b
|
|
121
|
+
┏━━━━━━━━┳━━━━━━━━━━━━━━━━━━┓
|
|
122
|
+
┃ metric ┃ value ┃
|
|
123
|
+
┡━━━━━━━━╇━━━━━━━━━━━━━━━━━━┩
|
|
124
|
+
│ n │ 200 │
|
|
125
|
+
│ mean │ 0.6900 │
|
|
126
|
+
│ SE │ 0.0328 │
|
|
127
|
+
│ 95% CI │ [0.6257, 0.7543] │
|
|
128
|
+
│ method │ clt │
|
|
129
|
+
└────────┴──────────────────┘
|
|
130
|
+
clustering diagnostics
|
|
131
|
+
┏━━━━━━━━━━━━━━━┳━━━━━━━━━━━━━━━━━━┓
|
|
132
|
+
┃ metric ┃ value ┃
|
|
133
|
+
┡━━━━━━━━━━━━━━━╇━━━━━━━━━━━━━━━━━━┩
|
|
134
|
+
│ n clusters │ 40 │
|
|
135
|
+
│ ICC │ 0.0710 │
|
|
136
|
+
│ design effect │ 1.284 │
|
|
137
|
+
│ clustered SE │ 0.0372 │
|
|
138
|
+
│ clustered CI │ [0.6148, 0.7652] │
|
|
139
|
+
└───────────────┴──────────────────┘
|
|
140
|
+
```
|
|
141
|
+
|
|
142
|
+
```bash
|
|
143
|
+
errorbars compare examples/data/reading_comprehension.csv \
|
|
144
|
+
--model-a tuned-70b --model-b baseline-70b
|
|
145
|
+
```
|
|
146
|
+
|
|
147
|
+
```
|
|
148
|
+
mean diff (A - B) 0.0700
|
|
149
|
+
paired SE 0.0440
|
|
150
|
+
95% CI [-0.0167, 0.1567]
|
|
151
|
+
p-value 0.1131
|
|
152
|
+
correlation(A, B) 0.1434
|
|
153
|
+
variance reduction from pairing 14.3%
|
|
154
|
+
McNemar exact p-value 0.1405
|
|
155
|
+
```
|
|
156
|
+
|
|
157
|
+
```bash
|
|
158
|
+
errorbars power --delta 0.05 --baseline 0.65 --rho 0.14 --cluster-deff 1.28
|
|
159
|
+
```
|
|
160
|
+
|
|
161
|
+
```
|
|
162
|
+
Questions needed: 1573
|
|
163
|
+
```
|
|
164
|
+
|
|
165
|
+
Every number above is copied verbatim from running these commands against
|
|
166
|
+
`examples/data/reading_comprehension.csv` (synthetic — see below). The full leaderboard output and
|
|
167
|
+
the reasoning behind each step are in [`examples/README.md`](https://github.com/antonsoo/errorbars/blob/main/examples/README.md).
|
|
168
|
+
|
|
169
|
+
### Input format
|
|
170
|
+
|
|
171
|
+
Long-format CSV or JSONL, one row per observation:
|
|
172
|
+
|
|
173
|
+
| question_id | cluster_id (optional) | model | score | sample (optional) |
|
|
174
|
+
|---|---|---|---|---|
|
|
175
|
+
| q1 | passage-003 | tuned-70b | 1 | |
|
|
176
|
+
|
|
177
|
+
Column names are configurable (`--question-col`, `--cluster-col`, etc., or `ColumnMap` in Python).
|
|
178
|
+
Scores can be binary (0/1) or continuous. `cluster_id` groups correlated questions (e.g. several
|
|
179
|
+
questions per reading passage); `sample` marks repeated generations of the same question.
|
|
180
|
+
|
|
181
|
+
### Importing from lm-evaluation-harness or Inspect AI
|
|
182
|
+
|
|
183
|
+
`errorbars import` converts either tool's own log format into the canonical CSV above:
|
|
184
|
+
|
|
185
|
+
```bash
|
|
186
|
+
# lm-evaluation-harness: lm_eval run --model <...> --tasks <...> --log_samples --output_path <dir>
|
|
187
|
+
errorbars import lm-eval runs/<dir>/samples_<task>_<timestamp>.jsonl \
|
|
188
|
+
--model my-model-name -o converted.csv
|
|
189
|
+
|
|
190
|
+
# Inspect AI: inspect eval <task> --model <...> (writes a .eval log by default)
|
|
191
|
+
errorbars import inspect logs/<run>.eval -o converted.csv
|
|
192
|
+
```
|
|
193
|
+
|
|
194
|
+
`--metric` (lm-eval) picks which computed metric to use as the score when a task reports more than
|
|
195
|
+
one (e.g. `acc` vs. `acc_norm`); it defaults to the first one. `--scorer` (Inspect) does the same
|
|
196
|
+
for tasks with multiple scorers. Inspect epochs (`--epochs N`, repeated sampling of the same input)
|
|
197
|
+
land in the `sample` column automatically.
|
|
198
|
+
|
|
199
|
+
Both adapters were built and tested against real, unedited output — not from memory: **lm-eval
|
|
200
|
+
0.4.13** (`lm_eval run --model dummy --tasks copa --limit 20 --log_samples ...`, plus a
|
|
201
|
+
multi-metric `arc_easy` run) and **inspect-ai 0.3.268** (a 5-sample task through the built-in
|
|
202
|
+
`mockllm/model` provider). The exact log files are committed as test fixtures
|
|
203
|
+
(`tests/fixtures/samples_*.jsonl`, `tests/fixtures/inspect_tiny_qa.eval`) and re-parsed in
|
|
204
|
+
`tests/test_adapters.py` on every run. The Inspect adapter reads logs with Inspect's own
|
|
205
|
+
`inspect_ai.log.read_eval_log` and `inspect_ai.scorer.value_to_float` rather than hand-parsing its
|
|
206
|
+
binary `.eval` format, and needs the `inspect` extra:
|
|
207
|
+
`pip install "errorbars[inspect]"`. The lm-eval
|
|
208
|
+
adapter has no extra dependency — `--log_samples` is already plain JSONL.
|
|
209
|
+
|
|
210
|
+
## How it works
|
|
211
|
+
|
|
212
|
+
Every statistic is implemented from scratch on `numpy` + the standard library
|
|
213
|
+
(`statistics.NormalDist` for normal quantiles; Student-t tails from a continued-fraction incomplete
|
|
214
|
+
beta function) — no scipy or statsmodels at runtime.
|
|
215
|
+
Full derivations with references are in [`docs/formulas.md`](https://github.com/antonsoo/errorbars/blob/main/docs/formulas.md):
|
|
216
|
+
|
|
217
|
+
1. CLT and Wilson confidence intervals for a mean
|
|
218
|
+
2. Cluster-robust standard errors (the CR1 sandwich estimator, matching
|
|
219
|
+
`statsmodels`' `cov_type="cluster"`)
|
|
220
|
+
3. Intraclass correlation and Kish's design effect
|
|
221
|
+
4. Within/between-question variance decomposition for repeated sampling
|
|
222
|
+
5. Paired comparisons, variance reduction from pairing, and exact McNemar
|
|
223
|
+
6. Holm-Bonferroni correction and maximal-clique grouping for leaderboards
|
|
224
|
+
7. Power analysis (sample size and minimum detectable effect) under pairing and clustering
|
|
225
|
+
|
|
226
|
+
## Accuracy and limitations
|
|
227
|
+
|
|
228
|
+
- Cluster-robust SE matches `statsmodels`' `OLS(..., cov_type="cluster")` to 1e-9 on both balanced
|
|
229
|
+
and unbalanced cluster sizes; Wilson intervals match `statsmodels.stats.proportion_confint` to
|
|
230
|
+
1e-9; the paired t-test matches `scipy.stats.ttest_rel` to 1e-7 at any n, and McNemar's exact
|
|
231
|
+
test is cross-checked against `statsmodels`.
|
|
232
|
+
See `tests/test_stats_vs_oracles.py` and `tests/test_compare_vs_oracles.py`.
|
|
233
|
+
- Monte Carlo coverage tests (`tests/test_coverage_montecarlo.py`) confirm nominal 95% CIs cover
|
|
234
|
+
the true parameter close to 95% of the time — for CLT, Wilson, bootstrap, and cluster-robust
|
|
235
|
+
intervals — with a tolerance sized to the trial count so it won't flake.
|
|
236
|
+
- Paired comparisons use Student's t with n − 1 degrees of freedom, like `scipy.stats.ttest_rel`,
|
|
237
|
+
and clustered SEs use t with G − 1 for G clusters (Cameron & Miller 2015), computed without
|
|
238
|
+
scipy. With few clusters that interval is honest but wide; the per-model `clt` interval stays
|
|
239
|
+
normal-based, which is only right once n is in the dozens.
|
|
240
|
+
- The power formula's samples-per-question adjustment assumes all single-sample variance is
|
|
241
|
+
decoding noise (see `docs/formulas.md` §11 for why, and the caveat on when this is optimistic).
|
|
242
|
+
It's a planning tool for before you run the eval; for a post-hoc measurement with the true
|
|
243
|
+
within/between-question split, use `summarize` on data with a `sample` column instead.
|
|
244
|
+
- Leaderboard groups are maximal cliques of the "not significantly different" graph, which is the
|
|
245
|
+
statistically direct approach — it can produce a model in more than one group, unlike a
|
|
246
|
+
minimal-letters heuristic (e.g. R's `multcompView`).
|
|
247
|
+
- 168 Python tests, 605 TypeScript tests (cross-checking the JS formulas against Python-generated
|
|
248
|
+
vectors), all passing on this box (14 vCPU WSL2 Linux, 48 GB RAM; Python 3.12.3, Node 26.7.0)
|
|
249
|
+
as of 2026-10-01.
|
|
250
|
+
|
|
251
|
+
## Web calculator
|
|
252
|
+
|
|
253
|
+
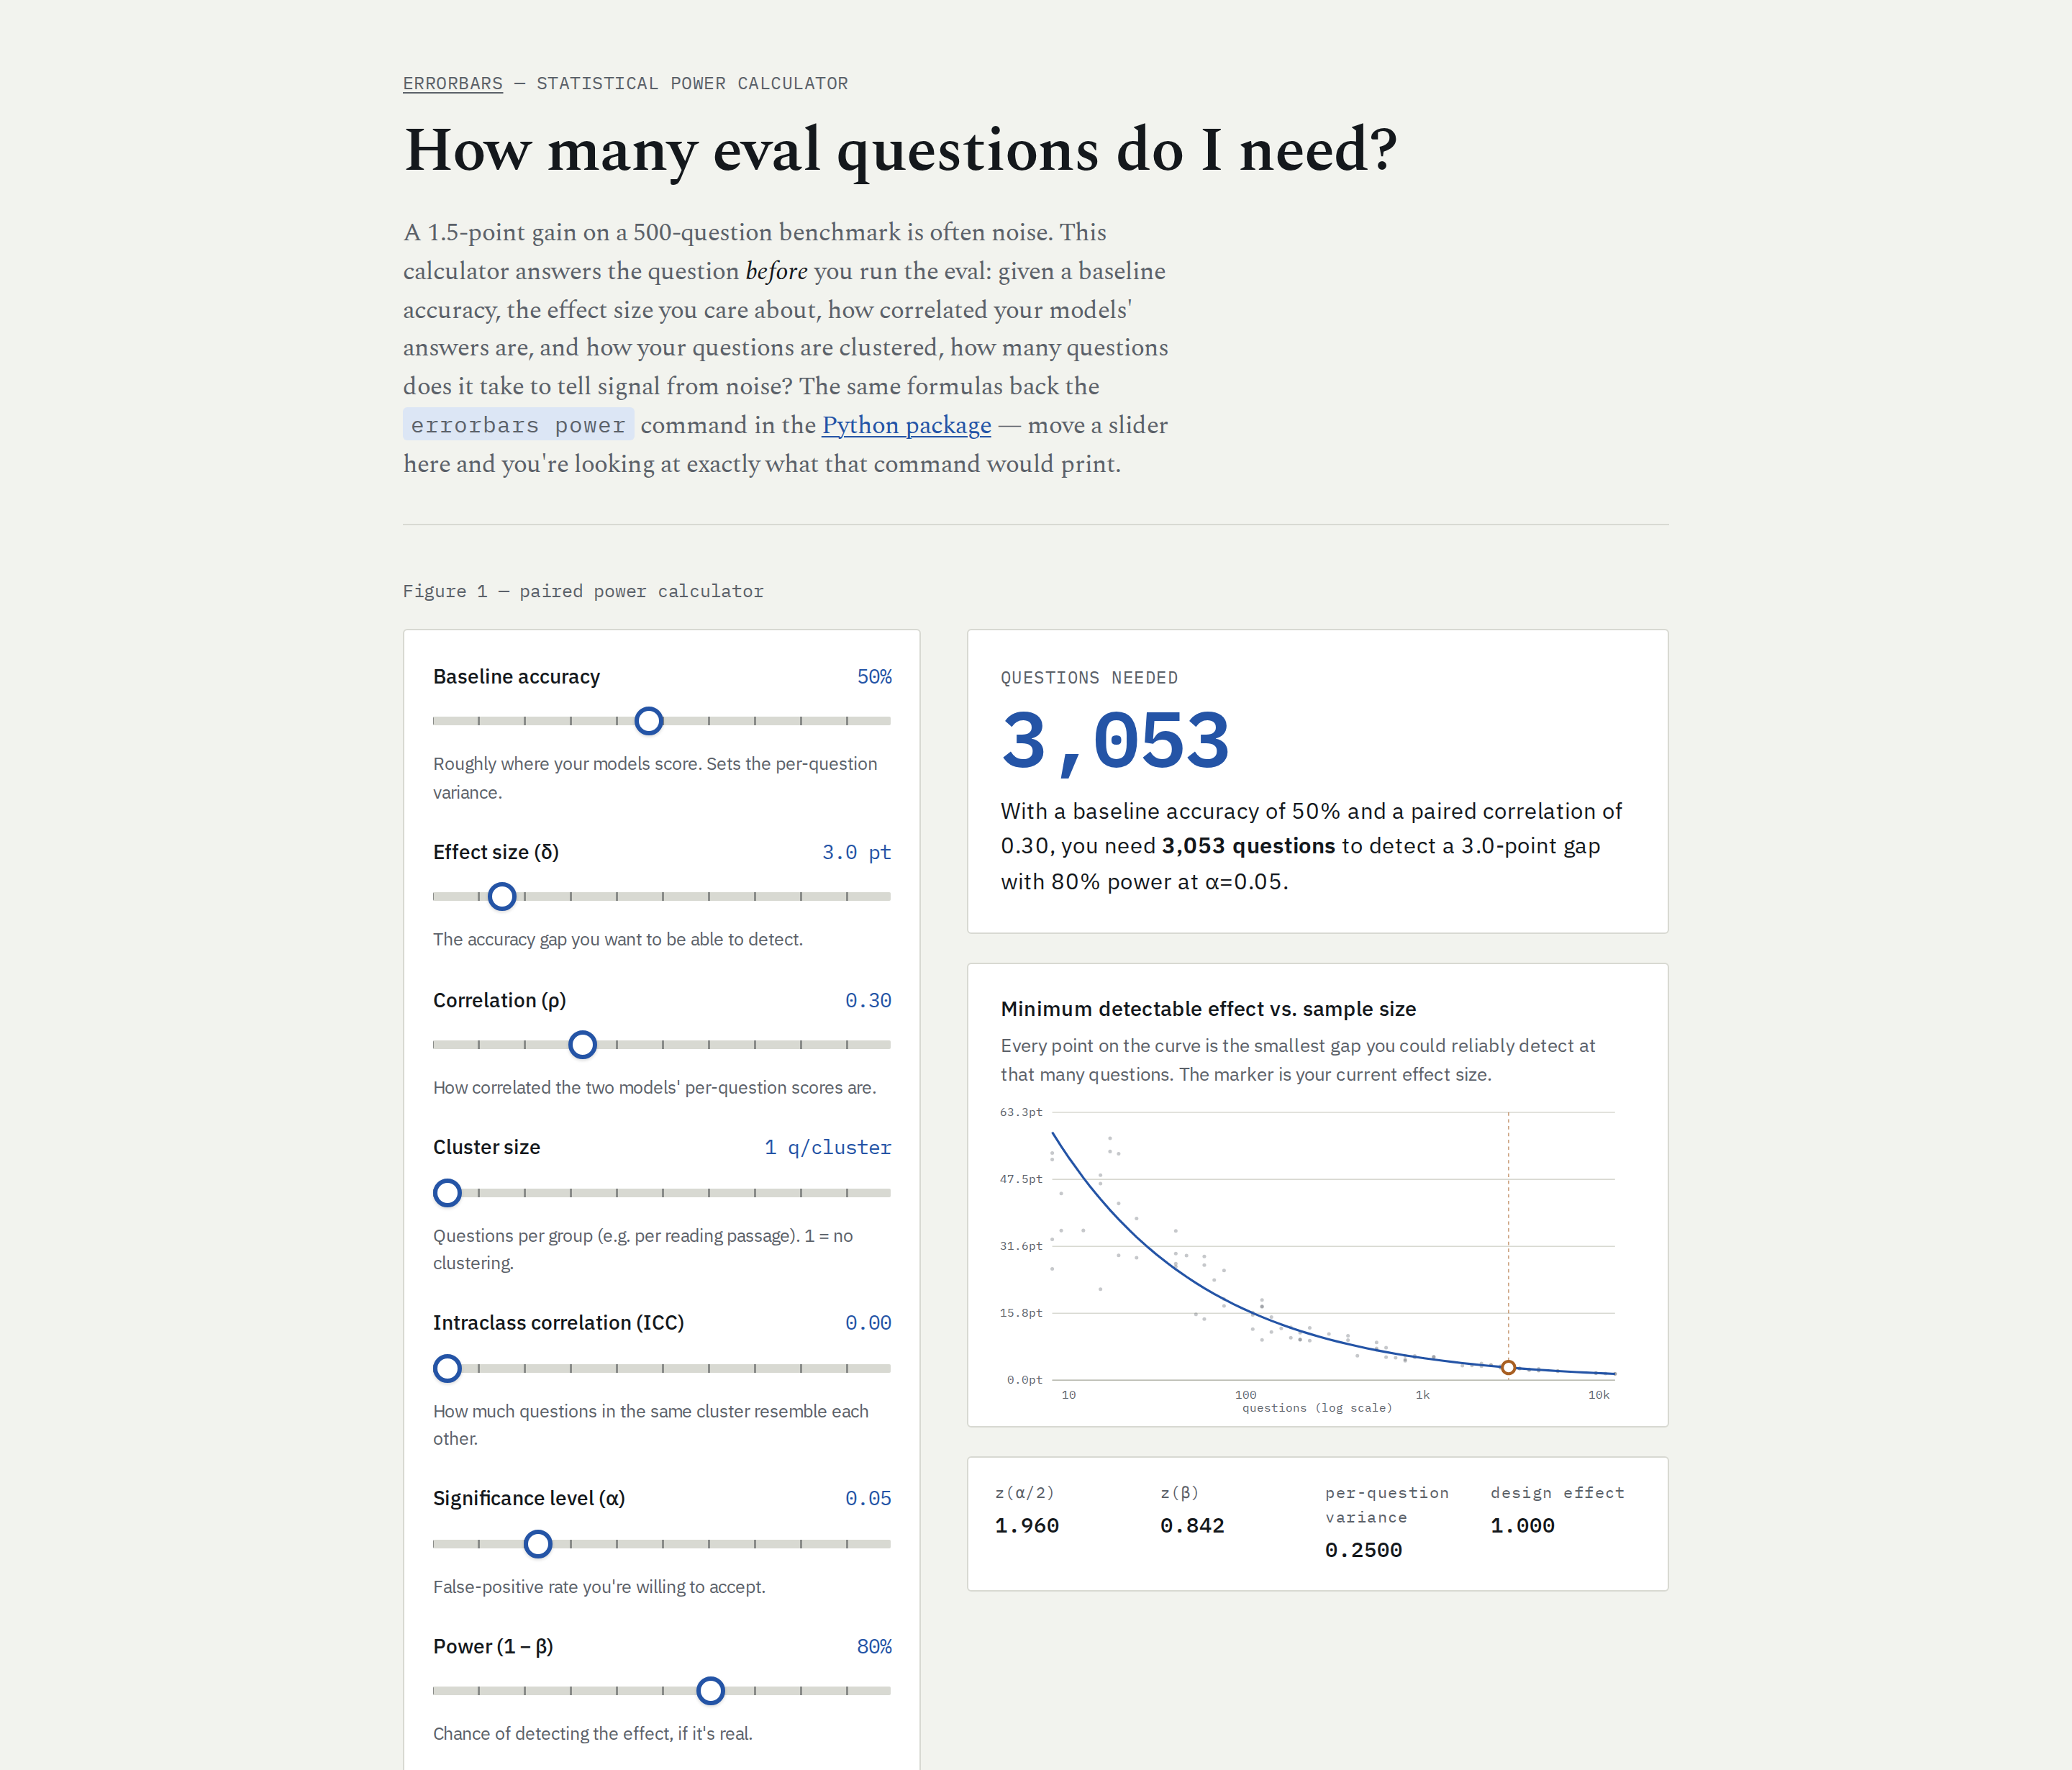
[`web/`](https://github.com/antonsoo/errorbars/blob/main/web/) is a static Vite + TypeScript "how many eval questions do I need?" calculator
|
|
254
|
+
([live demo](https://antonsoo.github.io/errorbars/)). Its power formulas
|
|
255
|
+
(`web/src/power.ts`, `web/src/normal.ts`) are a direct port of `src/errorbars/power.py`; Python
|
|
256
|
+
generates JSON test vectors (`scripts/export_test_vectors.py` → `web/test-vectors.json`) that the
|
|
257
|
+
TypeScript test suite checks against, so the two implementations can't silently drift apart.
|
|
258
|
+
|
|
259
|
+
|
|
260
|
+
|
|
261
|
+
## Development
|
|
262
|
+
|
|
263
|
+
```bash
|
|
264
|
+
uv sync --group dev --extra all
|
|
265
|
+
uv run pytest
|
|
266
|
+
uv run ruff check .
|
|
267
|
+
uv run mypy src/errorbars
|
|
268
|
+
```
|
|
269
|
+
|
|
270
|
+
See [`CONTRIBUTING.md`](https://github.com/antonsoo/errorbars/blob/main/CONTRIBUTING.md) for the web calculator's dev loop and guidelines.
|
|
271
|
+
|
|
272
|
+
## Contributing
|
|
273
|
+
|
|
274
|
+
Issues and PRs welcome. Any new statistic needs a test against an independent oracle (reference
|
|
275
|
+
library, closed form, or Monte Carlo simulation) — see `tests/` for the pattern.
|
|
276
|
+
|
|
277
|
+
## Citations
|
|
278
|
+
|
|
279
|
+
```bibtex
|
|
280
|
+
@misc{miller2024addingerrorbarsevals,
|
|
281
|
+
title = {Adding Error Bars to Evals: A Statistical Approach to Language Model Evaluations},
|
|
282
|
+
author = {Evan Miller},
|
|
283
|
+
year = {2024},
|
|
284
|
+
eprint = {2411.00640},
|
|
285
|
+
archivePrefix = {arXiv},
|
|
286
|
+
primaryClass = {stat.AP},
|
|
287
|
+
url = {https://arxiv.org/abs/2411.00640}
|
|
288
|
+
}
|
|
289
|
+
```
|
|
290
|
+
|
|
291
|
+
## License
|
|
292
|
+
|
|
293
|
+
[MIT](https://github.com/antonsoo/errorbars/blob/main/LICENSE) © 2026 Anton Soloviev
|
|
294
|
+
|
|
295
|
+
---
|
|
296
|
+
|
|
297
|
+
<sub>Part of [Officina](https://antonsoo.github.io/officina/), a set of small open-source tools by [Anton Soloviev](https://github.com/antonsoo).</sub>
|
|
@@ -0,0 +1,259 @@
|
|
|
1
|
+
# errorbars
|
|
2
|
+
|
|
3
|
+
**Error bars for LLM evals. Know whether model B is actually better, or you're reading noise.**
|
|
4
|
+
|
|
5
|
+
[](LICENSE)
|
|
6
|
+
[](https://antonsoo.github.io/errorbars/)
|
|
7
|
+
[](https://huggingface.co/spaces/antonsoloviev/errorbars)
|
|
8
|
+
|
|
9
|
+
LLM eval results get reported as bare accuracies — "model B scored 71.2%, up from 69.7%" — with
|
|
10
|
+
no error bar, no significance test, and no accounting for the fact that the questions came in
|
|
11
|
+
correlated groups. On a 500-question benchmark, a 1.5-point gain is very often noise: at a 50%
|
|
12
|
+
baseline you'd need roughly a 9-point gap to reliably detect anything at 80% power, α=0.05
|
|
13
|
+
(`errorbars power --n 500 --baseline 0.5` → minimum detectable effect ≈ 8.9 points). Evan Miller's
|
|
14
|
+
"[Adding Error Bars to Evals: A Statistical Approach to Language Model
|
|
15
|
+
Evaluations](https://arxiv.org/abs/2411.00640)" (arXiv:2411.00640, 2024) lays out the right
|
|
16
|
+
practice — CLT and clustered standard errors, variance reduction through pairing, power analysis —
|
|
17
|
+
and this package turns it into a one-liner.
|
|
18
|
+
|
|
19
|
+

|
|
20
|
+
|
|
21
|
+
## Why this exists
|
|
22
|
+
|
|
23
|
+
Run `errorbars leaderboard` on a synthetic benchmark (below) and one apparent 7-point win —
|
|
24
|
+
`tuned-70b` over `baseline-70b`, 0.690 vs. 0.620 — is not statistically significant once it has a
|
|
25
|
+
proper error bar: the paired test already gives p = 0.11. Accounting for the fact that questions
|
|
26
|
+
come 5-to-a-passage, and Holm-correcting across all 6 pairwise comparisons on the board, pushes
|
|
27
|
+
that to p = 0.32. A naive leaderboard that ranks by bare accuracy would still have shipped the gap
|
|
28
|
+
as a win. The full walkthrough, with every number copied from a real command, is in
|
|
29
|
+
[`examples/README.md`](examples/README.md).
|
|
30
|
+
|
|
31
|
+
## Quickstart
|
|
32
|
+
|
|
33
|
+
```bash
|
|
34
|
+
pip install "errorbars[cli]"
|
|
35
|
+
errorbars power --delta 0.03 --baseline 0.5
|
|
36
|
+
```
|
|
37
|
+
|
|
38
|
+
```
|
|
39
|
+
Questions needed: 4361
|
|
40
|
+
```
|
|
41
|
+
|
|
42
|
+
That's how many questions you'd need to reliably detect a 3-point accuracy gap at a 50% baseline,
|
|
43
|
+
with the defaults (80% power, α=0.05, no pairing correlation, no clustering). Clone the repo to
|
|
44
|
+
try it against real per-item scores:
|
|
45
|
+
|
|
46
|
+
```bash
|
|
47
|
+
git clone https://github.com/antonsoo/errorbars && cd errorbars
|
|
48
|
+
errorbars leaderboard examples/data/reading_comprehension.csv
|
|
49
|
+
```
|
|
50
|
+
|
|
51
|
+
## Features
|
|
52
|
+
|
|
53
|
+
- **`summarize`** — mean, SE, and 95% CI (CLT by default, Wilson for small-n binary scores,
|
|
54
|
+
bootstrap on request); clustered SE with design effect and ICC when a `cluster_id` column is
|
|
55
|
+
present; within/between-question variance decomposition when a `sample` column is present.
|
|
56
|
+
- **`compare`** — paired mean difference, SE, CI, p-value; the correlation between the two models'
|
|
57
|
+
per-question scores and how much pairing shrank the SE vs. an unpaired comparison; a
|
|
58
|
+
cluster-robust paired SE/p-value when clusters are present; exact McNemar test for binary scores.
|
|
59
|
+
- **`leaderboard`** — every model with its CI, Holm-corrected pairwise paired tests, and groups of
|
|
60
|
+
statistically indistinguishable models (maximal cliques of the "not significantly different"
|
|
61
|
+
graph); a forest plot (SVG, no dependency; matplotlib if installed).
|
|
62
|
+
- **`power`** — number of questions needed to detect an effect δ at a given α and power, or the
|
|
63
|
+
minimum detectable effect for a given n, accounting for pairing correlation, repeated sampling,
|
|
64
|
+
and cluster design effect.
|
|
65
|
+
- **CLI** — `errorbars summarize|compare|leaderboard|power|import`, `rich` tables by default,
|
|
66
|
+
`--json` for scripting.
|
|
67
|
+
- **Adapters** — `errorbars import lm-eval|inspect` converts lm-evaluation-harness `--log_samples`
|
|
68
|
+
output or an Inspect AI `.eval` log into the canonical format (see below).
|
|
69
|
+
- **Web calculator** — a static "how many eval questions do I need?" power calculator
|
|
70
|
+
([live demo](https://antonsoo.github.io/errorbars/)), whose TypeScript formulas are checked
|
|
71
|
+
against the Python ones by the test suite.
|
|
72
|
+
- Typed Python ≥3.10, `numpy` the only runtime dependency; `pandas` and `matplotlib` are optional
|
|
73
|
+
extras; `scipy`/`statsmodels` are test-only oracles, never imported at runtime.
|
|
74
|
+
|
|
75
|
+
## Usage
|
|
76
|
+
|
|
77
|
+
```bash
|
|
78
|
+
errorbars summarize examples/data/reading_comprehension.csv --model tuned-70b
|
|
79
|
+
```
|
|
80
|
+
|
|
81
|
+
```
|
|
82
|
+
summarize: tuned-70b
|
|
83
|
+
┏━━━━━━━━┳━━━━━━━━━━━━━━━━━━┓
|
|
84
|
+
┃ metric ┃ value ┃
|
|
85
|
+
┡━━━━━━━━╇━━━━━━━━━━━━━━━━━━┩
|
|
86
|
+
│ n │ 200 │
|
|
87
|
+
│ mean │ 0.6900 │
|
|
88
|
+
│ SE │ 0.0328 │
|
|
89
|
+
│ 95% CI │ [0.6257, 0.7543] │
|
|
90
|
+
│ method │ clt │
|
|
91
|
+
└────────┴──────────────────┘
|
|
92
|
+
clustering diagnostics
|
|
93
|
+
┏━━━━━━━━━━━━━━━┳━━━━━━━━━━━━━━━━━━┓
|
|
94
|
+
┃ metric ┃ value ┃
|
|
95
|
+
┡━━━━━━━━━━━━━━━╇━━━━━━━━━━━━━━━━━━┩
|
|
96
|
+
│ n clusters │ 40 │
|
|
97
|
+
│ ICC │ 0.0710 │
|
|
98
|
+
│ design effect │ 1.284 │
|
|
99
|
+
│ clustered SE │ 0.0372 │
|
|
100
|
+
│ clustered CI │ [0.6148, 0.7652] │
|
|
101
|
+
└───────────────┴──────────────────┘
|
|
102
|
+
```
|
|
103
|
+
|
|
104
|
+
```bash
|
|
105
|
+
errorbars compare examples/data/reading_comprehension.csv \
|
|
106
|
+
--model-a tuned-70b --model-b baseline-70b
|
|
107
|
+
```
|
|
108
|
+
|
|
109
|
+
```
|
|
110
|
+
mean diff (A - B) 0.0700
|
|
111
|
+
paired SE 0.0440
|
|
112
|
+
95% CI [-0.0167, 0.1567]
|
|
113
|
+
p-value 0.1131
|
|
114
|
+
correlation(A, B) 0.1434
|
|
115
|
+
variance reduction from pairing 14.3%
|
|
116
|
+
McNemar exact p-value 0.1405
|
|
117
|
+
```
|
|
118
|
+
|
|
119
|
+
```bash
|
|
120
|
+
errorbars power --delta 0.05 --baseline 0.65 --rho 0.14 --cluster-deff 1.28
|
|
121
|
+
```
|
|
122
|
+
|
|
123
|
+
```
|
|
124
|
+
Questions needed: 1573
|
|
125
|
+
```
|
|
126
|
+
|
|
127
|
+
Every number above is copied verbatim from running these commands against
|
|
128
|
+
`examples/data/reading_comprehension.csv` (synthetic — see below). The full leaderboard output and
|
|
129
|
+
the reasoning behind each step are in [`examples/README.md`](examples/README.md).
|
|
130
|
+
|
|
131
|
+
### Input format
|
|
132
|
+
|
|
133
|
+
Long-format CSV or JSONL, one row per observation:
|
|
134
|
+
|
|
135
|
+
| question_id | cluster_id (optional) | model | score | sample (optional) |
|
|
136
|
+
|---|---|---|---|---|
|
|
137
|
+
| q1 | passage-003 | tuned-70b | 1 | |
|
|
138
|
+
|
|
139
|
+
Column names are configurable (`--question-col`, `--cluster-col`, etc., or `ColumnMap` in Python).
|
|
140
|
+
Scores can be binary (0/1) or continuous. `cluster_id` groups correlated questions (e.g. several
|
|
141
|
+
questions per reading passage); `sample` marks repeated generations of the same question.
|
|
142
|
+
|
|
143
|
+
### Importing from lm-evaluation-harness or Inspect AI
|
|
144
|
+
|
|
145
|
+
`errorbars import` converts either tool's own log format into the canonical CSV above:
|
|
146
|
+
|
|
147
|
+
```bash
|
|
148
|
+
# lm-evaluation-harness: lm_eval run --model <...> --tasks <...> --log_samples --output_path <dir>
|
|
149
|
+
errorbars import lm-eval runs/<dir>/samples_<task>_<timestamp>.jsonl \
|
|
150
|
+
--model my-model-name -o converted.csv
|
|
151
|
+
|
|
152
|
+
# Inspect AI: inspect eval <task> --model <...> (writes a .eval log by default)
|
|
153
|
+
errorbars import inspect logs/<run>.eval -o converted.csv
|
|
154
|
+
```
|
|
155
|
+
|
|
156
|
+
`--metric` (lm-eval) picks which computed metric to use as the score when a task reports more than
|
|
157
|
+
one (e.g. `acc` vs. `acc_norm`); it defaults to the first one. `--scorer` (Inspect) does the same
|
|
158
|
+
for tasks with multiple scorers. Inspect epochs (`--epochs N`, repeated sampling of the same input)
|
|
159
|
+
land in the `sample` column automatically.
|
|
160
|
+
|
|
161
|
+
Both adapters were built and tested against real, unedited output — not from memory: **lm-eval
|
|
162
|
+
0.4.13** (`lm_eval run --model dummy --tasks copa --limit 20 --log_samples ...`, plus a
|
|
163
|
+
multi-metric `arc_easy` run) and **inspect-ai 0.3.268** (a 5-sample task through the built-in
|
|
164
|
+
`mockllm/model` provider). The exact log files are committed as test fixtures
|
|
165
|
+
(`tests/fixtures/samples_*.jsonl`, `tests/fixtures/inspect_tiny_qa.eval`) and re-parsed in
|
|
166
|
+
`tests/test_adapters.py` on every run. The Inspect adapter reads logs with Inspect's own
|
|
167
|
+
`inspect_ai.log.read_eval_log` and `inspect_ai.scorer.value_to_float` rather than hand-parsing its
|
|
168
|
+
binary `.eval` format, and needs the `inspect` extra:
|
|
169
|
+
`pip install "errorbars[inspect]"`. The lm-eval
|
|
170
|
+
adapter has no extra dependency — `--log_samples` is already plain JSONL.
|
|
171
|
+
|
|
172
|
+
## How it works
|
|
173
|
+
|
|
174
|
+
Every statistic is implemented from scratch on `numpy` + the standard library
|
|
175
|
+
(`statistics.NormalDist` for normal quantiles; Student-t tails from a continued-fraction incomplete
|
|
176
|
+
beta function) — no scipy or statsmodels at runtime.
|
|
177
|
+
Full derivations with references are in [`docs/formulas.md`](docs/formulas.md):
|
|
178
|
+
|
|
179
|
+
1. CLT and Wilson confidence intervals for a mean
|
|
180
|
+
2. Cluster-robust standard errors (the CR1 sandwich estimator, matching
|
|
181
|
+
`statsmodels`' `cov_type="cluster"`)
|
|
182
|
+
3. Intraclass correlation and Kish's design effect
|
|
183
|
+
4. Within/between-question variance decomposition for repeated sampling
|
|
184
|
+
5. Paired comparisons, variance reduction from pairing, and exact McNemar
|
|
185
|
+
6. Holm-Bonferroni correction and maximal-clique grouping for leaderboards
|
|
186
|
+
7. Power analysis (sample size and minimum detectable effect) under pairing and clustering
|
|
187
|
+
|
|
188
|
+
## Accuracy and limitations
|
|
189
|
+
|
|
190
|
+
- Cluster-robust SE matches `statsmodels`' `OLS(..., cov_type="cluster")` to 1e-9 on both balanced
|
|
191
|
+
and unbalanced cluster sizes; Wilson intervals match `statsmodels.stats.proportion_confint` to
|
|
192
|
+
1e-9; the paired t-test matches `scipy.stats.ttest_rel` to 1e-7 at any n, and McNemar's exact
|
|
193
|
+
test is cross-checked against `statsmodels`.
|
|
194
|
+
See `tests/test_stats_vs_oracles.py` and `tests/test_compare_vs_oracles.py`.
|
|
195
|
+
- Monte Carlo coverage tests (`tests/test_coverage_montecarlo.py`) confirm nominal 95% CIs cover
|
|
196
|
+
the true parameter close to 95% of the time — for CLT, Wilson, bootstrap, and cluster-robust
|
|
197
|
+
intervals — with a tolerance sized to the trial count so it won't flake.
|
|
198
|
+
- Paired comparisons use Student's t with n − 1 degrees of freedom, like `scipy.stats.ttest_rel`,
|
|
199
|
+
and clustered SEs use t with G − 1 for G clusters (Cameron & Miller 2015), computed without
|
|
200
|
+
scipy. With few clusters that interval is honest but wide; the per-model `clt` interval stays
|
|
201
|
+
normal-based, which is only right once n is in the dozens.
|
|
202
|
+
- The power formula's samples-per-question adjustment assumes all single-sample variance is
|
|
203
|
+
decoding noise (see `docs/formulas.md` §11 for why, and the caveat on when this is optimistic).
|
|
204
|
+
It's a planning tool for before you run the eval; for a post-hoc measurement with the true
|
|
205
|
+
within/between-question split, use `summarize` on data with a `sample` column instead.
|
|
206
|
+
- Leaderboard groups are maximal cliques of the "not significantly different" graph, which is the
|
|
207
|
+
statistically direct approach — it can produce a model in more than one group, unlike a
|
|
208
|
+
minimal-letters heuristic (e.g. R's `multcompView`).
|
|
209
|
+
- 168 Python tests, 605 TypeScript tests (cross-checking the JS formulas against Python-generated
|
|
210
|
+
vectors), all passing on this box (14 vCPU WSL2 Linux, 48 GB RAM; Python 3.12.3, Node 26.7.0)
|
|
211
|
+
as of 2026-10-01.
|
|
212
|
+
|
|
213
|
+
## Web calculator
|
|
214
|
+
|
|
215
|
+
[`web/`](web/) is a static Vite + TypeScript "how many eval questions do I need?" calculator
|
|
216
|
+
([live demo](https://antonsoo.github.io/errorbars/)). Its power formulas
|
|
217
|
+
(`web/src/power.ts`, `web/src/normal.ts`) are a direct port of `src/errorbars/power.py`; Python
|
|
218
|
+
generates JSON test vectors (`scripts/export_test_vectors.py` → `web/test-vectors.json`) that the
|
|
219
|
+
TypeScript test suite checks against, so the two implementations can't silently drift apart.
|
|
220
|
+
|
|
221
|
+

|
|
222
|
+
|
|
223
|
+
## Development
|
|
224
|
+
|
|
225
|
+
```bash
|
|
226
|
+
uv sync --group dev --extra all
|
|
227
|
+
uv run pytest
|
|
228
|
+
uv run ruff check .
|
|
229
|
+
uv run mypy src/errorbars
|
|
230
|
+
```
|
|
231
|
+
|
|
232
|
+
See [`CONTRIBUTING.md`](CONTRIBUTING.md) for the web calculator's dev loop and guidelines.
|
|
233
|
+
|
|
234
|
+
## Contributing
|
|
235
|
+
|
|
236
|
+
Issues and PRs welcome. Any new statistic needs a test against an independent oracle (reference
|
|
237
|
+
library, closed form, or Monte Carlo simulation) — see `tests/` for the pattern.
|
|
238
|
+
|
|
239
|
+
## Citations
|
|
240
|
+
|
|
241
|
+
```bibtex
|
|
242
|
+
@misc{miller2024addingerrorbarsevals,
|
|
243
|
+
title = {Adding Error Bars to Evals: A Statistical Approach to Language Model Evaluations},
|
|
244
|
+
author = {Evan Miller},
|
|
245
|
+
year = {2024},
|
|
246
|
+
eprint = {2411.00640},
|
|
247
|
+
archivePrefix = {arXiv},
|
|
248
|
+
primaryClass = {stat.AP},
|
|
249
|
+
url = {https://arxiv.org/abs/2411.00640}
|
|
250
|
+
}
|
|
251
|
+
```
|
|
252
|
+
|
|
253
|
+
## License
|
|
254
|
+
|
|
255
|
+
[MIT](LICENSE) © 2026 Anton Soloviev
|
|
256
|
+
|
|
257
|
+
---
|
|
258
|
+
|
|
259
|
+
<sub>Part of [Officina](https://antonsoo.github.io/officina/), a set of small open-source tools by [Anton Soloviev](https://github.com/antonsoo).</sub>
|