d3blocks 2.2.0__tar.gz → 2.2.1__tar.gz
This diff represents the content of publicly available package versions that have been released to one of the supported registries. The information contained in this diff is provided for informational purposes only and reflects changes between package versions as they appear in their respective public registries.
- d3blocks-2.2.1/PKG-INFO +159 -0
- d3blocks-2.2.1/README.md +128 -0
- {d3blocks-2.2.0 → d3blocks-2.2.1}/d3blocks/__init__.py +1 -1
- {d3blocks-2.2.0 → d3blocks-2.2.1}/d3blocks/examples.py +43 -4
- {d3blocks-2.2.0 → d3blocks-2.2.1}/d3blocks/heatmap/Heatmap.py +83 -34
- {d3blocks-2.2.0 → d3blocks-2.2.1}/d3blocks/heatmap/d3js/heatmap.html.j2 +25 -10
- {d3blocks-2.2.0 → d3blocks-2.2.1}/d3blocks/skills/d3blocks/SKILL.md +2 -1
- d3blocks-2.2.1/d3blocks.egg-info/PKG-INFO +159 -0
- d3blocks-2.2.0/PKG-INFO +0 -172
- d3blocks-2.2.0/README.md +0 -141
- d3blocks-2.2.0/d3blocks.egg-info/PKG-INFO +0 -172
- {d3blocks-2.2.0 → d3blocks-2.2.1}/LICENSE +0 -0
- {d3blocks-2.2.0 → d3blocks-2.2.1}/MANIFEST.in +0 -0
- {d3blocks-2.2.0 → d3blocks-2.2.1}/d3blocks/chord/Chord.py +0 -0
- {d3blocks-2.2.0 → d3blocks-2.2.1}/d3blocks/chord/__init__.py +0 -0
- {d3blocks-2.2.0 → d3blocks-2.2.1}/d3blocks/chord/d3js/__init__.py +0 -0
- {d3blocks-2.2.0 → d3blocks-2.2.1}/d3blocks/chord/d3js/chord.css +0 -0
- {d3blocks-2.2.0 → d3blocks-2.2.1}/d3blocks/chord/d3js/chord.html.j2 +0 -0
- {d3blocks-2.2.0 → d3blocks-2.2.1}/d3blocks/chord/d3js/chord.js +0 -0
- {d3blocks-2.2.0 → d3blocks-2.2.1}/d3blocks/circlepacking/Circlepacking.py +0 -0
- {d3blocks-2.2.0 → d3blocks-2.2.1}/d3blocks/circlepacking/__init__.py +0 -0
- {d3blocks-2.2.0 → d3blocks-2.2.1}/d3blocks/circlepacking/d3js/__init__.py +0 -0
- {d3blocks-2.2.0 → d3blocks-2.2.1}/d3blocks/circlepacking/d3js/circlepacking.css +0 -0
- {d3blocks-2.2.0 → d3blocks-2.2.1}/d3blocks/circlepacking/d3js/circlepacking.html.j2 +0 -0
- {d3blocks-2.2.0 → d3blocks-2.2.1}/d3blocks/circlepacking/d3js/d3.v6.min.js +0 -0
- {d3blocks-2.2.0 → d3blocks-2.2.1}/d3blocks/circlepacking/d3js/lodash.min.js +0 -0
- {d3blocks-2.2.0 → d3blocks-2.2.1}/d3blocks/d3blocks.py +0 -0
- {d3blocks-2.2.0 → d3blocks-2.2.1}/d3blocks/elasticgraph/__init__.py +0 -0
- {d3blocks-2.2.0 → d3blocks-2.2.1}/d3blocks/elasticgraph/d3js/.gitkeep +0 -0
- {d3blocks-2.2.0 → d3blocks-2.2.1}/d3blocks/elasticgraph/d3js/__init__.py +0 -0
- {d3blocks-2.2.0 → d3blocks-2.2.1}/d3blocks/elasticgraph/d3js/d3.v2.js +0 -0
- {d3blocks-2.2.0 → d3blocks-2.2.1}/d3blocks/elasticgraph/d3js/elasticgraph.css +0 -0
- {d3blocks-2.2.0 → d3blocks-2.2.1}/d3blocks/elasticgraph/d3js/elasticgraph.html.j2 +0 -0
- {d3blocks-2.2.0 → d3blocks-2.2.1}/d3blocks/elasticgraph/d3js/elasticgraph.js +0 -0
- {d3blocks-2.2.0 → d3blocks-2.2.1}/d3blocks/elasticgraph/elasticgraph.py +0 -0
- {d3blocks-2.2.0 → d3blocks-2.2.1}/d3blocks/examples_docs.py +0 -0
- {d3blocks-2.2.0 → d3blocks-2.2.1}/d3blocks/flowgraph/Flowgraph.py +0 -0
- {d3blocks-2.2.0 → d3blocks-2.2.1}/d3blocks/flowgraph/__init__.py +0 -0
- {d3blocks-2.2.0 → d3blocks-2.2.1}/d3blocks/flowgraph/d3js/__init__.py +0 -0
- {d3blocks-2.2.0 → d3blocks-2.2.1}/d3blocks/flowgraph/d3js/d3.flowgraph.js +0 -0
- {d3blocks-2.2.0 → d3blocks-2.2.1}/d3blocks/flowgraph/d3js/d3.v7.min.js +0 -0
- {d3blocks-2.2.0 → d3blocks-2.2.1}/d3blocks/flowgraph/d3js/dagre.LICENSE +0 -0
- {d3blocks-2.2.0 → d3blocks-2.2.1}/d3blocks/flowgraph/d3js/dagre.min.js +0 -0
- {d3blocks-2.2.0 → d3blocks-2.2.1}/d3blocks/flowgraph/d3js/elk.LICENSE.md +0 -0
- {d3blocks-2.2.0 → d3blocks-2.2.1}/d3blocks/flowgraph/d3js/elk.bundled.js +0 -0
- {d3blocks-2.2.0 → d3blocks-2.2.1}/d3blocks/flowgraph/d3js/flowgraph.css +0 -0
- {d3blocks-2.2.0 → d3blocks-2.2.1}/d3blocks/flowgraph/d3js/flowgraph.html.j2 +0 -0
- {d3blocks-2.2.0 → d3blocks-2.2.1}/d3blocks/heatmap/__init__.py +0 -0
- {d3blocks-2.2.0 → d3blocks-2.2.1}/d3blocks/heatmap/d3js/__init__.py +0 -0
- {d3blocks-2.2.0 → d3blocks-2.2.1}/d3blocks/heatmap/d3js/d3.scale.chromatic.v1.min.js +0 -0
- {d3blocks-2.2.0 → d3blocks-2.2.1}/d3blocks/heatmap/d3js/d3.v4.js +0 -0
- {d3blocks-2.2.0 → d3blocks-2.2.1}/d3blocks/heatmap/d3js/heatmap.css +0 -0
- {d3blocks-2.2.0 → d3blocks-2.2.1}/d3blocks/heatmap/d3js/matrix.html.j2 +0 -0
- {d3blocks-2.2.0 → d3blocks-2.2.1}/d3blocks/imageslider/Imageslider.py +0 -0
- {d3blocks-2.2.0 → d3blocks-2.2.1}/d3blocks/imageslider/__init__.py +0 -0
- {d3blocks-2.2.0 → d3blocks-2.2.1}/d3blocks/imageslider/d3js/.keep +0 -0
- {d3blocks-2.2.0 → d3blocks-2.2.1}/d3blocks/imageslider/d3js/__init__.py +0 -0
- {d3blocks-2.2.0 → d3blocks-2.2.1}/d3blocks/imageslider/d3js/imageslider.css +0 -0
- {d3blocks-2.2.0 → d3blocks-2.2.1}/d3blocks/imageslider/d3js/imageslider.html.j2 +0 -0
- {d3blocks-2.2.0 → d3blocks-2.2.1}/d3blocks/imageslider/d3js/imageslider.js +0 -0
- {d3blocks-2.2.0 → d3blocks-2.2.1}/d3blocks/imageslider/d3js/jquery-2.1.1.js +0 -0
- {d3blocks-2.2.0 → d3blocks-2.2.1}/d3blocks/imageslider/d3js/modernizr.js +0 -0
- {d3blocks-2.2.0 → d3blocks-2.2.1}/d3blocks/imageslider/d3js/reset.css +0 -0
- {d3blocks-2.2.0 → d3blocks-2.2.1}/d3blocks/logo.txt +0 -0
- {d3blocks-2.2.0 → d3blocks-2.2.1}/d3blocks/maps/Maps.py +0 -0
- {d3blocks-2.2.0 → d3blocks-2.2.1}/d3blocks/maps/__init__.py +0 -0
- {d3blocks-2.2.0 → d3blocks-2.2.1}/d3blocks/maps/d3js/__init__.py +0 -0
- {d3blocks-2.2.0 → d3blocks-2.2.1}/d3blocks/maps/d3js/d3.v6.min.js +0 -0
- {d3blocks-2.2.0 → d3blocks-2.2.1}/d3blocks/maps/d3js/geojson.zip +0 -0
- {d3blocks-2.2.0 → d3blocks-2.2.1}/d3blocks/maps/d3js/maps.css +0 -0
- {d3blocks-2.2.0 → d3blocks-2.2.1}/d3blocks/maps/d3js/maps.html.j2 +0 -0
- {d3blocks-2.2.0 → d3blocks-2.2.1}/d3blocks/maps/d3js/world.geojson +0 -0
- {d3blocks-2.2.0 → d3blocks-2.2.1}/d3blocks/matrix/Matrix.py +0 -0
- {d3blocks-2.2.0 → d3blocks-2.2.1}/d3blocks/matrix/__init__.py +0 -0
- {d3blocks-2.2.0 → d3blocks-2.2.1}/d3blocks/matrix/d3js/__init__.py +0 -0
- {d3blocks-2.2.0 → d3blocks-2.2.1}/d3blocks/matrix/d3js/d3.scale.chromatic.v1.min.js +0 -0
- {d3blocks-2.2.0 → d3blocks-2.2.1}/d3blocks/matrix/d3js/d3.v4.js +0 -0
- {d3blocks-2.2.0 → d3blocks-2.2.1}/d3blocks/matrix/d3js/matrix.html.j2 +0 -0
- {d3blocks-2.2.0 → d3blocks-2.2.1}/d3blocks/movingbubbles/Movingbubbles.py +0 -0
- {d3blocks-2.2.0 → d3blocks-2.2.1}/d3blocks/movingbubbles/__init__.py +0 -0
- {d3blocks-2.2.0 → d3blocks-2.2.1}/d3blocks/movingbubbles/d3js/__init__.py +0 -0
- {d3blocks-2.2.0 → d3blocks-2.2.1}/d3blocks/movingbubbles/d3js/d3-3-5-5.min.js +0 -0
- {d3blocks-2.2.0 → d3blocks-2.2.1}/d3blocks/movingbubbles/d3js/movingbubbles.css +0 -0
- {d3blocks-2.2.0 → d3blocks-2.2.1}/d3blocks/movingbubbles/d3js/movingbubbles.html.j2 +0 -0
- {d3blocks-2.2.0 → d3blocks-2.2.1}/d3blocks/particles/Particles.py +0 -0
- {d3blocks-2.2.0 → d3blocks-2.2.1}/d3blocks/particles/__init__.py +0 -0
- {d3blocks-2.2.0 → d3blocks-2.2.1}/d3blocks/particles/d3js/__init__.py +0 -0
- {d3blocks-2.2.0 → d3blocks-2.2.1}/d3blocks/particles/d3js/d3-scale-chromatic.v1.min.js +0 -0
- {d3blocks-2.2.0 → d3blocks-2.2.1}/d3blocks/particles/d3js/d3.v4.min.js +0 -0
- {d3blocks-2.2.0 → d3blocks-2.2.1}/d3blocks/particles/d3js/particles.html.j2 +0 -0
- {d3blocks-2.2.0 → d3blocks-2.2.1}/d3blocks/radialgraph/Radialgraph.py +0 -0
- {d3blocks-2.2.0 → d3blocks-2.2.1}/d3blocks/radialgraph/__init__.py +0 -0
- {d3blocks-2.2.0 → d3blocks-2.2.1}/d3blocks/radialgraph/d3js/__init__ .py +0 -0
- {d3blocks-2.2.0 → d3blocks-2.2.1}/d3blocks/radialgraph/d3js/d3.radialgraph.js +0 -0
- {d3blocks-2.2.0 → d3blocks-2.2.1}/d3blocks/radialgraph/d3js/d3.v7.min.js +0 -0
- {d3blocks-2.2.0 → d3blocks-2.2.1}/d3blocks/radialgraph/d3js/radialgraph.css +0 -0
- {d3blocks-2.2.0 → d3blocks-2.2.1}/d3blocks/radialgraph/d3js/radialgraph.html.j2 +0 -0
- {d3blocks-2.2.0 → d3blocks-2.2.1}/d3blocks/sankey/Sankey.py +0 -0
- {d3blocks-2.2.0 → d3blocks-2.2.1}/d3blocks/sankey/__init__.py +0 -0
- {d3blocks-2.2.0 → d3blocks-2.2.1}/d3blocks/sankey/d3js/__init__.py +0 -0
- {d3blocks-2.2.0 → d3blocks-2.2.1}/d3blocks/sankey/d3js/sankey.css +0 -0
- {d3blocks-2.2.0 → d3blocks-2.2.1}/d3blocks/sankey/d3js/sankey.html.j2 +0 -0
- {d3blocks-2.2.0 → d3blocks-2.2.1}/d3blocks/sankey/d3js/sankey.js +0 -0
- {d3blocks-2.2.0 → d3blocks-2.2.1}/d3blocks/scatter/Scatter.py +0 -0
- {d3blocks-2.2.0 → d3blocks-2.2.1}/d3blocks/scatter/__init__.py +0 -0
- {d3blocks-2.2.0 → d3blocks-2.2.1}/d3blocks/scatter/d3js/__init__.py +0 -0
- {d3blocks-2.2.0 → d3blocks-2.2.1}/d3blocks/scatter/d3js/associations.js +0 -0
- {d3blocks-2.2.0 → d3blocks-2.2.1}/d3blocks/scatter/d3js/d3.v4.min.js +0 -0
- {d3blocks-2.2.0 → d3blocks-2.2.1}/d3blocks/scatter/d3js/scatter.css +0 -0
- {d3blocks-2.2.0 → d3blocks-2.2.1}/d3blocks/scatter/d3js/scatter.html.j2 +0 -0
- {d3blocks-2.2.0 → d3blocks-2.2.1}/d3blocks/skills/d3blocks/references/scatter.md +0 -0
- {d3blocks-2.2.0 → d3blocks-2.2.1}/d3blocks/skills_install.py +0 -0
- {d3blocks-2.2.0 → d3blocks-2.2.1}/d3blocks/tests/__init__.py +0 -0
- {d3blocks-2.2.0 → d3blocks-2.2.1}/d3blocks/tests/test_all_examples.py +0 -0
- {d3blocks-2.2.0 → d3blocks-2.2.1}/d3blocks/tests/test_chord_margins.py +0 -0
- {d3blocks-2.2.0 → d3blocks-2.2.1}/d3blocks/tests/test_d3blocks.py +0 -0
- {d3blocks-2.2.0 → d3blocks-2.2.1}/d3blocks/tests/test_flowgraph.py +0 -0
- {d3blocks-2.2.0 → d3blocks-2.2.1}/d3blocks/tests/test_medium_charts.py +0 -0
- {d3blocks-2.2.0 → d3blocks-2.2.1}/d3blocks/tests/test_movingbubbles_timedelta.py +0 -0
- {d3blocks-2.2.0 → d3blocks-2.2.1}/d3blocks/tests/test_radialgraph.py +0 -0
- {d3blocks-2.2.0 → d3blocks-2.2.1}/d3blocks/timeseries/Timeseries.py +0 -0
- {d3blocks-2.2.0 → d3blocks-2.2.1}/d3blocks/timeseries/__init__.py +0 -0
- {d3blocks-2.2.0 → d3blocks-2.2.1}/d3blocks/timeseries/d3js/__init__.py +0 -0
- {d3blocks-2.2.0 → d3blocks-2.2.1}/d3blocks/timeseries/d3js/d3.v3.js +0 -0
- {d3blocks-2.2.0 → d3blocks-2.2.1}/d3blocks/timeseries/d3js/timeseries.css +0 -0
- {d3blocks-2.2.0 → d3blocks-2.2.1}/d3blocks/timeseries/d3js/timeseries.html.j2 +0 -0
- {d3blocks-2.2.0 → d3blocks-2.2.1}/d3blocks/timeseries/d3js/timeseries.js +0 -0
- {d3blocks-2.2.0 → d3blocks-2.2.1}/d3blocks/tree/Tree.py +0 -0
- {d3blocks-2.2.0 → d3blocks-2.2.1}/d3blocks/tree/__init__.py +0 -0
- {d3blocks-2.2.0 → d3blocks-2.2.1}/d3blocks/tree/d3js/__init__.py +0 -0
- {d3blocks-2.2.0 → d3blocks-2.2.1}/d3blocks/tree/d3js/collapsibleTree.js +0 -0
- {d3blocks-2.2.0 → d3blocks-2.2.1}/d3blocks/tree/d3js/d3.tree.js +0 -0
- {d3blocks-2.2.0 → d3blocks-2.2.1}/d3blocks/tree/d3js/d3.v4.min.js +0 -0
- {d3blocks-2.2.0 → d3blocks-2.2.1}/d3blocks/tree/d3js/tree.css +0 -0
- {d3blocks-2.2.0 → d3blocks-2.2.1}/d3blocks/tree/d3js/tree.html.j2 +0 -0
- {d3blocks-2.2.0 → d3blocks-2.2.1}/d3blocks/treemap/Treemap.py +0 -0
- {d3blocks-2.2.0 → d3blocks-2.2.1}/d3blocks/treemap/__init__.py +0 -0
- {d3blocks-2.2.0 → d3blocks-2.2.1}/d3blocks/treemap/d3js/__init__.py +0 -0
- {d3blocks-2.2.0 → d3blocks-2.2.1}/d3blocks/treemap/d3js/d3.v4.min.js +0 -0
- {d3blocks-2.2.0 → d3blocks-2.2.1}/d3blocks/treemap/d3js/treemap.css +0 -0
- {d3blocks-2.2.0 → d3blocks-2.2.1}/d3blocks/treemap/d3js/treemap.html.j2 +0 -0
- {d3blocks-2.2.0 → d3blocks-2.2.1}/d3blocks/utils.py +0 -0
- {d3blocks-2.2.0 → d3blocks-2.2.1}/d3blocks/violin/Violin.py +0 -0
- {d3blocks-2.2.0 → d3blocks-2.2.1}/d3blocks/violin/__init__.py +0 -0
- {d3blocks-2.2.0 → d3blocks-2.2.1}/d3blocks/violin/d3js/__init__.py +0 -0
- {d3blocks-2.2.0 → d3blocks-2.2.1}/d3blocks/violin/d3js/d3-scale-chromatic.v1.min.js +0 -0
- {d3blocks-2.2.0 → d3blocks-2.2.1}/d3blocks/violin/d3js/d3.v4.min.js +0 -0
- {d3blocks-2.2.0 → d3blocks-2.2.1}/d3blocks/violin/d3js/violin.css +0 -0
- {d3blocks-2.2.0 → d3blocks-2.2.1}/d3blocks/violin/d3js/violin.html.j2 +0 -0
- {d3blocks-2.2.0 → d3blocks-2.2.1}/d3blocks.egg-info/SOURCES.txt +0 -0
- {d3blocks-2.2.0 → d3blocks-2.2.1}/d3blocks.egg-info/dependency_links.txt +0 -0
- {d3blocks-2.2.0 → d3blocks-2.2.1}/d3blocks.egg-info/entry_points.txt +0 -0
- {d3blocks-2.2.0 → d3blocks-2.2.1}/d3blocks.egg-info/requires.txt +0 -0
- {d3blocks-2.2.0 → d3blocks-2.2.1}/d3blocks.egg-info/top_level.txt +0 -0
- {d3blocks-2.2.0 → d3blocks-2.2.1}/pyproject.toml +0 -0
- {d3blocks-2.2.0 → d3blocks-2.2.1}/setup.cfg +0 -0
d3blocks-2.2.1/PKG-INFO
ADDED
|
@@ -0,0 +1,159 @@
|
|
|
1
|
+
Metadata-Version: 2.4
|
|
2
|
+
Name: d3blocks
|
|
3
|
+
Version: 2.2.1
|
|
4
|
+
Summary: Python package d3blocks.
|
|
5
|
+
Author-email: Erdogan Taskesen <erdogant@gmail.com>
|
|
6
|
+
License-Expression: GPL-3.0-or-later
|
|
7
|
+
Project-URL: Homepage, https://erdogant.github.io/d3blocks
|
|
8
|
+
Project-URL: Download, https://github.com/erdogant/d3blocks/archive/{version}.tar.gz
|
|
9
|
+
Keywords: Python,visualizations,interactive,javascript,d3js,d3blocks,network,graph,data visualization,web,extendable,extension,plugin,modular,customizable
|
|
10
|
+
Classifier: Programming Language :: Python :: 3
|
|
11
|
+
Classifier: Operating System :: OS Independent
|
|
12
|
+
Classifier: Intended Audience :: Education
|
|
13
|
+
Classifier: Intended Audience :: Science/Research
|
|
14
|
+
Classifier: Operating System :: Unix
|
|
15
|
+
Classifier: Operating System :: Microsoft :: Windows
|
|
16
|
+
Classifier: Operating System :: MacOS
|
|
17
|
+
Requires-Python: >=3
|
|
18
|
+
Description-Content-Type: text/markdown
|
|
19
|
+
License-File: LICENSE
|
|
20
|
+
Requires-Dist: numpy
|
|
21
|
+
Requires-Dist: colourmap>=1.1.10
|
|
22
|
+
Requires-Dist: datazets>=0.1.7
|
|
23
|
+
Requires-Dist: d3graph>=3.2.0
|
|
24
|
+
Requires-Dist: ismember>=1.0.1
|
|
25
|
+
Requires-Dist: pandas
|
|
26
|
+
Requires-Dist: tqdm
|
|
27
|
+
Requires-Dist: requests
|
|
28
|
+
Requires-Dist: jinja2
|
|
29
|
+
Requires-Dist: scikit-learn
|
|
30
|
+
Dynamic: license-file
|
|
31
|
+
|
|
32
|
+
[](https://img.shields.io/pypi/pyversions/d3blocks)
|
|
33
|
+
[](https://pypi.org/project/d3blocks/)
|
|
34
|
+
[](https://d3blocks.github.io/d3blocks/)
|
|
35
|
+
[](https://github.com/d3blocks/d3blocks/)
|
|
36
|
+
[](https://pepy.tech/project/d3blocks)
|
|
37
|
+
[](https://pepy.tech/project/d3blocks)
|
|
38
|
+
[](https://github.com/d3blocks/d3blocks/blob/master/LICENSE)
|
|
39
|
+
[](https://github.com/d3blocks/d3blocks/network)
|
|
40
|
+
[](https://github.com/d3blocks/d3blocks/issues)
|
|
41
|
+
[](http://www.repostatus.org/#active)
|
|
42
|
+
[](https://d3blocks.github.io/d3blocks/Documentation.html#medium-blog)
|
|
43
|
+

|
|
44
|
+

|
|
45
|
+
[](https://github.com/d3blocks/d3blocks/blob/main/notebooks/d3blocks.ipynb)
|
|
46
|
+
[](https://d3blocks.github.io/d3blocks/Documentation.html#)
|
|
47
|
+
|
|
48
|
+
###
|
|
49
|
+
|
|
50
|
+
<div>
|
|
51
|
+
|
|
52
|
+
<a href="https://d3blocks.github.io/d3blocks/"><img src="https://github.com/d3blocks/d3blocks/blob/main/logo.png" width="275" align="left" /></a>
|
|
53
|
+
``D3Blocks`` is a Python package that builds on the graphics of d3 javascript (d3js). It allows you to create the most visually attractive and useful charts with only a few lines of Python code!
|
|
54
|
+
The [documentation pages](https://d3blocks.github.io/d3blocks/) contain detailed information about the working of the blocks with many examples. **⭐️ Star it if you like it ⭐️**
|
|
55
|
+
</div>
|
|
56
|
+
|
|
57
|
+
---
|
|
58
|
+
|
|
59
|
+
<p align="center">
|
|
60
|
+
<a href="https://d3blocks.github.io/d3blocks">
|
|
61
|
+
<img src="https://github.com/d3blocks/d3blocks/blob/main/docs/figs/summary.png" width="600" />
|
|
62
|
+
</a>
|
|
63
|
+
</p>
|
|
64
|
+
|
|
65
|
+
---
|
|
66
|
+
|
|
67
|
+
### Resources and Links
|
|
68
|
+
- [**Example Notebooks**](https://d3blocks.github.io/d3blocks/Documentation.html#google-colab-notebooks)
|
|
69
|
+
- [**Documentation**](https://d3blocks.github.io/d3blocks)
|
|
70
|
+
- [**Bug Reports and Feature Requests**](https://github.com/d3blocks/d3blocks/issues)
|
|
71
|
+
|
|
72
|
+
### Blogs
|
|
73
|
+
- [**Medium Blog**](https://medium.com/data-science-collective/d3blocks-the-sweet-spot-for-data-scientists-interactive-charts-without-deployment-friction-c7f576025510)
|
|
74
|
+
- [**Substack with podcast**](https://erdogant.substack.com/p/d3blocks-the-python-library-to-create)
|
|
75
|
+
- [**Gumroad Blogs with podcast**](https://erdogant.gumroad.com/l/d3blocks-the-python-library-to-create-interactive-standalone-and-beautiful-d3-js-charts)
|
|
76
|
+
|
|
77
|
+
-------------------------------------------------------------------------
|
|
78
|
+
### [Available charts](https://d3blocks.github.io/d3blocks/)
|
|
79
|
+
|
|
80
|
+
|
|
81
|
+
| nr | Block | Function | More Information |
|
|
82
|
+
|-----|------------------------------------------------------------------------------------|------------------------------|-------------------------------------------------------------------------|
|
|
83
|
+
| 1 | [D3graph](https://d3blocks.github.io/d3blocks/d3graph.html) | ``` d3.d3graph() ``` | [D3graph](https://medium.com/data-science-collective/how-to-turn-any-network-into-an-interactive-knowledge-graph-to-discover-hidden-insights-f49fae4757ff) |
|
|
84
|
+
| 2 | [Radialgraph](https://d3blocks.github.io/d3blocks/Radialgraph.html) | ``` d3.radialgraph() ``` | [Radialgraph](https://medium.com/data-science-collective/radialgraph-a-new-way-to-explore-large-networks-without-the-hairball-ea34193ddec9) |
|
|
85
|
+
| 3 | [Elasticgraph](https://d3blocks.github.io/d3blocks/elasticgraph.html) | ``` d3.elasticgraph() ``` | [D3Blocks](https://medium.com/data-science-collective/d3blocks-the-sweet-spot-for-data-scientists-interactive-charts-without-deployment-friction-c7f576025510) |
|
|
86
|
+
| 4 | [Sankey](https://d3blocks.github.io/d3blocks/Sankey.html) | ``` d3.sankey() ``` | [D3Blocks](https://medium.com/data-science-collective/d3blocks-the-sweet-spot-for-data-scientists-interactive-charts-without-deployment-friction-c7f576025510) |
|
|
87
|
+
| 5 | [Movingbubbles](https://d3blocks.github.io/d3blocks/MovingBubbles.html) | ``` d3.movingbubbles() ``` | [D3Blocks](https://medium.com/data-science-collective/d3blocks-the-sweet-spot-for-data-scientists-interactive-charts-without-deployment-friction-c7f576025510) |
|
|
88
|
+
| 6 | [Scatter](https://d3blocks.github.io/d3blocks/Scatter.html) | ``` d3.scatter() ``` | [D3Blocks](https://medium.com/data-science-collective/d3blocks-the-sweet-spot-for-data-scientists-interactive-charts-without-deployment-friction-c7f576025510) |
|
|
89
|
+
| 7 | [Heatmap](https://d3blocks.github.io/d3blocks/Heatmap.html) | ``` d3.heatmap() ``` | [D3Blocks](https://medium.com/data-science-collective/d3blocks-the-sweet-spot-for-data-scientists-interactive-charts-without-deployment-friction-c7f576025510) |
|
|
90
|
+
| 8 | [Chord diagram](https://d3blocks.github.io/d3blocks/Chord.html) | ``` d3.chord() ``` | [D3Blocks](https://medium.com/data-science-collective/d3blocks-the-sweet-spot-for-data-scientists-interactive-charts-without-deployment-friction-c7f576025510) |
|
|
91
|
+
| 9 | [Timeseries](https://d3blocks.github.io/d3blocks/Timeseries.html) | ``` d3.timeseries() ``` | [D3Blocks](https://medium.com/data-science-collective/d3blocks-the-sweet-spot-for-data-scientists-interactive-charts-without-deployment-friction-c7f576025510) |
|
|
92
|
+
| 10 | [Image slider](https://d3blocks.github.io/d3blocks/Imageslider.html) | ``` d3.imageslider() ``` | [D3Blocks](https://medium.com/data-science-collective/d3blocks-the-sweet-spot-for-data-scientists-interactive-charts-without-deployment-friction-c7f576025510) |
|
|
93
|
+
| 11 | [Violin plot](https://d3blocks.github.io/d3blocks/Violin.html) | ``` d3.violin() ``` | [D3Blocks](https://medium.com/data-science-collective/d3blocks-the-sweet-spot-for-data-scientists-interactive-charts-without-deployment-friction-c7f576025510) |
|
|
94
|
+
| 12 | [Particles](https://d3blocks.github.io/d3blocks/Particles.html) | ``` d3.particles() ``` | [D3Blocks](https://medium.com/data-science-collective/d3blocks-the-sweet-spot-for-data-scientists-interactive-charts-without-deployment-friction-c7f576025510) |
|
|
95
|
+
| 13 | [Treemap](https://d3blocks.github.io/d3blocks/Treemap.html) | ``` d3.treemap() ``` | [D3Blocks](https://medium.com/data-science-collective/d3blocks-the-sweet-spot-for-data-scientists-interactive-charts-without-deployment-friction-c7f576025510) |
|
|
96
|
+
| 14 | [Tree](https://d3blocks.github.io/d3blocks/Tree.html) | ``` d3.tree() ``` | [D3Blocks](https://medium.com/data-science-collective/d3blocks-the-sweet-spot-for-data-scientists-interactive-charts-without-deployment-friction-c7f576025510) |
|
|
97
|
+
| 15 | [Maps](https://d3blocks.github.io/d3blocks/Maps.html) | ``` d3.maps() ``` | [D3Blocks](https://medium.com/data-science-collective/d3blocks-the-sweet-spot-for-data-scientists-interactive-charts-without-deployment-friction-c7f576025510) |
|
|
98
|
+
| 16 | [Circlepacking](https://d3blocks.github.io/d3blocks/Circlepacking.html) | ``` d3.circlepacking() ``` | [D3Blocks](https://medium.com/data-science-collective/d3blocks-the-sweet-spot-for-data-scientists-interactive-charts-without-deployment-friction-c7f576025510) |
|
|
99
|
+
| 17 | [Flowgraph](https://d3blocks.github.io/d3blocks/Flowgraph.html) | ``` d3.flowgraph() ``` | [Dagre](https://github.com/dagrejs/dagre) |
|
|
100
|
+
|
|
101
|
+
-------------------------------------------------------------------------
|
|
102
|
+
|
|
103
|
+
#### Installation (Pypi)
|
|
104
|
+
```bash
|
|
105
|
+
pip install d3blocks # Normal installation
|
|
106
|
+
pip install -U d3blocks # Force update
|
|
107
|
+
```
|
|
108
|
+
|
|
109
|
+
#### Installation (clone)
|
|
110
|
+
```bash
|
|
111
|
+
git clone https://github.com/d3blocks/d3blocks.git
|
|
112
|
+
cd d3blocks
|
|
113
|
+
pip install -U .
|
|
114
|
+
```
|
|
115
|
+
|
|
116
|
+
#### Import d3blocks package
|
|
117
|
+
```python
|
|
118
|
+
from d3blocks import D3Blocks
|
|
119
|
+
# Initialize
|
|
120
|
+
d3 = D3Blocks()
|
|
121
|
+
```
|
|
122
|
+
|
|
123
|
+
|
|
124
|
+
---
|
|
125
|
+
|
|
126
|
+
### D3Blocks💙Streamlit
|
|
127
|
+
Every chart from D3Block can easily be incorporated into a Streamlit Dashboard. Because every D3Blocks chart is just HTML and JavaScript, you can generate the HTML in memory and embed it
|
|
128
|
+
A few practical rules of thumb: prefer `st.iframe` over the older `components.html` for full interactive charts, always pass an explicit pixel height, and set `show_side_panel=False` when Streamlit already owns the controls so the UI doesn't duplicate. `color_background='streamlit'` picks backgrounds that match a typical Streamlit light or dark page.
|
|
129
|
+
|
|
130
|
+
* [Minimal examples for each chart can be found in the Streamlit directory in the repo](https://github.com/d3blocks/d3blocks/tree/main/streamlit).
|
|
131
|
+
* [More Streamlit documentation can be found here.](https://d3blocks.github.io/d3blocks/Streamlit.html)
|
|
132
|
+
|
|
133
|
+
---
|
|
134
|
+
|
|
135
|
+
### Ethical Ads
|
|
136
|
+
When HTMLs are generated, it automatically includes ethical ads as a small way to support development.
|
|
137
|
+
I maintain this entire project thoughtfully and in my free time. Ads can be disabled via an input parameter, and you can also support the project with a coffee donation instead.
|
|
138
|
+
|
|
139
|
+
### Star history
|
|
140
|
+
[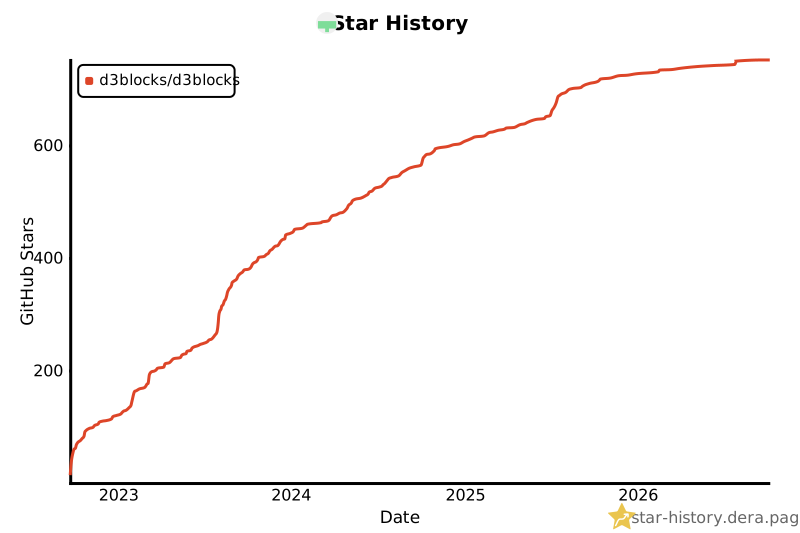](https://star-history.dera.page/d3blocks/d3blocks)
|
|
141
|
+
|
|
142
|
+
### References
|
|
143
|
+
* [bl.ocks](https://bl.ocks.org/)
|
|
144
|
+
* [observablehq](https://observablehq.com/top)
|
|
145
|
+
|
|
146
|
+
### Contributors
|
|
147
|
+
|
|
148
|
+
<p align="left">
|
|
149
|
+
<a href="https://github.com/d3blocks/d3blocks/graphs/contributors">
|
|
150
|
+
<img src="https://contrib.rocks/image?repo=d3blocks/d3blocks" />
|
|
151
|
+
</a>
|
|
152
|
+
</p>
|
|
153
|
+
|
|
154
|
+
### Maintainer
|
|
155
|
+
* Erdogan Taskesen, github: [erdogant](https://github.com/erdogant)
|
|
156
|
+
* Contributions are welcome.
|
|
157
|
+
* Yes! This library is entirely **free** but it runs on coffee! :) Feel free to support with a <a href="https://erdogant.github.io/donate/?currency=USD&amount=5">Coffee</a>.
|
|
158
|
+
|
|
159
|
+
[](https://www.buymeacoffee.com/erdogant)
|
d3blocks-2.2.1/README.md
ADDED
|
@@ -0,0 +1,128 @@
|
|
|
1
|
+
[](https://img.shields.io/pypi/pyversions/d3blocks)
|
|
2
|
+
[](https://pypi.org/project/d3blocks/)
|
|
3
|
+
[](https://d3blocks.github.io/d3blocks/)
|
|
4
|
+
[](https://github.com/d3blocks/d3blocks/)
|
|
5
|
+
[](https://pepy.tech/project/d3blocks)
|
|
6
|
+
[](https://pepy.tech/project/d3blocks)
|
|
7
|
+
[](https://github.com/d3blocks/d3blocks/blob/master/LICENSE)
|
|
8
|
+
[](https://github.com/d3blocks/d3blocks/network)
|
|
9
|
+
[](https://github.com/d3blocks/d3blocks/issues)
|
|
10
|
+
[](http://www.repostatus.org/#active)
|
|
11
|
+
[](https://d3blocks.github.io/d3blocks/Documentation.html#medium-blog)
|
|
12
|
+

|
|
13
|
+

|
|
14
|
+
[](https://github.com/d3blocks/d3blocks/blob/main/notebooks/d3blocks.ipynb)
|
|
15
|
+
[](https://d3blocks.github.io/d3blocks/Documentation.html#)
|
|
16
|
+
|
|
17
|
+
###
|
|
18
|
+
|
|
19
|
+
<div>
|
|
20
|
+
|
|
21
|
+
<a href="https://d3blocks.github.io/d3blocks/"><img src="https://github.com/d3blocks/d3blocks/blob/main/logo.png" width="275" align="left" /></a>
|
|
22
|
+
``D3Blocks`` is a Python package that builds on the graphics of d3 javascript (d3js). It allows you to create the most visually attractive and useful charts with only a few lines of Python code!
|
|
23
|
+
The [documentation pages](https://d3blocks.github.io/d3blocks/) contain detailed information about the working of the blocks with many examples. **⭐️ Star it if you like it ⭐️**
|
|
24
|
+
</div>
|
|
25
|
+
|
|
26
|
+
---
|
|
27
|
+
|
|
28
|
+
<p align="center">
|
|
29
|
+
<a href="https://d3blocks.github.io/d3blocks">
|
|
30
|
+
<img src="https://github.com/d3blocks/d3blocks/blob/main/docs/figs/summary.png" width="600" />
|
|
31
|
+
</a>
|
|
32
|
+
</p>
|
|
33
|
+
|
|
34
|
+
---
|
|
35
|
+
|
|
36
|
+
### Resources and Links
|
|
37
|
+
- [**Example Notebooks**](https://d3blocks.github.io/d3blocks/Documentation.html#google-colab-notebooks)
|
|
38
|
+
- [**Documentation**](https://d3blocks.github.io/d3blocks)
|
|
39
|
+
- [**Bug Reports and Feature Requests**](https://github.com/d3blocks/d3blocks/issues)
|
|
40
|
+
|
|
41
|
+
### Blogs
|
|
42
|
+
- [**Medium Blog**](https://medium.com/data-science-collective/d3blocks-the-sweet-spot-for-data-scientists-interactive-charts-without-deployment-friction-c7f576025510)
|
|
43
|
+
- [**Substack with podcast**](https://erdogant.substack.com/p/d3blocks-the-python-library-to-create)
|
|
44
|
+
- [**Gumroad Blogs with podcast**](https://erdogant.gumroad.com/l/d3blocks-the-python-library-to-create-interactive-standalone-and-beautiful-d3-js-charts)
|
|
45
|
+
|
|
46
|
+
-------------------------------------------------------------------------
|
|
47
|
+
### [Available charts](https://d3blocks.github.io/d3blocks/)
|
|
48
|
+
|
|
49
|
+
|
|
50
|
+
| nr | Block | Function | More Information |
|
|
51
|
+
|-----|------------------------------------------------------------------------------------|------------------------------|-------------------------------------------------------------------------|
|
|
52
|
+
| 1 | [D3graph](https://d3blocks.github.io/d3blocks/d3graph.html) | ``` d3.d3graph() ``` | [D3graph](https://medium.com/data-science-collective/how-to-turn-any-network-into-an-interactive-knowledge-graph-to-discover-hidden-insights-f49fae4757ff) |
|
|
53
|
+
| 2 | [Radialgraph](https://d3blocks.github.io/d3blocks/Radialgraph.html) | ``` d3.radialgraph() ``` | [Radialgraph](https://medium.com/data-science-collective/radialgraph-a-new-way-to-explore-large-networks-without-the-hairball-ea34193ddec9) |
|
|
54
|
+
| 3 | [Elasticgraph](https://d3blocks.github.io/d3blocks/elasticgraph.html) | ``` d3.elasticgraph() ``` | [D3Blocks](https://medium.com/data-science-collective/d3blocks-the-sweet-spot-for-data-scientists-interactive-charts-without-deployment-friction-c7f576025510) |
|
|
55
|
+
| 4 | [Sankey](https://d3blocks.github.io/d3blocks/Sankey.html) | ``` d3.sankey() ``` | [D3Blocks](https://medium.com/data-science-collective/d3blocks-the-sweet-spot-for-data-scientists-interactive-charts-without-deployment-friction-c7f576025510) |
|
|
56
|
+
| 5 | [Movingbubbles](https://d3blocks.github.io/d3blocks/MovingBubbles.html) | ``` d3.movingbubbles() ``` | [D3Blocks](https://medium.com/data-science-collective/d3blocks-the-sweet-spot-for-data-scientists-interactive-charts-without-deployment-friction-c7f576025510) |
|
|
57
|
+
| 6 | [Scatter](https://d3blocks.github.io/d3blocks/Scatter.html) | ``` d3.scatter() ``` | [D3Blocks](https://medium.com/data-science-collective/d3blocks-the-sweet-spot-for-data-scientists-interactive-charts-without-deployment-friction-c7f576025510) |
|
|
58
|
+
| 7 | [Heatmap](https://d3blocks.github.io/d3blocks/Heatmap.html) | ``` d3.heatmap() ``` | [D3Blocks](https://medium.com/data-science-collective/d3blocks-the-sweet-spot-for-data-scientists-interactive-charts-without-deployment-friction-c7f576025510) |
|
|
59
|
+
| 8 | [Chord diagram](https://d3blocks.github.io/d3blocks/Chord.html) | ``` d3.chord() ``` | [D3Blocks](https://medium.com/data-science-collective/d3blocks-the-sweet-spot-for-data-scientists-interactive-charts-without-deployment-friction-c7f576025510) |
|
|
60
|
+
| 9 | [Timeseries](https://d3blocks.github.io/d3blocks/Timeseries.html) | ``` d3.timeseries() ``` | [D3Blocks](https://medium.com/data-science-collective/d3blocks-the-sweet-spot-for-data-scientists-interactive-charts-without-deployment-friction-c7f576025510) |
|
|
61
|
+
| 10 | [Image slider](https://d3blocks.github.io/d3blocks/Imageslider.html) | ``` d3.imageslider() ``` | [D3Blocks](https://medium.com/data-science-collective/d3blocks-the-sweet-spot-for-data-scientists-interactive-charts-without-deployment-friction-c7f576025510) |
|
|
62
|
+
| 11 | [Violin plot](https://d3blocks.github.io/d3blocks/Violin.html) | ``` d3.violin() ``` | [D3Blocks](https://medium.com/data-science-collective/d3blocks-the-sweet-spot-for-data-scientists-interactive-charts-without-deployment-friction-c7f576025510) |
|
|
63
|
+
| 12 | [Particles](https://d3blocks.github.io/d3blocks/Particles.html) | ``` d3.particles() ``` | [D3Blocks](https://medium.com/data-science-collective/d3blocks-the-sweet-spot-for-data-scientists-interactive-charts-without-deployment-friction-c7f576025510) |
|
|
64
|
+
| 13 | [Treemap](https://d3blocks.github.io/d3blocks/Treemap.html) | ``` d3.treemap() ``` | [D3Blocks](https://medium.com/data-science-collective/d3blocks-the-sweet-spot-for-data-scientists-interactive-charts-without-deployment-friction-c7f576025510) |
|
|
65
|
+
| 14 | [Tree](https://d3blocks.github.io/d3blocks/Tree.html) | ``` d3.tree() ``` | [D3Blocks](https://medium.com/data-science-collective/d3blocks-the-sweet-spot-for-data-scientists-interactive-charts-without-deployment-friction-c7f576025510) |
|
|
66
|
+
| 15 | [Maps](https://d3blocks.github.io/d3blocks/Maps.html) | ``` d3.maps() ``` | [D3Blocks](https://medium.com/data-science-collective/d3blocks-the-sweet-spot-for-data-scientists-interactive-charts-without-deployment-friction-c7f576025510) |
|
|
67
|
+
| 16 | [Circlepacking](https://d3blocks.github.io/d3blocks/Circlepacking.html) | ``` d3.circlepacking() ``` | [D3Blocks](https://medium.com/data-science-collective/d3blocks-the-sweet-spot-for-data-scientists-interactive-charts-without-deployment-friction-c7f576025510) |
|
|
68
|
+
| 17 | [Flowgraph](https://d3blocks.github.io/d3blocks/Flowgraph.html) | ``` d3.flowgraph() ``` | [Dagre](https://github.com/dagrejs/dagre) |
|
|
69
|
+
|
|
70
|
+
-------------------------------------------------------------------------
|
|
71
|
+
|
|
72
|
+
#### Installation (Pypi)
|
|
73
|
+
```bash
|
|
74
|
+
pip install d3blocks # Normal installation
|
|
75
|
+
pip install -U d3blocks # Force update
|
|
76
|
+
```
|
|
77
|
+
|
|
78
|
+
#### Installation (clone)
|
|
79
|
+
```bash
|
|
80
|
+
git clone https://github.com/d3blocks/d3blocks.git
|
|
81
|
+
cd d3blocks
|
|
82
|
+
pip install -U .
|
|
83
|
+
```
|
|
84
|
+
|
|
85
|
+
#### Import d3blocks package
|
|
86
|
+
```python
|
|
87
|
+
from d3blocks import D3Blocks
|
|
88
|
+
# Initialize
|
|
89
|
+
d3 = D3Blocks()
|
|
90
|
+
```
|
|
91
|
+
|
|
92
|
+
|
|
93
|
+
---
|
|
94
|
+
|
|
95
|
+
### D3Blocks💙Streamlit
|
|
96
|
+
Every chart from D3Block can easily be incorporated into a Streamlit Dashboard. Because every D3Blocks chart is just HTML and JavaScript, you can generate the HTML in memory and embed it
|
|
97
|
+
A few practical rules of thumb: prefer `st.iframe` over the older `components.html` for full interactive charts, always pass an explicit pixel height, and set `show_side_panel=False` when Streamlit already owns the controls so the UI doesn't duplicate. `color_background='streamlit'` picks backgrounds that match a typical Streamlit light or dark page.
|
|
98
|
+
|
|
99
|
+
* [Minimal examples for each chart can be found in the Streamlit directory in the repo](https://github.com/d3blocks/d3blocks/tree/main/streamlit).
|
|
100
|
+
* [More Streamlit documentation can be found here.](https://d3blocks.github.io/d3blocks/Streamlit.html)
|
|
101
|
+
|
|
102
|
+
---
|
|
103
|
+
|
|
104
|
+
### Ethical Ads
|
|
105
|
+
When HTMLs are generated, it automatically includes ethical ads as a small way to support development.
|
|
106
|
+
I maintain this entire project thoughtfully and in my free time. Ads can be disabled via an input parameter, and you can also support the project with a coffee donation instead.
|
|
107
|
+
|
|
108
|
+
### Star history
|
|
109
|
+
[](https://star-history.dera.page/d3blocks/d3blocks)
|
|
110
|
+
|
|
111
|
+
### References
|
|
112
|
+
* [bl.ocks](https://bl.ocks.org/)
|
|
113
|
+
* [observablehq](https://observablehq.com/top)
|
|
114
|
+
|
|
115
|
+
### Contributors
|
|
116
|
+
|
|
117
|
+
<p align="left">
|
|
118
|
+
<a href="https://github.com/d3blocks/d3blocks/graphs/contributors">
|
|
119
|
+
<img src="https://contrib.rocks/image?repo=d3blocks/d3blocks" />
|
|
120
|
+
</a>
|
|
121
|
+
</p>
|
|
122
|
+
|
|
123
|
+
### Maintainer
|
|
124
|
+
* Erdogan Taskesen, github: [erdogant](https://github.com/erdogant)
|
|
125
|
+
* Contributions are welcome.
|
|
126
|
+
* Yes! This library is entirely **free** but it runs on coffee! :) Feel free to support with a <a href="https://erdogant.github.io/donate/?currency=USD&amount=5">Coffee</a>.
|
|
127
|
+
|
|
128
|
+
[](https://www.buymeacoffee.com/erdogant)
|
|
@@ -1,3 +1,42 @@
|
|
|
1
|
+
# %% Flowgraph
|
|
2
|
+
|
|
3
|
+
# Edge list with shapes and edge labels
|
|
4
|
+
from d3blocks import D3Blocks
|
|
5
|
+
import pandas as pd
|
|
6
|
+
|
|
7
|
+
d3 = D3Blocks(frame=False)
|
|
8
|
+
df = pd.DataFrame({'source': ['Start', 'Valid?', 'Valid?', 'Fix'],
|
|
9
|
+
'target': ['Valid?', 'Done', 'Fix', 'Valid?'],
|
|
10
|
+
'label': ['', 'yes', 'no', 'retry']})
|
|
11
|
+
|
|
12
|
+
nodes = {'Start': {'shape': 'terminal'}, 'Valid?': {'shape': 'decision'},
|
|
13
|
+
'Done': {'shape': 'terminal'}}
|
|
14
|
+
|
|
15
|
+
# Set the flowgraph
|
|
16
|
+
d3.flowgraph(df, nodes=nodes, direction='TB', showfig=True)
|
|
17
|
+
|
|
18
|
+
# Change a node and redraw
|
|
19
|
+
d3.node_properties['Fix']['color'] = '#e15759'
|
|
20
|
+
d3.show(showfig=True)
|
|
21
|
+
|
|
22
|
+
# %%
|
|
23
|
+
|
|
24
|
+
|
|
25
|
+
# Mermaid diagram kept in a Markdown file (renders on GitHub too)
|
|
26
|
+
d3.flowgraph('docs/process.md')
|
|
27
|
+
|
|
28
|
+
# Mermaid flowchart with a subgraph, laid out with ELK
|
|
29
|
+
d3.flowgraph('''
|
|
30
|
+
flowchart LR
|
|
31
|
+
subgraph api [API]
|
|
32
|
+
gw[Gateway] --> svc[Orders]
|
|
33
|
+
end
|
|
34
|
+
svc --> db[(Postgres)]
|
|
35
|
+
svc -.->|events| q[[Worker]]
|
|
36
|
+
''', layout='elk')
|
|
37
|
+
|
|
38
|
+
|
|
39
|
+
# %% imageslider
|
|
1
40
|
from d3blocks import D3Blocks
|
|
2
41
|
d3 = D3Blocks()
|
|
3
42
|
img_before, img_after = d3.import_example('southern_nebula_internet')
|
|
@@ -80,13 +119,13 @@ from d3blocks import D3Blocks
|
|
|
80
119
|
# Initialize
|
|
81
120
|
d3 = D3Blocks()
|
|
82
121
|
|
|
83
|
-
df = d3.import_example('
|
|
84
|
-
|
|
122
|
+
df = d3.import_example('socialmedia')
|
|
123
|
+
df = df[0:200]
|
|
85
124
|
# Create the chart
|
|
86
125
|
d3.heatmap(
|
|
87
126
|
df=df,
|
|
88
|
-
show_side_panel=
|
|
89
|
-
show_top_panel=
|
|
127
|
+
show_side_panel=True,
|
|
128
|
+
show_top_panel=True,
|
|
90
129
|
dark_mode=True,
|
|
91
130
|
# color_background='streamlit',
|
|
92
131
|
)
|
|
@@ -33,7 +33,7 @@ def set_config(config={}, **kwargs):
|
|
|
33
33
|
config['stroke'] = kwargs.get('stroke', 'red')
|
|
34
34
|
config['notebook'] = kwargs.get('notebook', False)
|
|
35
35
|
config['reset_properties'] = kwargs.get('reset_properties', True)
|
|
36
|
-
config['cmap'] = kwargs.get('cmap', '
|
|
36
|
+
config['cmap'] = kwargs.get('cmap', 'tableau')
|
|
37
37
|
config['cluster_params'] = kwargs.get('cluster_params', {})
|
|
38
38
|
config['scale'] = kwargs.get('scale', False)
|
|
39
39
|
config['fontsize'] = kwargs.get('fontsize', 10)
|
|
@@ -149,6 +149,59 @@ def set_node_properties(df, **kwargs):
|
|
|
149
149
|
return dict_labels
|
|
150
150
|
|
|
151
151
|
|
|
152
|
+
_NOISE_COLOR = '#8a8f9c'
|
|
153
|
+
_TABLEAU10 = ['#4e79a7', '#f28e2b', '#e15759', '#76b7b2', '#59a14f',
|
|
154
|
+
'#edc948', '#b07aa1', '#ff9da7', '#9c755f', '#bab0ac']
|
|
155
|
+
_OLD_QUALITATIVE_DEFAULTS = (None, 'tableau', 'Set1', 'Set2')
|
|
156
|
+
|
|
157
|
+
|
|
158
|
+
def _cluster_palette(n, cmap=None):
|
|
159
|
+
"""Return n visually distinct hex colors (one per cluster).
|
|
160
|
+
|
|
161
|
+
The old approach sampled 8-9 color qualitative colormaps through a 0..1
|
|
162
|
+
normalisation, which produced duplicate colors for >8 clusters and always
|
|
163
|
+
ended on gray. Here every cluster gets its own entry.
|
|
164
|
+
"""
|
|
165
|
+
import colorsys
|
|
166
|
+
if cmap in _OLD_QUALITATIVE_DEFAULTS:
|
|
167
|
+
if n <= len(_TABLEAU10):
|
|
168
|
+
return _TABLEAU10[:n]
|
|
169
|
+
# More clusters than the base palette: spread hues, alternate lightness
|
|
170
|
+
cols = list(_TABLEAU10)
|
|
171
|
+
extra = n - len(cols)
|
|
172
|
+
for i in range(extra):
|
|
173
|
+
h = (i * 0.618033988749895) % 1.0 # golden-angle hue spacing
|
|
174
|
+
l = 0.55 if i % 2 == 0 else 0.42
|
|
175
|
+
r, g, b = colorsys.hls_to_rgb(h, l, 0.65)
|
|
176
|
+
cols.append('#%02x%02x%02x' % (int(r * 255), int(g * 255), int(b * 255)))
|
|
177
|
+
return cols
|
|
178
|
+
# User supplied a matplotlib colormap: use its discrete colors if it has enough, else sample evenly
|
|
179
|
+
import matplotlib
|
|
180
|
+
from matplotlib.colors import ListedColormap, to_hex
|
|
181
|
+
cm = matplotlib.colormaps[cmap]
|
|
182
|
+
if isinstance(cm, ListedColormap) and cm.N >= n and cm.N <= 20:
|
|
183
|
+
return [to_hex(cm.colors[i]) for i in range(n)]
|
|
184
|
+
return [to_hex(cm(v)) for v in np.linspace(0, 1, max(n, 2))[:n]]
|
|
185
|
+
|
|
186
|
+
|
|
187
|
+
def _color_from_labels(labels, cmap):
|
|
188
|
+
"""Map arbitrary cluster labels to (consecutive int labels, hex colors). Label -1 (noise) is gray."""
|
|
189
|
+
labels = np.asarray(labels)
|
|
190
|
+
uni = [u for u in np.unique(labels) if u != -1]
|
|
191
|
+
palette = _cluster_palette(len(uni), cmap)
|
|
192
|
+
lut = {int(u): palette[i] for i, u in enumerate(uni)}
|
|
193
|
+
lut[-1] = _NOISE_COLOR
|
|
194
|
+
colors = [lut[int(x)] for x in labels]
|
|
195
|
+
return [int(x) for x in labels], colors
|
|
196
|
+
|
|
197
|
+
|
|
198
|
+
def _log(logger, level, msg):
|
|
199
|
+
if logger is not None:
|
|
200
|
+
getattr(logger, level)(msg)
|
|
201
|
+
else:
|
|
202
|
+
print('[%s] %s' % (level, msg))
|
|
203
|
+
|
|
204
|
+
|
|
152
205
|
def set_colors(df, **kwargs):
|
|
153
206
|
"""Color in clusterlabel.
|
|
154
207
|
|
|
@@ -162,60 +215,56 @@ def set_colors(df, **kwargs):
|
|
|
162
215
|
config = kwargs.get('config')
|
|
163
216
|
node_properties = kwargs.get('node_properties')
|
|
164
217
|
|
|
165
|
-
# d3network.vec2adjmat(source, target, weight=weight, symmetric=symmetric, aggfunc=aggfunc)
|
|
166
|
-
if df.get('weight', None) is not None:
|
|
167
|
-
df = df.copy()
|
|
168
|
-
df['weight'] = normalize(df['weight'].values, scaler=config['scaler'])
|
|
169
|
-
adjmat = vec2adjmat(source=df['source'], target=df['target'], weight=df.get('weight', None).values, symmetric=True)
|
|
170
|
-
|
|
171
218
|
# Default is all cluster labels are the same
|
|
172
|
-
# Convert NumPy integers to regular Python integers for proper JSON serialization
|
|
173
219
|
node_properties['classlabel'] = [0] * node_properties.shape[0]
|
|
174
220
|
node_properties['color'] = '#000000'
|
|
175
221
|
|
|
176
|
-
if isinstance(config.get('color'), str) and config.get('color')=='cluster':
|
|
177
|
-
# Cluster the nodes
|
|
222
|
+
if isinstance(config.get('color'), str) and config.get('color') == 'cluster':
|
|
178
223
|
try:
|
|
179
224
|
from clusteval import clusteval
|
|
180
225
|
except Exception:
|
|
181
|
-
|
|
182
|
-
logger.warning('clusteval is not installed; skipping clustering and using default colors. Tip: pip install clusteval')
|
|
183
|
-
else:
|
|
184
|
-
print('Warning: clusteval is not installed; skipping clustering and using default colors. Tip: pip install clusteval')
|
|
226
|
+
_log(logger, 'warning', 'clusteval is not installed; skipping clustering and using default colors. Tip: pip install clusteval')
|
|
185
227
|
return node_properties
|
|
186
|
-
|
|
187
|
-
|
|
188
|
-
|
|
228
|
+
|
|
229
|
+
# Cluster on the RAW weights. Z-scoring first turned "no link" (0) into an
|
|
230
|
+
# "average link" and distorted the row profiles that are being clustered.
|
|
231
|
+
weight = df['weight'].values if df.get('weight', None) is not None else np.ones(df.shape[0])
|
|
232
|
+
adjmat = vec2adjmat(source=df['source'], target=df['target'], weight=weight, symmetric=True)
|
|
233
|
+
adjmat = adjmat.fillna(0)
|
|
234
|
+
|
|
235
|
+
# Do not mutate the (possibly shared/default) cluster_params dict
|
|
236
|
+
cluster_params = dict(config.get('cluster_params') or {})
|
|
237
|
+
plot_param = cluster_params.pop('plot', False)
|
|
238
|
+
ce = clusteval(**cluster_params)
|
|
189
239
|
results = ce.fit(adjmat.values)
|
|
190
240
|
if plot_param: ce.plot()
|
|
191
|
-
|
|
241
|
+
labx = np.asarray(results['labx'])
|
|
242
|
+
_log(logger, 'info', '[%d] clusters detected' % (len(np.unique(labx[labx != -1]))))
|
|
192
243
|
|
|
193
|
-
#
|
|
244
|
+
# Align cluster labels with node_properties order (adjmat order can differ!)
|
|
194
245
|
Iloc, idx = ismember(node_properties['label'].values, adjmat.index.values)
|
|
195
246
|
if np.any(~Iloc):
|
|
196
|
-
|
|
247
|
+
missing = node_properties['label'].values[~np.asarray(Iloc)]
|
|
248
|
+
_log(logger, 'error', 'Feature name(s): %s can not be used. Hint: Remove special characters.' % (missing,))
|
|
197
249
|
return None
|
|
198
|
-
|
|
199
|
-
|
|
200
|
-
|
|
201
|
-
|
|
202
|
-
|
|
203
|
-
|
|
204
|
-
node_properties['color'] = [str(c) for c in colors]
|
|
250
|
+
labx_nodes = labx[np.asarray(idx)]
|
|
251
|
+
_log(logger, 'info', 'Colors are based on clustering.')
|
|
252
|
+
classlabel, colors = _color_from_labels(labx_nodes, config.get('cmap'))
|
|
253
|
+
node_properties['classlabel'] = classlabel
|
|
254
|
+
node_properties['color'] = colors
|
|
255
|
+
|
|
205
256
|
elif isinstance(config['color'], (list, np.ndarray)):
|
|
206
257
|
if np.all(list(map(colourmap.is_hex_color, config['color']))):
|
|
207
|
-
logger
|
|
208
|
-
# Convert NumPy strings to regular Python strings
|
|
258
|
+
_log(logger, 'info', 'Colors are based on the input hex colors.')
|
|
209
259
|
node_properties['color'] = [str(c) for c in config['color']]
|
|
210
260
|
class_labels = ismember(config['color'], np.unique(config['color']))[1]
|
|
211
261
|
node_properties['classlabel'] = [int(x) for x in class_labels]
|
|
212
262
|
else:
|
|
213
|
-
logger
|
|
263
|
+
_log(logger, 'info', 'Colors are based on the labels.')
|
|
214
264
|
class_labels = ismember(config['color'], np.unique(config['color']))[1]
|
|
215
|
-
|
|
216
|
-
|
|
217
|
-
|
|
218
|
-
node_properties['color'] = [str(c) for c in colors]
|
|
265
|
+
classlabel, colors = _color_from_labels(class_labels, config.get('cmap'))
|
|
266
|
+
node_properties['classlabel'] = classlabel
|
|
267
|
+
node_properties['color'] = colors
|
|
219
268
|
|
|
220
269
|
return node_properties
|
|
221
270
|
|
|
@@ -411,11 +411,11 @@ $SIDE_PANEL_START$
|
|
|
411
411
|
|
|
412
412
|
<div class="physics-control">
|
|
413
413
|
<label for="fontSizeSlider">Font size <span id="fontSizeVal">$FONTSIZE$</span></label>
|
|
414
|
-
<input type="range" id="fontSizeSlider" min="
|
|
414
|
+
<input type="range" id="fontSizeSlider" min="0" max="28" step="1" value="$FONTSIZE$" />
|
|
415
415
|
</div>
|
|
416
416
|
<div class="physics-control">
|
|
417
417
|
<label for="fontHoverSlider">Hover font size <span id="fontHoverVal">$FONTSIZE_MOUSEOVER$</span></label>
|
|
418
|
-
<input type="range" id="fontHoverSlider" min="
|
|
418
|
+
<input type="range" id="fontHoverSlider" min="0" max="36" step="1" value="$FONTSIZE_MOUSEOVER$" />
|
|
419
419
|
</div>
|
|
420
420
|
<div class="physics-control">
|
|
421
421
|
<label for="strokeColor">Highlight stroke</label>
|
|
@@ -450,7 +450,7 @@ var fontSizeHover = chartConfig.fontsizeMouseover;
|
|
|
450
450
|
var strokeColor = chartConfig.stroke;
|
|
451
451
|
|
|
452
452
|
var x = d3.scale.ordinal().rangeBands([0, width]),
|
|
453
|
-
z = d3.scale.linear().domain([0,
|
|
453
|
+
z = d3.scale.linear().domain([0, 1]).range([0.15, 1]).clamp(true),
|
|
454
454
|
c = d3.scale.category10().domain(d3.range(10));
|
|
455
455
|
|
|
456
456
|
// Full-viewport SVG so zoom/pan is not clipped to the chart box
|
|
@@ -487,22 +487,36 @@ var data =
|
|
|
487
487
|
nodes.forEach(function(node, i) {
|
|
488
488
|
node.index = i;
|
|
489
489
|
node.count = 0;
|
|
490
|
-
matrix[i] = d3.range(n).map(function(j) { return {x: j, y: i, z: 0}; });
|
|
490
|
+
matrix[i] = d3.range(n).map(function(j) { return {x: j, y: i, z: 0, has: false}; });
|
|
491
491
|
});
|
|
492
492
|
|
|
493
493
|
data.links.forEach(function(link) {
|
|
494
494
|
matrix[link.source][link.target].z += link.value;
|
|
495
495
|
matrix[link.target][link.source].z += link.value;
|
|
496
|
-
matrix[link.source][link.
|
|
497
|
-
matrix[link.target][link.
|
|
496
|
+
matrix[link.source][link.target].has = true;
|
|
497
|
+
matrix[link.target][link.source].has = true;
|
|
498
498
|
nodes[link.source].count += link.value;
|
|
499
499
|
nodes[link.target].count += link.value;
|
|
500
500
|
});
|
|
501
|
+
// Diagonal: mark as present but neutral so it does not dominate the colour scale
|
|
502
|
+
nodes.forEach(function(nd, i) { matrix[i][i].has = true; matrix[i][i].diag = true; });
|
|
503
|
+
|
|
504
|
+
// Scale opacity to the real (possibly z-scored / negative) off-diagonal value range
|
|
505
|
+
(function() {
|
|
506
|
+
var vals = [];
|
|
507
|
+
matrix.forEach(function(r) { r.forEach(function(c) { if (c.has && !c.diag) vals.push(c.z); }); });
|
|
508
|
+
var lo = d3.min(vals), hi = d3.max(vals);
|
|
509
|
+
if (lo === undefined) { lo = 0; hi = 1; }
|
|
510
|
+
if (hi === lo) { hi = lo + 1; }
|
|
511
|
+
z.domain([lo, hi]);
|
|
512
|
+
})();
|
|
501
513
|
|
|
502
514
|
var orders = {
|
|
503
515
|
name: d3.range(n).sort(function(a, b) { return d3.ascending(nodes[a].name, nodes[b].name); }),
|
|
504
516
|
count: d3.range(n).sort(function(a, b) { return nodes[b].count - nodes[a].count; }),
|
|
505
|
-
cluster: d3.range(n).sort(function(a, b) {
|
|
517
|
+
cluster: d3.range(n).sort(function(a, b) {
|
|
518
|
+
return (nodes[a].cluster - nodes[b].cluster) || (nodes[b].count - nodes[a].count);
|
|
519
|
+
})
|
|
506
520
|
};
|
|
507
521
|
|
|
508
522
|
x.domain(orders.name);
|
|
@@ -549,17 +563,18 @@ var data =
|
|
|
549
563
|
|
|
550
564
|
function row(row) {
|
|
551
565
|
var cell = d3.select(this).selectAll(".cell")
|
|
552
|
-
.data(row.filter(function(d) { return d.
|
|
566
|
+
.data(row.filter(function(d) { return d.has; }))
|
|
553
567
|
.enter().append("rect")
|
|
554
568
|
.attr("class", "cell")
|
|
555
569
|
.attr("x", function(d) { return x(d.x); })
|
|
556
570
|
.attr("width", x.rangeBand())
|
|
557
571
|
.attr("height", x.rangeBand())
|
|
558
|
-
.style("fill-opacity", function(d) { return z(d.z); })
|
|
572
|
+
.style("fill-opacity", function(d) { return d.diag ? 0.9 : z(d.z); })
|
|
559
573
|
.style("fill", function(d) {
|
|
560
574
|
var sourceCluster = data.nodes[d.x].cluster;
|
|
561
575
|
var targetCluster = data.nodes[d.y].cluster;
|
|
562
|
-
|
|
576
|
+
// Within-cluster: cluster colour. Between clusters: neutral grey (SVG default black was invisible on dark bg)
|
|
577
|
+
return sourceCluster == targetCluster ? data.nodes[d.x].color : "#8a8f9c";
|
|
563
578
|
})
|
|
564
579
|
.on("mouseover", mouseover)
|
|
565
580
|
.on("mouseout", mouseout);
|
|
@@ -41,7 +41,8 @@ When the user wants to visualize changing values or entities as animated bubbles
|
|
|
41
41
|
When the user wants to visualize particles, movement, or dynamic particle-based patterns, prefer `particles`.
|
|
42
42
|
When the user wants to visualize flows between different entities, stages, or categories, prefer `sankey`.
|
|
43
43
|
When the user wants to visualize how one or more variables change over time, prefer `timeseries`.
|
|
44
|
-
When the user wants to visualize hierarchical data using nested rectangles sized by value, prefer `
|
|
44
|
+
When the user wants to visualize hierarchical data using nested rectangles sized by value, prefer `tree`.
|
|
45
|
+
When the user wants to make diagram, prefer `flowgraph`.
|
|
45
46
|
When the user wants to compare the distributions of continuous variables across groups, prefer `violin`.
|
|
46
47
|
Use `matrix` primarily when the user wants to inspect pairwise relationships, similarities, distances, or connections between rows and columns.
|
|
47
48
|
Use `circlepacking` when the hierarchical structure and relative containment of groups are important.
|