d3blocks 2.1.0__tar.gz → 2.2.1__tar.gz
This diff represents the content of publicly available package versions that have been released to one of the supported registries. The information contained in this diff is provided for informational purposes only and reflects changes between package versions as they appear in their respective public registries.
- {d3blocks-2.1.0 → d3blocks-2.2.1}/MANIFEST.in +1 -0
- d3blocks-2.2.1/PKG-INFO +159 -0
- d3blocks-2.2.1/README.md +128 -0
- {d3blocks-2.1.0 → d3blocks-2.2.1}/d3blocks/__init__.py +1 -1
- {d3blocks-2.1.0 → d3blocks-2.2.1}/d3blocks/d3blocks.py +221 -1
- {d3blocks-2.1.0 → d3blocks-2.2.1}/d3blocks/examples.py +53 -14
- d3blocks-2.2.1/d3blocks/flowgraph/Flowgraph.py +890 -0
- d3blocks-2.2.1/d3blocks/flowgraph/__init__.py +9 -0
- d3blocks-2.2.1/d3blocks/flowgraph/d3js/d3.flowgraph.js +1407 -0
- d3blocks-2.2.1/d3blocks/flowgraph/d3js/d3.v7.min.js +2 -0
- d3blocks-2.2.1/d3blocks/flowgraph/d3js/dagre.LICENSE +19 -0
- d3blocks-2.2.1/d3blocks/flowgraph/d3js/dagre.min.js +815 -0
- d3blocks-2.2.1/d3blocks/flowgraph/d3js/elk.LICENSE.md +264 -0
- d3blocks-2.2.1/d3blocks/flowgraph/d3js/elk.bundled.js +6545 -0
- d3blocks-2.2.1/d3blocks/flowgraph/d3js/flowgraph.css +372 -0
- d3blocks-2.2.1/d3blocks/flowgraph/d3js/flowgraph.html.j2 +130 -0
- {d3blocks-2.1.0 → d3blocks-2.2.1}/d3blocks/heatmap/Heatmap.py +83 -34
- {d3blocks-2.1.0 → d3blocks-2.2.1}/d3blocks/heatmap/d3js/heatmap.html.j2 +25 -10
- {d3blocks-2.1.0 → d3blocks-2.2.1}/d3blocks/skills/d3blocks/SKILL.md +2 -1
- d3blocks-2.2.1/d3blocks/skills_install.py +263 -0
- d3blocks-2.2.1/d3blocks/tests/test_flowgraph.py +331 -0
- d3blocks-2.2.1/d3blocks/violin/d3js/__init__.py +0 -0
- d3blocks-2.2.1/d3blocks.egg-info/PKG-INFO +159 -0
- {d3blocks-2.1.0 → d3blocks-2.2.1}/d3blocks.egg-info/SOURCES.txt +13 -1
- d3blocks-2.1.0/PKG-INFO +0 -171
- d3blocks-2.1.0/README.md +0 -140
- d3blocks-2.1.0/d3blocks/skills.py +0 -129
- d3blocks-2.1.0/d3blocks.egg-info/PKG-INFO +0 -171
- {d3blocks-2.1.0 → d3blocks-2.2.1}/LICENSE +0 -0
- {d3blocks-2.1.0 → d3blocks-2.2.1}/d3blocks/chord/Chord.py +0 -0
- {d3blocks-2.1.0 → d3blocks-2.2.1}/d3blocks/chord/__init__.py +0 -0
- {d3blocks-2.1.0 → d3blocks-2.2.1}/d3blocks/chord/d3js/__init__.py +0 -0
- {d3blocks-2.1.0 → d3blocks-2.2.1}/d3blocks/chord/d3js/chord.css +0 -0
- {d3blocks-2.1.0 → d3blocks-2.2.1}/d3blocks/chord/d3js/chord.html.j2 +0 -0
- {d3blocks-2.1.0 → d3blocks-2.2.1}/d3blocks/chord/d3js/chord.js +0 -0
- {d3blocks-2.1.0 → d3blocks-2.2.1}/d3blocks/circlepacking/Circlepacking.py +0 -0
- {d3blocks-2.1.0 → d3blocks-2.2.1}/d3blocks/circlepacking/__init__.py +0 -0
- {d3blocks-2.1.0 → d3blocks-2.2.1}/d3blocks/circlepacking/d3js/__init__.py +0 -0
- {d3blocks-2.1.0 → d3blocks-2.2.1}/d3blocks/circlepacking/d3js/circlepacking.css +0 -0
- {d3blocks-2.1.0 → d3blocks-2.2.1}/d3blocks/circlepacking/d3js/circlepacking.html.j2 +0 -0
- {d3blocks-2.1.0 → d3blocks-2.2.1}/d3blocks/circlepacking/d3js/d3.v6.min.js +0 -0
- {d3blocks-2.1.0 → d3blocks-2.2.1}/d3blocks/circlepacking/d3js/lodash.min.js +0 -0
- {d3blocks-2.1.0 → d3blocks-2.2.1}/d3blocks/elasticgraph/__init__.py +0 -0
- {d3blocks-2.1.0 → d3blocks-2.2.1}/d3blocks/elasticgraph/d3js/.gitkeep +0 -0
- {d3blocks-2.1.0 → d3blocks-2.2.1}/d3blocks/elasticgraph/d3js/__init__.py +0 -0
- {d3blocks-2.1.0 → d3blocks-2.2.1}/d3blocks/elasticgraph/d3js/d3.v2.js +0 -0
- {d3blocks-2.1.0 → d3blocks-2.2.1}/d3blocks/elasticgraph/d3js/elasticgraph.css +0 -0
- {d3blocks-2.1.0 → d3blocks-2.2.1}/d3blocks/elasticgraph/d3js/elasticgraph.html.j2 +0 -0
- {d3blocks-2.1.0 → d3blocks-2.2.1}/d3blocks/elasticgraph/d3js/elasticgraph.js +0 -0
- {d3blocks-2.1.0 → d3blocks-2.2.1}/d3blocks/elasticgraph/elasticgraph.py +0 -0
- {d3blocks-2.1.0 → d3blocks-2.2.1}/d3blocks/examples_docs.py +0 -0
- {d3blocks-2.1.0/d3blocks/heatmap → d3blocks-2.2.1/d3blocks/flowgraph/d3js}/__init__.py +0 -0
- {d3blocks-2.1.0/d3blocks/heatmap/d3js → d3blocks-2.2.1/d3blocks/heatmap}/__init__.py +0 -0
- {d3blocks-2.1.0/d3blocks/imageslider → d3blocks-2.2.1/d3blocks/heatmap/d3js}/__init__.py +0 -0
- {d3blocks-2.1.0 → d3blocks-2.2.1}/d3blocks/heatmap/d3js/d3.scale.chromatic.v1.min.js +0 -0
- {d3blocks-2.1.0 → d3blocks-2.2.1}/d3blocks/heatmap/d3js/d3.v4.js +0 -0
- {d3blocks-2.1.0 → d3blocks-2.2.1}/d3blocks/heatmap/d3js/heatmap.css +0 -0
- {d3blocks-2.1.0 → d3blocks-2.2.1}/d3blocks/heatmap/d3js/matrix.html.j2 +0 -0
- {d3blocks-2.1.0 → d3blocks-2.2.1}/d3blocks/imageslider/Imageslider.py +0 -0
- {d3blocks-2.1.0/d3blocks/imageslider/d3js → d3blocks-2.2.1/d3blocks/imageslider}/__init__.py +0 -0
- {d3blocks-2.1.0 → d3blocks-2.2.1}/d3blocks/imageslider/d3js/.keep +0 -0
- {d3blocks-2.1.0/d3blocks/maps → d3blocks-2.2.1/d3blocks/imageslider/d3js}/__init__.py +0 -0
- {d3blocks-2.1.0 → d3blocks-2.2.1}/d3blocks/imageslider/d3js/imageslider.css +0 -0
- {d3blocks-2.1.0 → d3blocks-2.2.1}/d3blocks/imageslider/d3js/imageslider.html.j2 +0 -0
- {d3blocks-2.1.0 → d3blocks-2.2.1}/d3blocks/imageslider/d3js/imageslider.js +0 -0
- {d3blocks-2.1.0 → d3blocks-2.2.1}/d3blocks/imageslider/d3js/jquery-2.1.1.js +0 -0
- {d3blocks-2.1.0 → d3blocks-2.2.1}/d3blocks/imageslider/d3js/modernizr.js +0 -0
- {d3blocks-2.1.0 → d3blocks-2.2.1}/d3blocks/imageslider/d3js/reset.css +0 -0
- {d3blocks-2.1.0 → d3blocks-2.2.1}/d3blocks/logo.txt +0 -0
- {d3blocks-2.1.0 → d3blocks-2.2.1}/d3blocks/maps/Maps.py +0 -0
- {d3blocks-2.1.0/d3blocks/maps/d3js → d3blocks-2.2.1/d3blocks/maps}/__init__.py +0 -0
- {d3blocks-2.1.0/d3blocks/matrix → d3blocks-2.2.1/d3blocks/maps/d3js}/__init__.py +0 -0
- {d3blocks-2.1.0 → d3blocks-2.2.1}/d3blocks/maps/d3js/d3.v6.min.js +0 -0
- {d3blocks-2.1.0 → d3blocks-2.2.1}/d3blocks/maps/d3js/geojson.zip +0 -0
- {d3blocks-2.1.0 → d3blocks-2.2.1}/d3blocks/maps/d3js/maps.css +0 -0
- {d3blocks-2.1.0 → d3blocks-2.2.1}/d3blocks/maps/d3js/maps.html.j2 +0 -0
- {d3blocks-2.1.0 → d3blocks-2.2.1}/d3blocks/maps/d3js/world.geojson +0 -0
- {d3blocks-2.1.0 → d3blocks-2.2.1}/d3blocks/matrix/Matrix.py +0 -0
- {d3blocks-2.1.0/d3blocks/matrix/d3js → d3blocks-2.2.1/d3blocks/matrix}/__init__.py +0 -0
- {d3blocks-2.1.0/d3blocks/movingbubbles → d3blocks-2.2.1/d3blocks/matrix/d3js}/__init__.py +0 -0
- {d3blocks-2.1.0 → d3blocks-2.2.1}/d3blocks/matrix/d3js/d3.scale.chromatic.v1.min.js +0 -0
- {d3blocks-2.1.0 → d3blocks-2.2.1}/d3blocks/matrix/d3js/d3.v4.js +0 -0
- {d3blocks-2.1.0 → d3blocks-2.2.1}/d3blocks/matrix/d3js/matrix.html.j2 +0 -0
- {d3blocks-2.1.0 → d3blocks-2.2.1}/d3blocks/movingbubbles/Movingbubbles.py +0 -0
- {d3blocks-2.1.0/d3blocks/movingbubbles/d3js → d3blocks-2.2.1/d3blocks/movingbubbles}/__init__.py +0 -0
- {d3blocks-2.1.0/d3blocks/particles → d3blocks-2.2.1/d3blocks/movingbubbles/d3js}/__init__.py +0 -0
- {d3blocks-2.1.0 → d3blocks-2.2.1}/d3blocks/movingbubbles/d3js/d3-3-5-5.min.js +0 -0
- {d3blocks-2.1.0 → d3blocks-2.2.1}/d3blocks/movingbubbles/d3js/movingbubbles.css +0 -0
- {d3blocks-2.1.0 → d3blocks-2.2.1}/d3blocks/movingbubbles/d3js/movingbubbles.html.j2 +0 -0
- {d3blocks-2.1.0 → d3blocks-2.2.1}/d3blocks/particles/Particles.py +0 -0
- {d3blocks-2.1.0/d3blocks/particles/d3js → d3blocks-2.2.1/d3blocks/particles}/__init__.py +0 -0
- {d3blocks-2.1.0/d3blocks/sankey → d3blocks-2.2.1/d3blocks/particles/d3js}/__init__.py +0 -0
- {d3blocks-2.1.0 → d3blocks-2.2.1}/d3blocks/particles/d3js/d3-scale-chromatic.v1.min.js +0 -0
- {d3blocks-2.1.0 → d3blocks-2.2.1}/d3blocks/particles/d3js/d3.v4.min.js +0 -0
- {d3blocks-2.1.0 → d3blocks-2.2.1}/d3blocks/particles/d3js/particles.html.j2 +0 -0
- {d3blocks-2.1.0 → d3blocks-2.2.1}/d3blocks/radialgraph/Radialgraph.py +0 -0
- {d3blocks-2.1.0 → d3blocks-2.2.1}/d3blocks/radialgraph/__init__.py +0 -0
- {d3blocks-2.1.0 → d3blocks-2.2.1}/d3blocks/radialgraph/d3js/__init__ .py +0 -0
- {d3blocks-2.1.0 → d3blocks-2.2.1}/d3blocks/radialgraph/d3js/d3.radialgraph.js +0 -0
- {d3blocks-2.1.0 → d3blocks-2.2.1}/d3blocks/radialgraph/d3js/d3.v7.min.js +0 -0
- {d3blocks-2.1.0 → d3blocks-2.2.1}/d3blocks/radialgraph/d3js/radialgraph.css +0 -0
- {d3blocks-2.1.0 → d3blocks-2.2.1}/d3blocks/radialgraph/d3js/radialgraph.html.j2 +0 -0
- {d3blocks-2.1.0 → d3blocks-2.2.1}/d3blocks/sankey/Sankey.py +0 -0
- {d3blocks-2.1.0/d3blocks/sankey/d3js → d3blocks-2.2.1/d3blocks/sankey}/__init__.py +0 -0
- {d3blocks-2.1.0/d3blocks/scatter → d3blocks-2.2.1/d3blocks/sankey/d3js}/__init__.py +0 -0
- {d3blocks-2.1.0 → d3blocks-2.2.1}/d3blocks/sankey/d3js/sankey.css +0 -0
- {d3blocks-2.1.0 → d3blocks-2.2.1}/d3blocks/sankey/d3js/sankey.html.j2 +0 -0
- {d3blocks-2.1.0 → d3blocks-2.2.1}/d3blocks/sankey/d3js/sankey.js +0 -0
- {d3blocks-2.1.0 → d3blocks-2.2.1}/d3blocks/scatter/Scatter.py +0 -0
- {d3blocks-2.1.0/d3blocks/scatter/d3js → d3blocks-2.2.1/d3blocks/scatter}/__init__.py +0 -0
- {d3blocks-2.1.0/d3blocks/tests → d3blocks-2.2.1/d3blocks/scatter/d3js}/__init__.py +0 -0
- {d3blocks-2.1.0 → d3blocks-2.2.1}/d3blocks/scatter/d3js/associations.js +0 -0
- {d3blocks-2.1.0 → d3blocks-2.2.1}/d3blocks/scatter/d3js/d3.v4.min.js +0 -0
- {d3blocks-2.1.0 → d3blocks-2.2.1}/d3blocks/scatter/d3js/scatter.css +0 -0
- {d3blocks-2.1.0 → d3blocks-2.2.1}/d3blocks/scatter/d3js/scatter.html.j2 +0 -0
- {d3blocks-2.1.0 → d3blocks-2.2.1}/d3blocks/skills/d3blocks/references/scatter.md +0 -0
- {d3blocks-2.1.0/d3blocks/timeseries → d3blocks-2.2.1/d3blocks/tests}/__init__.py +0 -0
- {d3blocks-2.1.0 → d3blocks-2.2.1}/d3blocks/tests/test_all_examples.py +0 -0
- {d3blocks-2.1.0 → d3blocks-2.2.1}/d3blocks/tests/test_chord_margins.py +0 -0
- {d3blocks-2.1.0 → d3blocks-2.2.1}/d3blocks/tests/test_d3blocks.py +0 -0
- {d3blocks-2.1.0 → d3blocks-2.2.1}/d3blocks/tests/test_medium_charts.py +0 -0
- {d3blocks-2.1.0 → d3blocks-2.2.1}/d3blocks/tests/test_movingbubbles_timedelta.py +0 -0
- {d3blocks-2.1.0 → d3blocks-2.2.1}/d3blocks/tests/test_radialgraph.py +0 -0
- {d3blocks-2.1.0 → d3blocks-2.2.1}/d3blocks/timeseries/Timeseries.py +0 -0
- {d3blocks-2.1.0/d3blocks/timeseries/d3js → d3blocks-2.2.1/d3blocks/timeseries}/__init__.py +0 -0
- {d3blocks-2.1.0/d3blocks/tree → d3blocks-2.2.1/d3blocks/timeseries/d3js}/__init__.py +0 -0
- {d3blocks-2.1.0 → d3blocks-2.2.1}/d3blocks/timeseries/d3js/d3.v3.js +0 -0
- {d3blocks-2.1.0 → d3blocks-2.2.1}/d3blocks/timeseries/d3js/timeseries.css +0 -0
- {d3blocks-2.1.0 → d3blocks-2.2.1}/d3blocks/timeseries/d3js/timeseries.html.j2 +0 -0
- {d3blocks-2.1.0 → d3blocks-2.2.1}/d3blocks/timeseries/d3js/timeseries.js +0 -0
- {d3blocks-2.1.0 → d3blocks-2.2.1}/d3blocks/tree/Tree.py +0 -0
- {d3blocks-2.1.0/d3blocks/tree/d3js → d3blocks-2.2.1/d3blocks/tree}/__init__.py +0 -0
- {d3blocks-2.1.0/d3blocks/treemap → d3blocks-2.2.1/d3blocks/tree/d3js}/__init__.py +0 -0
- {d3blocks-2.1.0 → d3blocks-2.2.1}/d3blocks/tree/d3js/collapsibleTree.js +0 -0
- {d3blocks-2.1.0 → d3blocks-2.2.1}/d3blocks/tree/d3js/d3.tree.js +0 -0
- {d3blocks-2.1.0 → d3blocks-2.2.1}/d3blocks/tree/d3js/d3.v4.min.js +0 -0
- {d3blocks-2.1.0 → d3blocks-2.2.1}/d3blocks/tree/d3js/tree.css +0 -0
- {d3blocks-2.1.0 → d3blocks-2.2.1}/d3blocks/tree/d3js/tree.html.j2 +0 -0
- {d3blocks-2.1.0 → d3blocks-2.2.1}/d3blocks/treemap/Treemap.py +0 -0
- {d3blocks-2.1.0/d3blocks/treemap/d3js → d3blocks-2.2.1/d3blocks/treemap}/__init__.py +0 -0
- {d3blocks-2.1.0/d3blocks/violin → d3blocks-2.2.1/d3blocks/treemap/d3js}/__init__.py +0 -0
- {d3blocks-2.1.0 → d3blocks-2.2.1}/d3blocks/treemap/d3js/d3.v4.min.js +0 -0
- {d3blocks-2.1.0 → d3blocks-2.2.1}/d3blocks/treemap/d3js/treemap.css +0 -0
- {d3blocks-2.1.0 → d3blocks-2.2.1}/d3blocks/treemap/d3js/treemap.html.j2 +0 -0
- {d3blocks-2.1.0 → d3blocks-2.2.1}/d3blocks/utils.py +0 -0
- {d3blocks-2.1.0 → d3blocks-2.2.1}/d3blocks/violin/Violin.py +0 -0
- {d3blocks-2.1.0/d3blocks/violin/d3js → d3blocks-2.2.1/d3blocks/violin}/__init__.py +0 -0
- {d3blocks-2.1.0 → d3blocks-2.2.1}/d3blocks/violin/d3js/d3-scale-chromatic.v1.min.js +0 -0
- {d3blocks-2.1.0 → d3blocks-2.2.1}/d3blocks/violin/d3js/d3.v4.min.js +0 -0
- {d3blocks-2.1.0 → d3blocks-2.2.1}/d3blocks/violin/d3js/violin.css +0 -0
- {d3blocks-2.1.0 → d3blocks-2.2.1}/d3blocks/violin/d3js/violin.html.j2 +0 -0
- {d3blocks-2.1.0 → d3blocks-2.2.1}/d3blocks.egg-info/dependency_links.txt +0 -0
- {d3blocks-2.1.0 → d3blocks-2.2.1}/d3blocks.egg-info/entry_points.txt +0 -0
- {d3blocks-2.1.0 → d3blocks-2.2.1}/d3blocks.egg-info/requires.txt +0 -0
- {d3blocks-2.1.0 → d3blocks-2.2.1}/d3blocks.egg-info/top_level.txt +0 -0
- {d3blocks-2.1.0 → d3blocks-2.2.1}/pyproject.toml +0 -0
- {d3blocks-2.1.0 → d3blocks-2.2.1}/setup.cfg +0 -0
d3blocks-2.2.1/PKG-INFO
ADDED
|
@@ -0,0 +1,159 @@
|
|
|
1
|
+
Metadata-Version: 2.4
|
|
2
|
+
Name: d3blocks
|
|
3
|
+
Version: 2.2.1
|
|
4
|
+
Summary: Python package d3blocks.
|
|
5
|
+
Author-email: Erdogan Taskesen <erdogant@gmail.com>
|
|
6
|
+
License-Expression: GPL-3.0-or-later
|
|
7
|
+
Project-URL: Homepage, https://erdogant.github.io/d3blocks
|
|
8
|
+
Project-URL: Download, https://github.com/erdogant/d3blocks/archive/{version}.tar.gz
|
|
9
|
+
Keywords: Python,visualizations,interactive,javascript,d3js,d3blocks,network,graph,data visualization,web,extendable,extension,plugin,modular,customizable
|
|
10
|
+
Classifier: Programming Language :: Python :: 3
|
|
11
|
+
Classifier: Operating System :: OS Independent
|
|
12
|
+
Classifier: Intended Audience :: Education
|
|
13
|
+
Classifier: Intended Audience :: Science/Research
|
|
14
|
+
Classifier: Operating System :: Unix
|
|
15
|
+
Classifier: Operating System :: Microsoft :: Windows
|
|
16
|
+
Classifier: Operating System :: MacOS
|
|
17
|
+
Requires-Python: >=3
|
|
18
|
+
Description-Content-Type: text/markdown
|
|
19
|
+
License-File: LICENSE
|
|
20
|
+
Requires-Dist: numpy
|
|
21
|
+
Requires-Dist: colourmap>=1.1.10
|
|
22
|
+
Requires-Dist: datazets>=0.1.7
|
|
23
|
+
Requires-Dist: d3graph>=3.2.0
|
|
24
|
+
Requires-Dist: ismember>=1.0.1
|
|
25
|
+
Requires-Dist: pandas
|
|
26
|
+
Requires-Dist: tqdm
|
|
27
|
+
Requires-Dist: requests
|
|
28
|
+
Requires-Dist: jinja2
|
|
29
|
+
Requires-Dist: scikit-learn
|
|
30
|
+
Dynamic: license-file
|
|
31
|
+
|
|
32
|
+
[](https://img.shields.io/pypi/pyversions/d3blocks)
|
|
33
|
+
[](https://pypi.org/project/d3blocks/)
|
|
34
|
+
[](https://d3blocks.github.io/d3blocks/)
|
|
35
|
+
[](https://github.com/d3blocks/d3blocks/)
|
|
36
|
+
[](https://pepy.tech/project/d3blocks)
|
|
37
|
+
[](https://pepy.tech/project/d3blocks)
|
|
38
|
+
[](https://github.com/d3blocks/d3blocks/blob/master/LICENSE)
|
|
39
|
+
[](https://github.com/d3blocks/d3blocks/network)
|
|
40
|
+
[](https://github.com/d3blocks/d3blocks/issues)
|
|
41
|
+
[](http://www.repostatus.org/#active)
|
|
42
|
+
[](https://d3blocks.github.io/d3blocks/Documentation.html#medium-blog)
|
|
43
|
+

|
|
44
|
+

|
|
45
|
+
[](https://github.com/d3blocks/d3blocks/blob/main/notebooks/d3blocks.ipynb)
|
|
46
|
+
[](https://d3blocks.github.io/d3blocks/Documentation.html#)
|
|
47
|
+
|
|
48
|
+
###
|
|
49
|
+
|
|
50
|
+
<div>
|
|
51
|
+
|
|
52
|
+
<a href="https://d3blocks.github.io/d3blocks/"><img src="https://github.com/d3blocks/d3blocks/blob/main/logo.png" width="275" align="left" /></a>
|
|
53
|
+
``D3Blocks`` is a Python package that builds on the graphics of d3 javascript (d3js). It allows you to create the most visually attractive and useful charts with only a few lines of Python code!
|
|
54
|
+
The [documentation pages](https://d3blocks.github.io/d3blocks/) contain detailed information about the working of the blocks with many examples. **⭐️ Star it if you like it ⭐️**
|
|
55
|
+
</div>
|
|
56
|
+
|
|
57
|
+
---
|
|
58
|
+
|
|
59
|
+
<p align="center">
|
|
60
|
+
<a href="https://d3blocks.github.io/d3blocks">
|
|
61
|
+
<img src="https://github.com/d3blocks/d3blocks/blob/main/docs/figs/summary.png" width="600" />
|
|
62
|
+
</a>
|
|
63
|
+
</p>
|
|
64
|
+
|
|
65
|
+
---
|
|
66
|
+
|
|
67
|
+
### Resources and Links
|
|
68
|
+
- [**Example Notebooks**](https://d3blocks.github.io/d3blocks/Documentation.html#google-colab-notebooks)
|
|
69
|
+
- [**Documentation**](https://d3blocks.github.io/d3blocks)
|
|
70
|
+
- [**Bug Reports and Feature Requests**](https://github.com/d3blocks/d3blocks/issues)
|
|
71
|
+
|
|
72
|
+
### Blogs
|
|
73
|
+
- [**Medium Blog**](https://medium.com/data-science-collective/d3blocks-the-sweet-spot-for-data-scientists-interactive-charts-without-deployment-friction-c7f576025510)
|
|
74
|
+
- [**Substack with podcast**](https://erdogant.substack.com/p/d3blocks-the-python-library-to-create)
|
|
75
|
+
- [**Gumroad Blogs with podcast**](https://erdogant.gumroad.com/l/d3blocks-the-python-library-to-create-interactive-standalone-and-beautiful-d3-js-charts)
|
|
76
|
+
|
|
77
|
+
-------------------------------------------------------------------------
|
|
78
|
+
### [Available charts](https://d3blocks.github.io/d3blocks/)
|
|
79
|
+
|
|
80
|
+
|
|
81
|
+
| nr | Block | Function | More Information |
|
|
82
|
+
|-----|------------------------------------------------------------------------------------|------------------------------|-------------------------------------------------------------------------|
|
|
83
|
+
| 1 | [D3graph](https://d3blocks.github.io/d3blocks/d3graph.html) | ``` d3.d3graph() ``` | [D3graph](https://medium.com/data-science-collective/how-to-turn-any-network-into-an-interactive-knowledge-graph-to-discover-hidden-insights-f49fae4757ff) |
|
|
84
|
+
| 2 | [Radialgraph](https://d3blocks.github.io/d3blocks/Radialgraph.html) | ``` d3.radialgraph() ``` | [Radialgraph](https://medium.com/data-science-collective/radialgraph-a-new-way-to-explore-large-networks-without-the-hairball-ea34193ddec9) |
|
|
85
|
+
| 3 | [Elasticgraph](https://d3blocks.github.io/d3blocks/elasticgraph.html) | ``` d3.elasticgraph() ``` | [D3Blocks](https://medium.com/data-science-collective/d3blocks-the-sweet-spot-for-data-scientists-interactive-charts-without-deployment-friction-c7f576025510) |
|
|
86
|
+
| 4 | [Sankey](https://d3blocks.github.io/d3blocks/Sankey.html) | ``` d3.sankey() ``` | [D3Blocks](https://medium.com/data-science-collective/d3blocks-the-sweet-spot-for-data-scientists-interactive-charts-without-deployment-friction-c7f576025510) |
|
|
87
|
+
| 5 | [Movingbubbles](https://d3blocks.github.io/d3blocks/MovingBubbles.html) | ``` d3.movingbubbles() ``` | [D3Blocks](https://medium.com/data-science-collective/d3blocks-the-sweet-spot-for-data-scientists-interactive-charts-without-deployment-friction-c7f576025510) |
|
|
88
|
+
| 6 | [Scatter](https://d3blocks.github.io/d3blocks/Scatter.html) | ``` d3.scatter() ``` | [D3Blocks](https://medium.com/data-science-collective/d3blocks-the-sweet-spot-for-data-scientists-interactive-charts-without-deployment-friction-c7f576025510) |
|
|
89
|
+
| 7 | [Heatmap](https://d3blocks.github.io/d3blocks/Heatmap.html) | ``` d3.heatmap() ``` | [D3Blocks](https://medium.com/data-science-collective/d3blocks-the-sweet-spot-for-data-scientists-interactive-charts-without-deployment-friction-c7f576025510) |
|
|
90
|
+
| 8 | [Chord diagram](https://d3blocks.github.io/d3blocks/Chord.html) | ``` d3.chord() ``` | [D3Blocks](https://medium.com/data-science-collective/d3blocks-the-sweet-spot-for-data-scientists-interactive-charts-without-deployment-friction-c7f576025510) |
|
|
91
|
+
| 9 | [Timeseries](https://d3blocks.github.io/d3blocks/Timeseries.html) | ``` d3.timeseries() ``` | [D3Blocks](https://medium.com/data-science-collective/d3blocks-the-sweet-spot-for-data-scientists-interactive-charts-without-deployment-friction-c7f576025510) |
|
|
92
|
+
| 10 | [Image slider](https://d3blocks.github.io/d3blocks/Imageslider.html) | ``` d3.imageslider() ``` | [D3Blocks](https://medium.com/data-science-collective/d3blocks-the-sweet-spot-for-data-scientists-interactive-charts-without-deployment-friction-c7f576025510) |
|
|
93
|
+
| 11 | [Violin plot](https://d3blocks.github.io/d3blocks/Violin.html) | ``` d3.violin() ``` | [D3Blocks](https://medium.com/data-science-collective/d3blocks-the-sweet-spot-for-data-scientists-interactive-charts-without-deployment-friction-c7f576025510) |
|
|
94
|
+
| 12 | [Particles](https://d3blocks.github.io/d3blocks/Particles.html) | ``` d3.particles() ``` | [D3Blocks](https://medium.com/data-science-collective/d3blocks-the-sweet-spot-for-data-scientists-interactive-charts-without-deployment-friction-c7f576025510) |
|
|
95
|
+
| 13 | [Treemap](https://d3blocks.github.io/d3blocks/Treemap.html) | ``` d3.treemap() ``` | [D3Blocks](https://medium.com/data-science-collective/d3blocks-the-sweet-spot-for-data-scientists-interactive-charts-without-deployment-friction-c7f576025510) |
|
|
96
|
+
| 14 | [Tree](https://d3blocks.github.io/d3blocks/Tree.html) | ``` d3.tree() ``` | [D3Blocks](https://medium.com/data-science-collective/d3blocks-the-sweet-spot-for-data-scientists-interactive-charts-without-deployment-friction-c7f576025510) |
|
|
97
|
+
| 15 | [Maps](https://d3blocks.github.io/d3blocks/Maps.html) | ``` d3.maps() ``` | [D3Blocks](https://medium.com/data-science-collective/d3blocks-the-sweet-spot-for-data-scientists-interactive-charts-without-deployment-friction-c7f576025510) |
|
|
98
|
+
| 16 | [Circlepacking](https://d3blocks.github.io/d3blocks/Circlepacking.html) | ``` d3.circlepacking() ``` | [D3Blocks](https://medium.com/data-science-collective/d3blocks-the-sweet-spot-for-data-scientists-interactive-charts-without-deployment-friction-c7f576025510) |
|
|
99
|
+
| 17 | [Flowgraph](https://d3blocks.github.io/d3blocks/Flowgraph.html) | ``` d3.flowgraph() ``` | [Dagre](https://github.com/dagrejs/dagre) |
|
|
100
|
+
|
|
101
|
+
-------------------------------------------------------------------------
|
|
102
|
+
|
|
103
|
+
#### Installation (Pypi)
|
|
104
|
+
```bash
|
|
105
|
+
pip install d3blocks # Normal installation
|
|
106
|
+
pip install -U d3blocks # Force update
|
|
107
|
+
```
|
|
108
|
+
|
|
109
|
+
#### Installation (clone)
|
|
110
|
+
```bash
|
|
111
|
+
git clone https://github.com/d3blocks/d3blocks.git
|
|
112
|
+
cd d3blocks
|
|
113
|
+
pip install -U .
|
|
114
|
+
```
|
|
115
|
+
|
|
116
|
+
#### Import d3blocks package
|
|
117
|
+
```python
|
|
118
|
+
from d3blocks import D3Blocks
|
|
119
|
+
# Initialize
|
|
120
|
+
d3 = D3Blocks()
|
|
121
|
+
```
|
|
122
|
+
|
|
123
|
+
|
|
124
|
+
---
|
|
125
|
+
|
|
126
|
+
### D3Blocks💙Streamlit
|
|
127
|
+
Every chart from D3Block can easily be incorporated into a Streamlit Dashboard. Because every D3Blocks chart is just HTML and JavaScript, you can generate the HTML in memory and embed it
|
|
128
|
+
A few practical rules of thumb: prefer `st.iframe` over the older `components.html` for full interactive charts, always pass an explicit pixel height, and set `show_side_panel=False` when Streamlit already owns the controls so the UI doesn't duplicate. `color_background='streamlit'` picks backgrounds that match a typical Streamlit light or dark page.
|
|
129
|
+
|
|
130
|
+
* [Minimal examples for each chart can be found in the Streamlit directory in the repo](https://github.com/d3blocks/d3blocks/tree/main/streamlit).
|
|
131
|
+
* [More Streamlit documentation can be found here.](https://d3blocks.github.io/d3blocks/Streamlit.html)
|
|
132
|
+
|
|
133
|
+
---
|
|
134
|
+
|
|
135
|
+
### Ethical Ads
|
|
136
|
+
When HTMLs are generated, it automatically includes ethical ads as a small way to support development.
|
|
137
|
+
I maintain this entire project thoughtfully and in my free time. Ads can be disabled via an input parameter, and you can also support the project with a coffee donation instead.
|
|
138
|
+
|
|
139
|
+
### Star history
|
|
140
|
+
[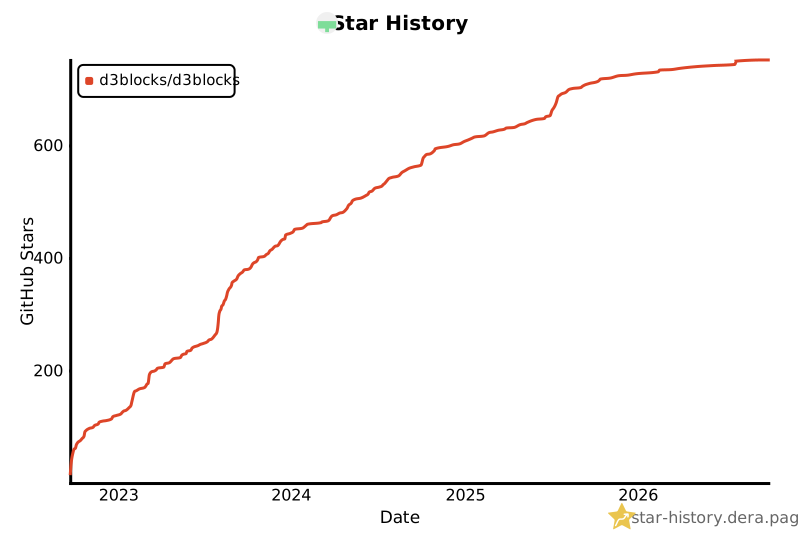](https://star-history.dera.page/d3blocks/d3blocks)
|
|
141
|
+
|
|
142
|
+
### References
|
|
143
|
+
* [bl.ocks](https://bl.ocks.org/)
|
|
144
|
+
* [observablehq](https://observablehq.com/top)
|
|
145
|
+
|
|
146
|
+
### Contributors
|
|
147
|
+
|
|
148
|
+
<p align="left">
|
|
149
|
+
<a href="https://github.com/d3blocks/d3blocks/graphs/contributors">
|
|
150
|
+
<img src="https://contrib.rocks/image?repo=d3blocks/d3blocks" />
|
|
151
|
+
</a>
|
|
152
|
+
</p>
|
|
153
|
+
|
|
154
|
+
### Maintainer
|
|
155
|
+
* Erdogan Taskesen, github: [erdogant](https://github.com/erdogant)
|
|
156
|
+
* Contributions are welcome.
|
|
157
|
+
* Yes! This library is entirely **free** but it runs on coffee! :) Feel free to support with a <a href="https://erdogant.github.io/donate/?currency=USD&amount=5">Coffee</a>.
|
|
158
|
+
|
|
159
|
+
[](https://www.buymeacoffee.com/erdogant)
|
d3blocks-2.2.1/README.md
ADDED
|
@@ -0,0 +1,128 @@
|
|
|
1
|
+
[](https://img.shields.io/pypi/pyversions/d3blocks)
|
|
2
|
+
[](https://pypi.org/project/d3blocks/)
|
|
3
|
+
[](https://d3blocks.github.io/d3blocks/)
|
|
4
|
+
[](https://github.com/d3blocks/d3blocks/)
|
|
5
|
+
[](https://pepy.tech/project/d3blocks)
|
|
6
|
+
[](https://pepy.tech/project/d3blocks)
|
|
7
|
+
[](https://github.com/d3blocks/d3blocks/blob/master/LICENSE)
|
|
8
|
+
[](https://github.com/d3blocks/d3blocks/network)
|
|
9
|
+
[](https://github.com/d3blocks/d3blocks/issues)
|
|
10
|
+
[](http://www.repostatus.org/#active)
|
|
11
|
+
[](https://d3blocks.github.io/d3blocks/Documentation.html#medium-blog)
|
|
12
|
+

|
|
13
|
+

|
|
14
|
+
[](https://github.com/d3blocks/d3blocks/blob/main/notebooks/d3blocks.ipynb)
|
|
15
|
+
[](https://d3blocks.github.io/d3blocks/Documentation.html#)
|
|
16
|
+
|
|
17
|
+
###
|
|
18
|
+
|
|
19
|
+
<div>
|
|
20
|
+
|
|
21
|
+
<a href="https://d3blocks.github.io/d3blocks/"><img src="https://github.com/d3blocks/d3blocks/blob/main/logo.png" width="275" align="left" /></a>
|
|
22
|
+
``D3Blocks`` is a Python package that builds on the graphics of d3 javascript (d3js). It allows you to create the most visually attractive and useful charts with only a few lines of Python code!
|
|
23
|
+
The [documentation pages](https://d3blocks.github.io/d3blocks/) contain detailed information about the working of the blocks with many examples. **⭐️ Star it if you like it ⭐️**
|
|
24
|
+
</div>
|
|
25
|
+
|
|
26
|
+
---
|
|
27
|
+
|
|
28
|
+
<p align="center">
|
|
29
|
+
<a href="https://d3blocks.github.io/d3blocks">
|
|
30
|
+
<img src="https://github.com/d3blocks/d3blocks/blob/main/docs/figs/summary.png" width="600" />
|
|
31
|
+
</a>
|
|
32
|
+
</p>
|
|
33
|
+
|
|
34
|
+
---
|
|
35
|
+
|
|
36
|
+
### Resources and Links
|
|
37
|
+
- [**Example Notebooks**](https://d3blocks.github.io/d3blocks/Documentation.html#google-colab-notebooks)
|
|
38
|
+
- [**Documentation**](https://d3blocks.github.io/d3blocks)
|
|
39
|
+
- [**Bug Reports and Feature Requests**](https://github.com/d3blocks/d3blocks/issues)
|
|
40
|
+
|
|
41
|
+
### Blogs
|
|
42
|
+
- [**Medium Blog**](https://medium.com/data-science-collective/d3blocks-the-sweet-spot-for-data-scientists-interactive-charts-without-deployment-friction-c7f576025510)
|
|
43
|
+
- [**Substack with podcast**](https://erdogant.substack.com/p/d3blocks-the-python-library-to-create)
|
|
44
|
+
- [**Gumroad Blogs with podcast**](https://erdogant.gumroad.com/l/d3blocks-the-python-library-to-create-interactive-standalone-and-beautiful-d3-js-charts)
|
|
45
|
+
|
|
46
|
+
-------------------------------------------------------------------------
|
|
47
|
+
### [Available charts](https://d3blocks.github.io/d3blocks/)
|
|
48
|
+
|
|
49
|
+
|
|
50
|
+
| nr | Block | Function | More Information |
|
|
51
|
+
|-----|------------------------------------------------------------------------------------|------------------------------|-------------------------------------------------------------------------|
|
|
52
|
+
| 1 | [D3graph](https://d3blocks.github.io/d3blocks/d3graph.html) | ``` d3.d3graph() ``` | [D3graph](https://medium.com/data-science-collective/how-to-turn-any-network-into-an-interactive-knowledge-graph-to-discover-hidden-insights-f49fae4757ff) |
|
|
53
|
+
| 2 | [Radialgraph](https://d3blocks.github.io/d3blocks/Radialgraph.html) | ``` d3.radialgraph() ``` | [Radialgraph](https://medium.com/data-science-collective/radialgraph-a-new-way-to-explore-large-networks-without-the-hairball-ea34193ddec9) |
|
|
54
|
+
| 3 | [Elasticgraph](https://d3blocks.github.io/d3blocks/elasticgraph.html) | ``` d3.elasticgraph() ``` | [D3Blocks](https://medium.com/data-science-collective/d3blocks-the-sweet-spot-for-data-scientists-interactive-charts-without-deployment-friction-c7f576025510) |
|
|
55
|
+
| 4 | [Sankey](https://d3blocks.github.io/d3blocks/Sankey.html) | ``` d3.sankey() ``` | [D3Blocks](https://medium.com/data-science-collective/d3blocks-the-sweet-spot-for-data-scientists-interactive-charts-without-deployment-friction-c7f576025510) |
|
|
56
|
+
| 5 | [Movingbubbles](https://d3blocks.github.io/d3blocks/MovingBubbles.html) | ``` d3.movingbubbles() ``` | [D3Blocks](https://medium.com/data-science-collective/d3blocks-the-sweet-spot-for-data-scientists-interactive-charts-without-deployment-friction-c7f576025510) |
|
|
57
|
+
| 6 | [Scatter](https://d3blocks.github.io/d3blocks/Scatter.html) | ``` d3.scatter() ``` | [D3Blocks](https://medium.com/data-science-collective/d3blocks-the-sweet-spot-for-data-scientists-interactive-charts-without-deployment-friction-c7f576025510) |
|
|
58
|
+
| 7 | [Heatmap](https://d3blocks.github.io/d3blocks/Heatmap.html) | ``` d3.heatmap() ``` | [D3Blocks](https://medium.com/data-science-collective/d3blocks-the-sweet-spot-for-data-scientists-interactive-charts-without-deployment-friction-c7f576025510) |
|
|
59
|
+
| 8 | [Chord diagram](https://d3blocks.github.io/d3blocks/Chord.html) | ``` d3.chord() ``` | [D3Blocks](https://medium.com/data-science-collective/d3blocks-the-sweet-spot-for-data-scientists-interactive-charts-without-deployment-friction-c7f576025510) |
|
|
60
|
+
| 9 | [Timeseries](https://d3blocks.github.io/d3blocks/Timeseries.html) | ``` d3.timeseries() ``` | [D3Blocks](https://medium.com/data-science-collective/d3blocks-the-sweet-spot-for-data-scientists-interactive-charts-without-deployment-friction-c7f576025510) |
|
|
61
|
+
| 10 | [Image slider](https://d3blocks.github.io/d3blocks/Imageslider.html) | ``` d3.imageslider() ``` | [D3Blocks](https://medium.com/data-science-collective/d3blocks-the-sweet-spot-for-data-scientists-interactive-charts-without-deployment-friction-c7f576025510) |
|
|
62
|
+
| 11 | [Violin plot](https://d3blocks.github.io/d3blocks/Violin.html) | ``` d3.violin() ``` | [D3Blocks](https://medium.com/data-science-collective/d3blocks-the-sweet-spot-for-data-scientists-interactive-charts-without-deployment-friction-c7f576025510) |
|
|
63
|
+
| 12 | [Particles](https://d3blocks.github.io/d3blocks/Particles.html) | ``` d3.particles() ``` | [D3Blocks](https://medium.com/data-science-collective/d3blocks-the-sweet-spot-for-data-scientists-interactive-charts-without-deployment-friction-c7f576025510) |
|
|
64
|
+
| 13 | [Treemap](https://d3blocks.github.io/d3blocks/Treemap.html) | ``` d3.treemap() ``` | [D3Blocks](https://medium.com/data-science-collective/d3blocks-the-sweet-spot-for-data-scientists-interactive-charts-without-deployment-friction-c7f576025510) |
|
|
65
|
+
| 14 | [Tree](https://d3blocks.github.io/d3blocks/Tree.html) | ``` d3.tree() ``` | [D3Blocks](https://medium.com/data-science-collective/d3blocks-the-sweet-spot-for-data-scientists-interactive-charts-without-deployment-friction-c7f576025510) |
|
|
66
|
+
| 15 | [Maps](https://d3blocks.github.io/d3blocks/Maps.html) | ``` d3.maps() ``` | [D3Blocks](https://medium.com/data-science-collective/d3blocks-the-sweet-spot-for-data-scientists-interactive-charts-without-deployment-friction-c7f576025510) |
|
|
67
|
+
| 16 | [Circlepacking](https://d3blocks.github.io/d3blocks/Circlepacking.html) | ``` d3.circlepacking() ``` | [D3Blocks](https://medium.com/data-science-collective/d3blocks-the-sweet-spot-for-data-scientists-interactive-charts-without-deployment-friction-c7f576025510) |
|
|
68
|
+
| 17 | [Flowgraph](https://d3blocks.github.io/d3blocks/Flowgraph.html) | ``` d3.flowgraph() ``` | [Dagre](https://github.com/dagrejs/dagre) |
|
|
69
|
+
|
|
70
|
+
-------------------------------------------------------------------------
|
|
71
|
+
|
|
72
|
+
#### Installation (Pypi)
|
|
73
|
+
```bash
|
|
74
|
+
pip install d3blocks # Normal installation
|
|
75
|
+
pip install -U d3blocks # Force update
|
|
76
|
+
```
|
|
77
|
+
|
|
78
|
+
#### Installation (clone)
|
|
79
|
+
```bash
|
|
80
|
+
git clone https://github.com/d3blocks/d3blocks.git
|
|
81
|
+
cd d3blocks
|
|
82
|
+
pip install -U .
|
|
83
|
+
```
|
|
84
|
+
|
|
85
|
+
#### Import d3blocks package
|
|
86
|
+
```python
|
|
87
|
+
from d3blocks import D3Blocks
|
|
88
|
+
# Initialize
|
|
89
|
+
d3 = D3Blocks()
|
|
90
|
+
```
|
|
91
|
+
|
|
92
|
+
|
|
93
|
+
---
|
|
94
|
+
|
|
95
|
+
### D3Blocks💙Streamlit
|
|
96
|
+
Every chart from D3Block can easily be incorporated into a Streamlit Dashboard. Because every D3Blocks chart is just HTML and JavaScript, you can generate the HTML in memory and embed it
|
|
97
|
+
A few practical rules of thumb: prefer `st.iframe` over the older `components.html` for full interactive charts, always pass an explicit pixel height, and set `show_side_panel=False` when Streamlit already owns the controls so the UI doesn't duplicate. `color_background='streamlit'` picks backgrounds that match a typical Streamlit light or dark page.
|
|
98
|
+
|
|
99
|
+
* [Minimal examples for each chart can be found in the Streamlit directory in the repo](https://github.com/d3blocks/d3blocks/tree/main/streamlit).
|
|
100
|
+
* [More Streamlit documentation can be found here.](https://d3blocks.github.io/d3blocks/Streamlit.html)
|
|
101
|
+
|
|
102
|
+
---
|
|
103
|
+
|
|
104
|
+
### Ethical Ads
|
|
105
|
+
When HTMLs are generated, it automatically includes ethical ads as a small way to support development.
|
|
106
|
+
I maintain this entire project thoughtfully and in my free time. Ads can be disabled via an input parameter, and you can also support the project with a coffee donation instead.
|
|
107
|
+
|
|
108
|
+
### Star history
|
|
109
|
+
[](https://star-history.dera.page/d3blocks/d3blocks)
|
|
110
|
+
|
|
111
|
+
### References
|
|
112
|
+
* [bl.ocks](https://bl.ocks.org/)
|
|
113
|
+
* [observablehq](https://observablehq.com/top)
|
|
114
|
+
|
|
115
|
+
### Contributors
|
|
116
|
+
|
|
117
|
+
<p align="left">
|
|
118
|
+
<a href="https://github.com/d3blocks/d3blocks/graphs/contributors">
|
|
119
|
+
<img src="https://contrib.rocks/image?repo=d3blocks/d3blocks" />
|
|
120
|
+
</a>
|
|
121
|
+
</p>
|
|
122
|
+
|
|
123
|
+
### Maintainer
|
|
124
|
+
* Erdogan Taskesen, github: [erdogant](https://github.com/erdogant)
|
|
125
|
+
* Contributions are welcome.
|
|
126
|
+
* Yes! This library is entirely **free** but it runs on coffee! :) Feel free to support with a <a href="https://erdogant.github.io/donate/?currency=USD&amount=5">Coffee</a>.
|
|
127
|
+
|
|
128
|
+
[](https://www.buymeacoffee.com/erdogant)
|
|
@@ -30,6 +30,7 @@ try:
|
|
|
30
30
|
import d3blocks.circlepacking.Circlepacking as Circlepacking
|
|
31
31
|
import d3blocks.tree.Tree as Tree
|
|
32
32
|
import d3blocks.radialgraph.Radialgraph as Radialgraph
|
|
33
|
+
import d3blocks.flowgraph.Flowgraph as Flowgraph
|
|
33
34
|
import d3blocks.maps.Maps as Maps
|
|
34
35
|
import d3blocks.utils as utils
|
|
35
36
|
except:
|
|
@@ -49,6 +50,7 @@ except:
|
|
|
49
50
|
import circlepacking.Circlepacking as Circlepacking
|
|
50
51
|
import tree.Tree as Tree
|
|
51
52
|
import radialgraph.Radialgraph as Radialgraph
|
|
53
|
+
import flowgraph.Flowgraph as Flowgraph
|
|
52
54
|
import maps.Maps as Maps
|
|
53
55
|
import utils
|
|
54
56
|
# #####################################################
|
|
@@ -536,11 +538,13 @@ class D3Blocks():
|
|
|
536
538
|
size: list/array of with same size as (x,y).
|
|
537
539
|
Size of the samples.
|
|
538
540
|
color : list/array of hex colors with same size as (x,y)
|
|
541
|
+
|
|
539
542
|
* '#ffffff' : All dots are get the same hex color.
|
|
540
543
|
* None: The same color as for c is applied.
|
|
541
544
|
* ['#000000', '#ffffff',...]: list/array of hex colors with same size as (x,y)
|
|
542
545
|
stroke: list/array of hex colors with same size as (x,y)
|
|
543
546
|
Edgecolor of dotsize in hex colors.
|
|
547
|
+
|
|
544
548
|
* '#000000' : All dots are get the same hex color.
|
|
545
549
|
* ['#000000', '#ffffff',...]: list/array of hex colors with same size as (x,y)
|
|
546
550
|
c_gradient : String, (default: 'opaque')
|
|
@@ -2674,6 +2678,7 @@ class D3Blocks():
|
|
|
2674
2678
|
----------
|
|
2675
2679
|
df : pd.DataFrame()
|
|
2676
2680
|
Input data containing the following columns:
|
|
2681
|
+
|
|
2677
2682
|
* 'source', 'target', 'weight'
|
|
2678
2683
|
hierarchy : list
|
|
2679
2684
|
Expand or substract the hierarchical structure. No information is lossed. The eight branches are shown by default.
|
|
@@ -3075,6 +3080,220 @@ class D3Blocks():
|
|
|
3075
3080
|
if return_html:
|
|
3076
3081
|
return html
|
|
3077
3082
|
|
|
3083
|
+
def flowgraph(self,
|
|
3084
|
+
df,
|
|
3085
|
+
nodes=None,
|
|
3086
|
+
groups: dict = None,
|
|
3087
|
+
direction: str = None,
|
|
3088
|
+
layout: str = 'dagre',
|
|
3089
|
+
shape: str = 'process',
|
|
3090
|
+
color: str = 'group',
|
|
3091
|
+
cmap: str = 'Set2',
|
|
3092
|
+
edge_color: str = '#8c8c8c',
|
|
3093
|
+
nodesep: int = 40,
|
|
3094
|
+
ranksep: int = 70,
|
|
3095
|
+
edgesep: int = 20,
|
|
3096
|
+
ranker: str = 'network-simplex',
|
|
3097
|
+
curve: str = 'smooth',
|
|
3098
|
+
animate: bool = False,
|
|
3099
|
+
draggable: bool = True,
|
|
3100
|
+
show_edge_labels: bool = True,
|
|
3101
|
+
show_groups: bool = True,
|
|
3102
|
+
font: dict = {'size': 13},
|
|
3103
|
+
title: str = 'Flowgraph - D3blocks',
|
|
3104
|
+
filepath: str = 'flowgraph.html',
|
|
3105
|
+
figsize=[None, None],
|
|
3106
|
+
showfig: bool = True,
|
|
3107
|
+
overwrite: bool = True,
|
|
3108
|
+
notebook: bool = False,
|
|
3109
|
+
save_button: bool = True,
|
|
3110
|
+
show_side_panel: bool = True,
|
|
3111
|
+
show_top_panel: bool = True,
|
|
3112
|
+
dark_mode: bool = True,
|
|
3113
|
+
color_background=None,
|
|
3114
|
+
return_html: bool = False,
|
|
3115
|
+
reset_properties: bool = True):
|
|
3116
|
+
"""Flowgraph block: process flows and architecture diagrams.
|
|
3117
|
+
|
|
3118
|
+
Nodes are arranged in ranks along the flow direction with a layered
|
|
3119
|
+
layout, drawn as flowchart shapes and optionally nested in groups such as
|
|
3120
|
+
swimlanes, services or network boundaries. The input is either an edge
|
|
3121
|
+
list or a Mermaid flowchart.
|
|
3122
|
+
|
|
3123
|
+
Parameters
|
|
3124
|
+
----------
|
|
3125
|
+
df : pd.DataFrame, str or path-like
|
|
3126
|
+
* DataFrame with the edges. Required columns: 'source', 'target'.
|
|
3127
|
+
Optional columns: 'label' (edge text), 'weight' (line width),
|
|
3128
|
+
'variant', 'style' ('solid', 'dashed', 'dotted'), 'color' and 'animation'.
|
|
3129
|
+
* str: a Mermaid flowchart, e.g. 'flowchart LR; A[Start] --> B{Valid?}',
|
|
3130
|
+
or Markdown text containing a ```mermaid block.
|
|
3131
|
+
* Path to a Markdown file (.md, .markdown) with a ```mermaid block, so the
|
|
3132
|
+
same diagram renders on GitHub, or to a .mmd / .mermaid file.
|
|
3133
|
+
From Markdown, the first flowchart block is used.
|
|
3134
|
+
Node shapes, edge labels, dotted/thick links and (nested) subgraphs are
|
|
3135
|
+
converted; `nodes`, `groups` and `direction` override what it defines.
|
|
3136
|
+
nodes : pd.DataFrame or dict, (default: None)
|
|
3137
|
+
Per-node attributes keyed by node name (a 'name' column or the index):
|
|
3138
|
+
* 'label': display text; use '\\n' for line breaks.
|
|
3139
|
+
* 'shape': 'process', 'decision', 'terminal', 'io', 'subprocess',
|
|
3140
|
+
'database', 'queue', 'document', 'external' or 'circle'.
|
|
3141
|
+
* 'group': group (swimlane / boundary) the node belongs to.
|
|
3142
|
+
* 'color': node colour; overrides `color`.
|
|
3143
|
+
* 'tooltip': extra text or HTML shown on hover below the label.
|
|
3144
|
+
groups : dict, (default: None)
|
|
3145
|
+
Group settings: {group: {'label': str, 'parent': str, 'color': hex}}.
|
|
3146
|
+
Use 'parent' to nest groups (e.g. a subnet inside a VPC). The short form
|
|
3147
|
+
{group: parent} is also accepted.
|
|
3148
|
+
direction : str, (default: None)
|
|
3149
|
+
Flow direction: 'LR', 'TB' (or 'TD'), 'RL' or 'BT'. None: the direction
|
|
3150
|
+
of the Mermaid header, otherwise 'LR'.
|
|
3151
|
+
layout : str, (default: 'dagre')
|
|
3152
|
+
* 'dagre': layered layout with smooth edges; small output (~0.5 MB).
|
|
3153
|
+
* 'elk': ELK layered layout with orthogonal edge routing and native
|
|
3154
|
+
nested groups; tidier for architecture diagrams, adds ~1.5 MB to the HTML.
|
|
3155
|
+
shape : str, (default: 'process')
|
|
3156
|
+
Default shape for nodes without one.
|
|
3157
|
+
color : str, (default: 'group')
|
|
3158
|
+
* 'group': colour nodes by group.
|
|
3159
|
+
* 'shape': colour nodes by shape.
|
|
3160
|
+
* '#RRGGBB': one colour for all nodes.
|
|
3161
|
+
cmap : str, (default: 'Set2')
|
|
3162
|
+
Colormap for group / shape colouring.
|
|
3163
|
+
edge_color : str, (default: '#8c8c8c')
|
|
3164
|
+
Default edge colour.
|
|
3165
|
+
nodesep : int, (default: 40)
|
|
3166
|
+
Pixels between nodes in the same rank.
|
|
3167
|
+
ranksep : int, (default: 70)
|
|
3168
|
+
Pixels between ranks.
|
|
3169
|
+
edgesep : int, (default: 20)
|
|
3170
|
+
Pixels between parallel edges.
|
|
3171
|
+
ranker : str, (default: 'network-simplex')
|
|
3172
|
+
dagre ranking algorithm: 'network-simplex', 'tight-tree' or 'longest-path'.
|
|
3173
|
+
curve : str, (default: 'smooth')
|
|
3174
|
+
Edge shape: 'smooth' (curved, or rounded corners with ELK) or 'straight'.
|
|
3175
|
+
animate : bool, (default: False)
|
|
3176
|
+
Animate pulses along the edges to show the direction of flow.
|
|
3177
|
+
draggable : bool, (default: True)
|
|
3178
|
+
Nodes can be dragged; connected edges and groups follow.
|
|
3179
|
+
show_edge_labels : bool, (default: True)
|
|
3180
|
+
Draw edge labels.
|
|
3181
|
+
show_groups : bool, (default: True)
|
|
3182
|
+
Draw groups as containers (and keep their members together).
|
|
3183
|
+
font : dict, (default: {'size': 13})
|
|
3184
|
+
Font properties.
|
|
3185
|
+
title : str, (default: 'Flowgraph - D3blocks')
|
|
3186
|
+
Title of the figure.
|
|
3187
|
+
filepath : str, (default: 'flowgraph.html')
|
|
3188
|
+
File path to save the output. None: return HTML only.
|
|
3189
|
+
figsize : list, (default: [None, None])
|
|
3190
|
+
[width, height] in pixels. None: full window.
|
|
3191
|
+
showfig : bool, (default: True)
|
|
3192
|
+
Open the chart in the browser.
|
|
3193
|
+
overwrite : bool, (default: True)
|
|
3194
|
+
Overwrite an existing file.
|
|
3195
|
+
notebook : bool, (default: False)
|
|
3196
|
+
Display inline in a Jupyter notebook, isolated in an iframe sized by
|
|
3197
|
+
`figsize` (default: full width x 650 px). The returned HTML is then
|
|
3198
|
+
that iframe.
|
|
3199
|
+
save_button : bool, (default: True)
|
|
3200
|
+
Show the SVG/PNG save buttons.
|
|
3201
|
+
show_side_panel : bool, (default: True)
|
|
3202
|
+
Show the left side panels (Export / Save, Layout, Legend).
|
|
3203
|
+
show_top_panel : bool, (default: True)
|
|
3204
|
+
Show the top bar (logo, search, fit, theme).
|
|
3205
|
+
dark_mode : bool, (default: True)
|
|
3206
|
+
Start in the dark theme.
|
|
3207
|
+
color_background : list of str, str, or None, (default: None)
|
|
3208
|
+
Backgrounds for center / top / side panels as ``[dark_hex, light_hex]``.
|
|
3209
|
+
Named themes: ``'streamlit'``, ``'darkblue'``. None → ``['#222222', '#ffffff']``.
|
|
3210
|
+
return_html : bool, (default: False)
|
|
3211
|
+
Return the HTML string.
|
|
3212
|
+
reset_properties : bool, (default: True)
|
|
3213
|
+
Recompute node and edge properties from the input.
|
|
3214
|
+
|
|
3215
|
+
Returns
|
|
3216
|
+
-------
|
|
3217
|
+
d3.node_properties : DataFrame of dictionary
|
|
3218
|
+
Node properties; edit and call d3.show() to update.
|
|
3219
|
+
d3.edge_properties : DataFrame
|
|
3220
|
+
Edge properties; edit and call d3.show() to update.
|
|
3221
|
+
d3.config : dictionary
|
|
3222
|
+
Configuration. d3.config['groups'] holds the group settings (merged with
|
|
3223
|
+
Mermaid subgraphs); edit and call d3.show(). Labels, nesting and colours
|
|
3224
|
+
are resolved from it on every draw.
|
|
3225
|
+
|
|
3226
|
+
Examples
|
|
3227
|
+
--------
|
|
3228
|
+
>>> # Edge list with shapes and edge labels
|
|
3229
|
+
>>> import pandas as pd
|
|
3230
|
+
>>> from d3blocks import D3Blocks
|
|
3231
|
+
>>> d3 = D3Blocks(frame=False)
|
|
3232
|
+
>>> df = pd.DataFrame({'source': ['Start', 'Valid?', 'Valid?', 'Fix'],
|
|
3233
|
+
... 'target': ['Valid?', 'Done', 'Fix', 'Valid?'],
|
|
3234
|
+
... 'label': ['', 'yes', 'no', 'retry']})
|
|
3235
|
+
>>> nodes = {'Start': {'shape': 'terminal'}, 'Valid?': {'shape': 'decision'},
|
|
3236
|
+
... 'Done': {'shape': 'terminal'}}
|
|
3237
|
+
>>> d3.flowgraph(df, nodes=nodes, direction='TB')
|
|
3238
|
+
>>> # Change a node and redraw
|
|
3239
|
+
>>> d3.node_properties['Fix']['color'] = '#e15759'
|
|
3240
|
+
>>> d3.show()
|
|
3241
|
+
>>>
|
|
3242
|
+
>>> # Mermaid diagram kept in a Markdown file (renders on GitHub too)
|
|
3243
|
+
>>> d3.flowgraph('docs/process.md')
|
|
3244
|
+
>>>
|
|
3245
|
+
>>> # Mermaid flowchart with a subgraph, laid out with ELK
|
|
3246
|
+
>>> d3.flowgraph('''
|
|
3247
|
+
... flowchart LR
|
|
3248
|
+
... subgraph api [API]
|
|
3249
|
+
... gw[Gateway] --> svc[Orders]
|
|
3250
|
+
... end
|
|
3251
|
+
... svc --> db[(Postgres)]
|
|
3252
|
+
... svc -.->|events| q[[Worker]]
|
|
3253
|
+
... ''', layout='elk')
|
|
3254
|
+
|
|
3255
|
+
References
|
|
3256
|
+
----------
|
|
3257
|
+
* dagre: https://github.com/dagrejs/dagre
|
|
3258
|
+
* ELK: https://eclipse.dev/elk/
|
|
3259
|
+
* https://d3blocks.github.io/d3blocks/pages/html/Flowgraph.html
|
|
3260
|
+
|
|
3261
|
+
"""
|
|
3262
|
+
# Mermaid input (text, Markdown or file): convert to edges, nodes, groups and direction.
|
|
3263
|
+
if Flowgraph.is_mermaid_source(df):
|
|
3264
|
+
df, m_nodes, m_groups, m_direction = Flowgraph.from_mermaid(df, logger=logger)
|
|
3265
|
+
nodes = Flowgraph.merge_node_attributes(m_nodes, nodes)
|
|
3266
|
+
groups = Flowgraph.merge_group_attributes(m_groups, groups)
|
|
3267
|
+
direction = direction or m_direction
|
|
3268
|
+
direction = direction or 'LR'
|
|
3269
|
+
# Cleaning
|
|
3270
|
+
self._clean(clean_config=reset_properties, logger=logger)
|
|
3271
|
+
# Store chart
|
|
3272
|
+
self.chart = set_chart_func('Flowgraph', logger)
|
|
3273
|
+
# Store properties
|
|
3274
|
+
self.config = self.chart.set_config(
|
|
3275
|
+
config=self.config, font=font, title=title, filepath=filepath, figsize=figsize,
|
|
3276
|
+
showfig=showfig, overwrite=overwrite, notebook=notebook, direction=direction,
|
|
3277
|
+
layout=layout, nodesep=nodesep, ranksep=ranksep, edgesep=edgesep, ranker=ranker,
|
|
3278
|
+
curve=curve, animate=animate, draggable=draggable,
|
|
3279
|
+
show_edge_labels=show_edge_labels, show_groups=show_groups, groups=groups, cmap=cmap,
|
|
3280
|
+
color_background=color_background, dark_mode=dark_mode, save_button=save_button,
|
|
3281
|
+
show_side_panel=show_side_panel, show_top_panel=show_top_panel,
|
|
3282
|
+
reset_properties=reset_properties, logger=logger,
|
|
3283
|
+
)
|
|
3284
|
+
# Set default node properties
|
|
3285
|
+
if self.config['reset_properties'] or (not hasattr(self, 'node_properties')):
|
|
3286
|
+
self.set_node_properties(df, nodes=nodes, shape=shape, color=color, cmap=cmap, logger=logger)
|
|
3287
|
+
# Set edge properties
|
|
3288
|
+
self.set_edge_properties(df, edge_color=edge_color, logger=logger)
|
|
3289
|
+
|
|
3290
|
+
# Create the plot
|
|
3291
|
+
html = self.show()
|
|
3292
|
+
|
|
3293
|
+
# Return
|
|
3294
|
+
if return_html:
|
|
3295
|
+
return html
|
|
3296
|
+
|
|
3078
3297
|
def treemap(self,
|
|
3079
3298
|
df: pd.DataFrame,
|
|
3080
3299
|
margin = {"top": 40, "right": 10, "bottom": 10, "left": 10},
|
|
@@ -3490,6 +3709,7 @@ class D3Blocks():
|
|
|
3490
3709
|
Marker defaults (see previous docs). Used when building node properties.
|
|
3491
3710
|
countries : dict or None
|
|
3492
3711
|
Explicit country styling::
|
|
3712
|
+
|
|
3493
3713
|
{'World': {'color': '#D3D3D3', 'opacity': 0.6, 'line': 'none', 'linewidth': 1},
|
|
3494
3714
|
'Netherlands': {'color': '#000FFF', 'opacity': 0.8}}
|
|
3495
3715
|
Ignored when ``country_names`` is provided.
|
|
@@ -4199,7 +4419,7 @@ def set_chart_func(chart=None, logger=None):
|
|
|
4199
4419
|
if chart is not None:
|
|
4200
4420
|
if logger is not None: logger.info('Initializing [%s]' %(chart))
|
|
4201
4421
|
chart = str.capitalize(chart)
|
|
4202
|
-
if np.isin(chart, ['RadialGraph', 'Maps', 'Chord', 'Sankey', 'Timeseries', 'Violin', 'Movingbubbles', 'Scatter', 'Heatmap', 'Matrix', 'Treemap', 'Tree', 'Circlepacking', 'Radialgraph']):
|
|
4422
|
+
if np.isin(chart, ['RadialGraph', 'Maps', 'Chord', 'Sankey', 'Timeseries', 'Violin', 'Movingbubbles', 'Scatter', 'Heatmap', 'Matrix', 'Treemap', 'Tree', 'Circlepacking', 'Radialgraph', 'Flowgraph']):
|
|
4203
4423
|
chart=eval(chart)
|
|
4204
4424
|
else:
|
|
4205
4425
|
if logger is not None: logger.info('%s is not yet implemented in such manner.' %(chart))
|