curved-text 0.1.0__tar.gz
This diff represents the content of publicly available package versions that have been released to one of the supported registries. The information contained in this diff is provided for informational purposes only and reflects changes between package versions as they appear in their respective public registries.
- curved_text-0.1.0/LICENSE +21 -0
- curved_text-0.1.0/PKG-INFO +134 -0
- curved_text-0.1.0/README.md +101 -0
- curved_text-0.1.0/pyproject.toml +51 -0
- curved_text-0.1.0/setup.cfg +4 -0
- curved_text-0.1.0/src/curved_text/__init__.py +11 -0
- curved_text-0.1.0/src/curved_text/_core.py +176 -0
- curved_text-0.1.0/src/curved_text.egg-info/PKG-INFO +134 -0
- curved_text-0.1.0/src/curved_text.egg-info/SOURCES.txt +11 -0
- curved_text-0.1.0/src/curved_text.egg-info/dependency_links.txt +1 -0
- curved_text-0.1.0/src/curved_text.egg-info/requires.txt +9 -0
- curved_text-0.1.0/src/curved_text.egg-info/top_level.txt +1 -0
- curved_text-0.1.0/tests/test_core.py +188 -0
|
@@ -0,0 +1,21 @@
|
|
|
1
|
+
MIT License
|
|
2
|
+
|
|
3
|
+
Copyright (c) 2026 Joseph J. Thiebes
|
|
4
|
+
|
|
5
|
+
Permission is hereby granted, free of charge, to any person obtaining a copy
|
|
6
|
+
of this software and associated documentation files (the "Software"), to deal
|
|
7
|
+
in the Software without restriction, including without limitation the rights
|
|
8
|
+
to use, copy, modify, merge, publish, distribute, sublicense, and/or sell
|
|
9
|
+
copies of the Software, and to permit persons to whom the Software is
|
|
10
|
+
furnished to do so, subject to the following conditions:
|
|
11
|
+
|
|
12
|
+
The above copyright notice and this permission notice shall be included in all
|
|
13
|
+
copies or substantial portions of the Software.
|
|
14
|
+
|
|
15
|
+
THE SOFTWARE IS PROVIDED "AS IS", WITHOUT WARRANTY OF ANY KIND, EXPRESS OR
|
|
16
|
+
IMPLIED, INCLUDING BUT NOT LIMITED TO THE WARRANTIES OF MERCHANTABILITY,
|
|
17
|
+
FITNESS FOR A PARTICULAR PURPOSE AND NONINFRINGEMENT. IN NO EVENT SHALL THE
|
|
18
|
+
AUTHORS OR COPYRIGHT HOLDERS BE LIABLE FOR ANY CLAIM, DAMAGES OR OTHER
|
|
19
|
+
LIABILITY, WHETHER IN AN ACTION OF CONTRACT, TORT OR OTHERWISE, ARISING FROM,
|
|
20
|
+
OUT OF OR IN CONNECTION WITH THE SOFTWARE OR THE USE OR OTHER DEALINGS IN THE
|
|
21
|
+
SOFTWARE.
|
|
@@ -0,0 +1,134 @@
|
|
|
1
|
+
Metadata-Version: 2.4
|
|
2
|
+
Name: curved-text
|
|
3
|
+
Version: 0.1.0
|
|
4
|
+
Summary: Draw text along an arbitrary curve in matplotlib, with arc-length positioning and a perpendicular offset.
|
|
5
|
+
Author-email: Joseph Thiebes <joseph@thiebes.org>
|
|
6
|
+
License-Expression: MIT
|
|
7
|
+
Project-URL: Homepage, https://github.com/thiebes/curved-text
|
|
8
|
+
Project-URL: Source, https://github.com/thiebes/curved-text
|
|
9
|
+
Project-URL: Issues, https://github.com/thiebes/curved-text/issues
|
|
10
|
+
Project-URL: Changelog, https://github.com/thiebes/curved-text/blob/main/CHANGELOG.md
|
|
11
|
+
Keywords: matplotlib,text,annotation,label,curve,visualization
|
|
12
|
+
Classifier: Development Status :: 3 - Alpha
|
|
13
|
+
Classifier: Programming Language :: Python :: 3
|
|
14
|
+
Classifier: Programming Language :: Python :: 3.9
|
|
15
|
+
Classifier: Programming Language :: Python :: 3.10
|
|
16
|
+
Classifier: Programming Language :: Python :: 3.11
|
|
17
|
+
Classifier: Programming Language :: Python :: 3.12
|
|
18
|
+
Classifier: Programming Language :: Python :: 3.13
|
|
19
|
+
Classifier: Framework :: Matplotlib
|
|
20
|
+
Classifier: Topic :: Scientific/Engineering :: Visualization
|
|
21
|
+
Classifier: Intended Audience :: Science/Research
|
|
22
|
+
Requires-Python: >=3.9
|
|
23
|
+
Description-Content-Type: text/markdown
|
|
24
|
+
License-File: LICENSE
|
|
25
|
+
Requires-Dist: matplotlib>=3.5
|
|
26
|
+
Requires-Dist: numpy>=1.20
|
|
27
|
+
Provides-Extra: test
|
|
28
|
+
Requires-Dist: pytest>=7.0; extra == "test"
|
|
29
|
+
Provides-Extra: examples
|
|
30
|
+
Requires-Dist: seaborn>=0.11; extra == "examples"
|
|
31
|
+
Requires-Dist: pandas>=1.3; extra == "examples"
|
|
32
|
+
Dynamic: license-file
|
|
33
|
+
|
|
34
|
+
# curved-text
|
|
35
|
+
|
|
36
|
+
[](https://github.com/thiebes/curved-text/actions/workflows/ci.yml)
|
|
37
|
+
|
|
38
|
+
Draw text that follows an arbitrary curve in [matplotlib](https://matplotlib.org/).
|
|
39
|
+
|
|
40
|
+
|
|
41
|
+
|
|
42
|
+
Label curves along their own paths instead of in a legend, so the eye never
|
|
43
|
+
leaves the data to decode a colour key.
|
|
44
|
+
|
|
45
|
+
Each character is placed in display coordinates and rotated to the local tangent
|
|
46
|
+
of the curve, recomputed on every draw, so the label keeps following the curve
|
|
47
|
+
through layout, resizing, and interactive panning or zooming. Placement is
|
|
48
|
+
controlled by three independent parameters:
|
|
49
|
+
|
|
50
|
+
- `pos` -- where the label is anchored along the curve, as a fraction of arc
|
|
51
|
+
length (`0.0` = first point, `1.0` = last).
|
|
52
|
+
- `anchor` -- which part of the label lands at `pos`: `"start"`, `"center"`, or
|
|
53
|
+
`"end"`.
|
|
54
|
+
- `offset` -- a perpendicular shift off the curve, in typographic points, along
|
|
55
|
+
the normal of the label's chord (positive is above a left-to-right curve).
|
|
56
|
+
|
|
57
|
+
A label that overruns either end of the curve is not clipped: the curve is
|
|
58
|
+
extended along its end tangent and the overrunning glyphs sit on that straight
|
|
59
|
+
extension.
|
|
60
|
+
|
|
61
|
+
## Install
|
|
62
|
+
|
|
63
|
+
```bash
|
|
64
|
+
pip install curved-text
|
|
65
|
+
```
|
|
66
|
+
|
|
67
|
+
Or, from a clone, an editable install:
|
|
68
|
+
|
|
69
|
+
```bash
|
|
70
|
+
pip install -e .
|
|
71
|
+
```
|
|
72
|
+
|
|
73
|
+
## Usage
|
|
74
|
+
|
|
75
|
+
```python
|
|
76
|
+
import numpy as np
|
|
77
|
+
import matplotlib.pyplot as plt
|
|
78
|
+
from curved_text import curved_text
|
|
79
|
+
|
|
80
|
+
x = np.linspace(0, 2 * np.pi, 400)
|
|
81
|
+
y = np.sin(x)
|
|
82
|
+
|
|
83
|
+
fig, ax = plt.subplots()
|
|
84
|
+
ax.plot(x, y)
|
|
85
|
+
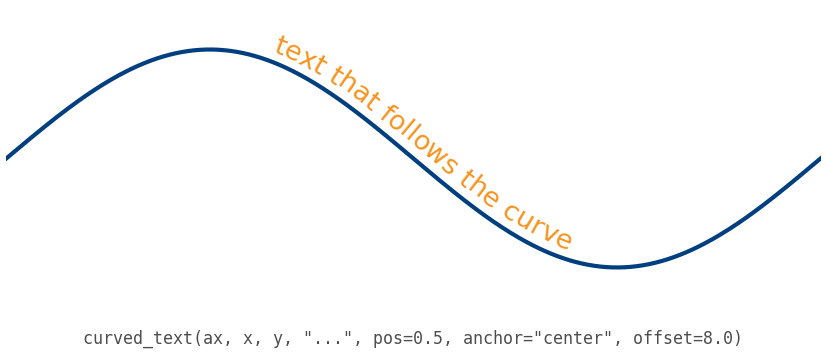
curved_text(ax, x, y, "text that follows the curve",
|
|
86
|
+
pos=0.5, anchor="center", offset=6.0, color="C3")
|
|
87
|
+
plt.show()
|
|
88
|
+
```
|
|
89
|
+
|
|
90
|
+
|
|
91
|
+
|
|
92
|
+
More worked examples -- the three placement controls, overrun behaviour, and
|
|
93
|
+
integration with seaborn and pandas -- are in [examples/](examples/README.md).
|
|
94
|
+
|
|
95
|
+
The object-oriented form is also available:
|
|
96
|
+
|
|
97
|
+
```python
|
|
98
|
+
from curved_text import CurvedText
|
|
99
|
+
|
|
100
|
+
CurvedText(x, y, "along the curve", ax, pos=0.2, anchor="start", offset=4.0)
|
|
101
|
+
```
|
|
102
|
+
|
|
103
|
+
Note the axes argument position: the `CurvedText` class takes it after `x, y,
|
|
104
|
+
text` (matching `matplotlib.text.Text`), while the `curved_text` function takes it
|
|
105
|
+
first (matching matplotlib's axes-first helper functions).
|
|
106
|
+
|
|
107
|
+
Any extra keyword arguments (`color`, `fontsize`, `alpha`, `fontfamily`, ...) are
|
|
108
|
+
passed through to each character's `matplotlib.text.Text`.
|
|
109
|
+
|
|
110
|
+
## Works with seaborn, pandas, and other matplotlib-backed libraries
|
|
111
|
+
|
|
112
|
+
`curved_text` needs a `matplotlib.axes.Axes`, so it works with any library that
|
|
113
|
+
draws on matplotlib. seaborn's axes-level functions return an `Axes`, its
|
|
114
|
+
figure-level functions expose one through `.axes`, and `pandas` `DataFrame.plot`
|
|
115
|
+
returns an `Axes` as well. Pass that axes in directly:
|
|
116
|
+
|
|
117
|
+
```python
|
|
118
|
+
import seaborn as sns
|
|
119
|
+
|
|
120
|
+
ax = sns.lineplot(data=df, x="x", y="y")
|
|
121
|
+
curved_text(ax, df["x"], df["y"], "along the curve",
|
|
122
|
+
pos=0.5, anchor="center", offset=6.0)
|
|
123
|
+
```
|
|
124
|
+
|
|
125
|
+
## Notes
|
|
126
|
+
|
|
127
|
+
- The curve `(x, y)` should be ordered along the curve (monotonic in arc length)
|
|
128
|
+
and have at least two points.
|
|
129
|
+
- Arc length and the offset are computed in display space, so spacing and the
|
|
130
|
+
offset are correct at any DPI and figure size.
|
|
131
|
+
|
|
132
|
+
## License
|
|
133
|
+
|
|
134
|
+
MIT
|
|
@@ -0,0 +1,101 @@
|
|
|
1
|
+
# curved-text
|
|
2
|
+
|
|
3
|
+
[](https://github.com/thiebes/curved-text/actions/workflows/ci.yml)
|
|
4
|
+
|
|
5
|
+
Draw text that follows an arbitrary curve in [matplotlib](https://matplotlib.org/).
|
|
6
|
+
|
|
7
|
+

|
|
8
|
+
|
|
9
|
+
Label curves along their own paths instead of in a legend, so the eye never
|
|
10
|
+
leaves the data to decode a colour key.
|
|
11
|
+
|
|
12
|
+
Each character is placed in display coordinates and rotated to the local tangent
|
|
13
|
+
of the curve, recomputed on every draw, so the label keeps following the curve
|
|
14
|
+
through layout, resizing, and interactive panning or zooming. Placement is
|
|
15
|
+
controlled by three independent parameters:
|
|
16
|
+
|
|
17
|
+
- `pos` -- where the label is anchored along the curve, as a fraction of arc
|
|
18
|
+
length (`0.0` = first point, `1.0` = last).
|
|
19
|
+
- `anchor` -- which part of the label lands at `pos`: `"start"`, `"center"`, or
|
|
20
|
+
`"end"`.
|
|
21
|
+
- `offset` -- a perpendicular shift off the curve, in typographic points, along
|
|
22
|
+
the normal of the label's chord (positive is above a left-to-right curve).
|
|
23
|
+
|
|
24
|
+
A label that overruns either end of the curve is not clipped: the curve is
|
|
25
|
+
extended along its end tangent and the overrunning glyphs sit on that straight
|
|
26
|
+
extension.
|
|
27
|
+
|
|
28
|
+
## Install
|
|
29
|
+
|
|
30
|
+
```bash
|
|
31
|
+
pip install curved-text
|
|
32
|
+
```
|
|
33
|
+
|
|
34
|
+
Or, from a clone, an editable install:
|
|
35
|
+
|
|
36
|
+
```bash
|
|
37
|
+
pip install -e .
|
|
38
|
+
```
|
|
39
|
+
|
|
40
|
+
## Usage
|
|
41
|
+
|
|
42
|
+
```python
|
|
43
|
+
import numpy as np
|
|
44
|
+
import matplotlib.pyplot as plt
|
|
45
|
+
from curved_text import curved_text
|
|
46
|
+
|
|
47
|
+
x = np.linspace(0, 2 * np.pi, 400)
|
|
48
|
+
y = np.sin(x)
|
|
49
|
+
|
|
50
|
+
fig, ax = plt.subplots()
|
|
51
|
+
ax.plot(x, y)
|
|
52
|
+
curved_text(ax, x, y, "text that follows the curve",
|
|
53
|
+
pos=0.5, anchor="center", offset=6.0, color="C3")
|
|
54
|
+
plt.show()
|
|
55
|
+
```
|
|
56
|
+
|
|
57
|
+

|
|
58
|
+
|
|
59
|
+
More worked examples -- the three placement controls, overrun behaviour, and
|
|
60
|
+
integration with seaborn and pandas -- are in [examples/](examples/README.md).
|
|
61
|
+
|
|
62
|
+
The object-oriented form is also available:
|
|
63
|
+
|
|
64
|
+
```python
|
|
65
|
+
from curved_text import CurvedText
|
|
66
|
+
|
|
67
|
+
CurvedText(x, y, "along the curve", ax, pos=0.2, anchor="start", offset=4.0)
|
|
68
|
+
```
|
|
69
|
+
|
|
70
|
+
Note the axes argument position: the `CurvedText` class takes it after `x, y,
|
|
71
|
+
text` (matching `matplotlib.text.Text`), while the `curved_text` function takes it
|
|
72
|
+
first (matching matplotlib's axes-first helper functions).
|
|
73
|
+
|
|
74
|
+
Any extra keyword arguments (`color`, `fontsize`, `alpha`, `fontfamily`, ...) are
|
|
75
|
+
passed through to each character's `matplotlib.text.Text`.
|
|
76
|
+
|
|
77
|
+
## Works with seaborn, pandas, and other matplotlib-backed libraries
|
|
78
|
+
|
|
79
|
+
`curved_text` needs a `matplotlib.axes.Axes`, so it works with any library that
|
|
80
|
+
draws on matplotlib. seaborn's axes-level functions return an `Axes`, its
|
|
81
|
+
figure-level functions expose one through `.axes`, and `pandas` `DataFrame.plot`
|
|
82
|
+
returns an `Axes` as well. Pass that axes in directly:
|
|
83
|
+
|
|
84
|
+
```python
|
|
85
|
+
import seaborn as sns
|
|
86
|
+
|
|
87
|
+
ax = sns.lineplot(data=df, x="x", y="y")
|
|
88
|
+
curved_text(ax, df["x"], df["y"], "along the curve",
|
|
89
|
+
pos=0.5, anchor="center", offset=6.0)
|
|
90
|
+
```
|
|
91
|
+
|
|
92
|
+
## Notes
|
|
93
|
+
|
|
94
|
+
- The curve `(x, y)` should be ordered along the curve (monotonic in arc length)
|
|
95
|
+
and have at least two points.
|
|
96
|
+
- Arc length and the offset are computed in display space, so spacing and the
|
|
97
|
+
offset are correct at any DPI and figure size.
|
|
98
|
+
|
|
99
|
+
## License
|
|
100
|
+
|
|
101
|
+
MIT
|
|
@@ -0,0 +1,51 @@
|
|
|
1
|
+
[build-system]
|
|
2
|
+
requires = ["setuptools>=77.0.0"]
|
|
3
|
+
build-backend = "setuptools.build_meta"
|
|
4
|
+
|
|
5
|
+
[project]
|
|
6
|
+
name = "curved-text"
|
|
7
|
+
version = "0.1.0"
|
|
8
|
+
description = "Draw text along an arbitrary curve in matplotlib, with arc-length positioning and a perpendicular offset."
|
|
9
|
+
readme = "README.md"
|
|
10
|
+
requires-python = ">=3.9"
|
|
11
|
+
license = "MIT"
|
|
12
|
+
license-files = ["LICENSE"]
|
|
13
|
+
authors = [{ name = "Joseph Thiebes", email = "joseph@thiebes.org" }]
|
|
14
|
+
keywords = ["matplotlib", "text", "annotation", "label", "curve", "visualization"]
|
|
15
|
+
classifiers = [
|
|
16
|
+
"Development Status :: 3 - Alpha",
|
|
17
|
+
"Programming Language :: Python :: 3",
|
|
18
|
+
"Programming Language :: Python :: 3.9",
|
|
19
|
+
"Programming Language :: Python :: 3.10",
|
|
20
|
+
"Programming Language :: Python :: 3.11",
|
|
21
|
+
"Programming Language :: Python :: 3.12",
|
|
22
|
+
"Programming Language :: Python :: 3.13",
|
|
23
|
+
"Framework :: Matplotlib",
|
|
24
|
+
"Topic :: Scientific/Engineering :: Visualization",
|
|
25
|
+
"Intended Audience :: Science/Research",
|
|
26
|
+
]
|
|
27
|
+
|
|
28
|
+
# Library dependencies use compatible lower bounds; a consuming application pins
|
|
29
|
+
# exact versions in its own lockfile.
|
|
30
|
+
dependencies = [
|
|
31
|
+
"matplotlib>=3.5",
|
|
32
|
+
"numpy>=1.20",
|
|
33
|
+
]
|
|
34
|
+
|
|
35
|
+
[project.optional-dependencies]
|
|
36
|
+
test = ["pytest>=7.0"]
|
|
37
|
+
# Extra renderers used only by the integration example (matplotlib is already a
|
|
38
|
+
# core dependency). Lower bounds, like the rest of the project.
|
|
39
|
+
examples = [
|
|
40
|
+
"seaborn>=0.11",
|
|
41
|
+
"pandas>=1.3",
|
|
42
|
+
]
|
|
43
|
+
|
|
44
|
+
[project.urls]
|
|
45
|
+
Homepage = "https://github.com/thiebes/curved-text"
|
|
46
|
+
Source = "https://github.com/thiebes/curved-text"
|
|
47
|
+
Issues = "https://github.com/thiebes/curved-text/issues"
|
|
48
|
+
Changelog = "https://github.com/thiebes/curved-text/blob/main/CHANGELOG.md"
|
|
49
|
+
|
|
50
|
+
[tool.setuptools.packages.find]
|
|
51
|
+
where = ["src"]
|
|
@@ -0,0 +1,11 @@
|
|
|
1
|
+
"""curved-text: draw text along an arbitrary curve in matplotlib."""
|
|
2
|
+
from importlib.metadata import PackageNotFoundError, version
|
|
3
|
+
|
|
4
|
+
from ._core import CurvedText, curved_text
|
|
5
|
+
|
|
6
|
+
__all__ = ["CurvedText", "curved_text"]
|
|
7
|
+
|
|
8
|
+
try:
|
|
9
|
+
__version__ = version("curved-text")
|
|
10
|
+
except PackageNotFoundError: # running from a source tree without an install
|
|
11
|
+
__version__ = "0.0.0"
|
|
@@ -0,0 +1,176 @@
|
|
|
1
|
+
"""Draw text along an arbitrary curve in a matplotlib Axes."""
|
|
2
|
+
from __future__ import annotations
|
|
3
|
+
|
|
4
|
+
from typing import TYPE_CHECKING, Any
|
|
5
|
+
|
|
6
|
+
import matplotlib.text as mtext
|
|
7
|
+
import numpy as np
|
|
8
|
+
|
|
9
|
+
if TYPE_CHECKING:
|
|
10
|
+
from matplotlib.axes import Axes
|
|
11
|
+
from numpy.typing import ArrayLike
|
|
12
|
+
|
|
13
|
+
__all__ = ["CurvedText", "curved_text"]
|
|
14
|
+
|
|
15
|
+
_ANCHORS = ("start", "center", "end")
|
|
16
|
+
|
|
17
|
+
|
|
18
|
+
class CurvedText(mtext.Text):
|
|
19
|
+
"""A string drawn along an (x, y) curve, one character at a time.
|
|
20
|
+
|
|
21
|
+
Each character is an independent :class:`matplotlib.text.Text`, centered
|
|
22
|
+
(``ha="center"``, ``va="center"``) on its own arc-length midpoint, placed in
|
|
23
|
+
display coordinates and rotated to the local tangent of the curve. The layout
|
|
24
|
+
is recomputed on every draw, so the label keeps following the curve through
|
|
25
|
+
figure layout, resizing, and interactive panning or zooming.
|
|
26
|
+
|
|
27
|
+
Placement has three independent controls:
|
|
28
|
+
|
|
29
|
+
``pos``
|
|
30
|
+
Where the label is anchored along the curve, as a fraction of the curve's
|
|
31
|
+
arc length: ``0.0`` is the first point, ``1.0`` is the last.
|
|
32
|
+
``anchor``
|
|
33
|
+
Which part of the label lands at ``pos``: ``"start"``, ``"center"``, or
|
|
34
|
+
``"end"``.
|
|
35
|
+
``offset``
|
|
36
|
+
A perpendicular shift off the curve, in typographic points, along the
|
|
37
|
+
normal of the label's chord (the line from its first to its last glyph).
|
|
38
|
+
Positive is to the left of the direction of travel, which is visually
|
|
39
|
+
above a left-to-right curve.
|
|
40
|
+
|
|
41
|
+
A label that overruns either end of the curve -- because of ``pos`` and
|
|
42
|
+
``anchor`` -- is not clipped. The curve is extended along its end tangent and
|
|
43
|
+
the overrunning glyphs are placed on that straight extension.
|
|
44
|
+
|
|
45
|
+
Parameters
|
|
46
|
+
----------
|
|
47
|
+
x, y : array-like
|
|
48
|
+
The curve in data coordinates: 1-D, equal length, at least two points,
|
|
49
|
+
finite, and ordered along the curve.
|
|
50
|
+
text : str
|
|
51
|
+
The string to draw.
|
|
52
|
+
axes : matplotlib.axes.Axes
|
|
53
|
+
The axes to draw into.
|
|
54
|
+
pos : float, default 0.5
|
|
55
|
+
Arc-length fraction in ``[0, 1]`` for the anchor point.
|
|
56
|
+
anchor : {"start", "center", "end"}, default "center"
|
|
57
|
+
Which part of the label sits at ``pos``.
|
|
58
|
+
offset : float, default 0.0
|
|
59
|
+
Perpendicular offset off the curve, in points.
|
|
60
|
+
**kwargs
|
|
61
|
+
Passed to each per-character :class:`~matplotlib.text.Text` (for example
|
|
62
|
+
``color``, ``fontsize``, ``alpha``, ``fontfamily``).
|
|
63
|
+
"""
|
|
64
|
+
|
|
65
|
+
def __init__(self, x: ArrayLike, y: ArrayLike, text: str, axes: Axes, *,
|
|
66
|
+
pos: float = 0.5, anchor: str = "center", offset: float = 0.0,
|
|
67
|
+
**kwargs: Any) -> None:
|
|
68
|
+
if anchor not in _ANCHORS:
|
|
69
|
+
raise ValueError(f"anchor must be one of {_ANCHORS}, got {anchor!r}")
|
|
70
|
+
x = np.asarray(x, dtype=float)
|
|
71
|
+
y = np.asarray(y, dtype=float)
|
|
72
|
+
if x.ndim != 1 or x.shape != y.shape or x.size < 2:
|
|
73
|
+
raise ValueError("x and y must be 1-D arrays of equal length >= 2")
|
|
74
|
+
if not (np.isfinite(x).all() and np.isfinite(y).all()):
|
|
75
|
+
raise ValueError("x and y must contain only finite values")
|
|
76
|
+
super().__init__(float(x[0]), float(y[0]), " ", **kwargs)
|
|
77
|
+
self._cx = x
|
|
78
|
+
self._cy = y
|
|
79
|
+
self._pos = float(pos)
|
|
80
|
+
self._anchor = anchor
|
|
81
|
+
self._offset = float(offset)
|
|
82
|
+
axes.add_artist(self)
|
|
83
|
+
self._chars: list[mtext.Text] = []
|
|
84
|
+
for ch in text:
|
|
85
|
+
t = mtext.Text(0.0, 0.0, " " if ch == " " else ch, **kwargs)
|
|
86
|
+
t.set_ha("center")
|
|
87
|
+
t.set_va("center")
|
|
88
|
+
axes.add_artist(t)
|
|
89
|
+
self._chars.append(t)
|
|
90
|
+
|
|
91
|
+
def set_zorder(self, zorder) -> None:
|
|
92
|
+
# Keep the glyphs one level above the container so they sit on top of it.
|
|
93
|
+
# ``super().__init__`` may set the zorder before ``_chars`` exists, so
|
|
94
|
+
# guard against running during base-class construction.
|
|
95
|
+
super().set_zorder(zorder)
|
|
96
|
+
for t in getattr(self, "_chars", ()):
|
|
97
|
+
t.set_zorder(self.get_zorder() + 1)
|
|
98
|
+
|
|
99
|
+
def remove(self) -> None:
|
|
100
|
+
# The glyphs are independent artists on the axes; remove them with the
|
|
101
|
+
# container so removal does not leave them behind as orphans.
|
|
102
|
+
for t in self._chars:
|
|
103
|
+
t.remove()
|
|
104
|
+
self._chars = []
|
|
105
|
+
super().remove()
|
|
106
|
+
|
|
107
|
+
def draw(self, renderer, *args, **kwargs) -> None:
|
|
108
|
+
if not self._chars:
|
|
109
|
+
return
|
|
110
|
+
axes = self.axes
|
|
111
|
+
# Work in display pixels: project the curve, accumulate cumulative arc
|
|
112
|
+
# length along it, and the tangent angle of each segment.
|
|
113
|
+
pts = axes.transData.transform(np.column_stack([self._cx, self._cy]))
|
|
114
|
+
xf, yf = pts[:, 0], pts[:, 1]
|
|
115
|
+
arc = np.insert(np.cumsum(np.hypot(np.diff(xf), np.diff(yf))), 0, 0.0)
|
|
116
|
+
if not np.isfinite(arc[-1]) or arc[-1] <= 0.0:
|
|
117
|
+
return
|
|
118
|
+
rads = np.arctan2(np.diff(yf), np.diff(xf))
|
|
119
|
+
inv = axes.transData.inverted()
|
|
120
|
+
|
|
121
|
+
# Reset any rotation left by the previous draw before measuring, so each
|
|
122
|
+
# width is the unrotated advance, not the wider rotated bounding box.
|
|
123
|
+
for t in self._chars:
|
|
124
|
+
t.set_rotation(0)
|
|
125
|
+
widths = [t.get_window_extent(renderer=renderer).width for t in self._chars]
|
|
126
|
+
total = float(sum(widths))
|
|
127
|
+
|
|
128
|
+
def _point(s):
|
|
129
|
+
# Position at arc length ``s``. ``i`` is the segment it falls in, which
|
|
130
|
+
# the caller also uses to read the local tangent ``rads[i]``. Clipping
|
|
131
|
+
# the index extrapolates past either end along the terminal segment.
|
|
132
|
+
i = int(np.clip(np.searchsorted(arc, s) - 1, 0, len(arc) - 2))
|
|
133
|
+
d = arc[i + 1] - arc[i]
|
|
134
|
+
f = (s - arc[i]) / d if d else 0.0
|
|
135
|
+
return i, xf[i] + f * (xf[i + 1] - xf[i]), yf[i] + f * (yf[i + 1] - yf[i])
|
|
136
|
+
|
|
137
|
+
s0 = self._pos * arc[-1]
|
|
138
|
+
if self._anchor == "center":
|
|
139
|
+
cursor = s0 - total / 2.0
|
|
140
|
+
elif self._anchor == "end":
|
|
141
|
+
cursor = s0 - total
|
|
142
|
+
else:
|
|
143
|
+
cursor = s0
|
|
144
|
+
|
|
145
|
+
# Offset the whole label along the normal of its chord (first to last
|
|
146
|
+
# glyph); ``_point`` extrapolates past the curve ends along their tangents.
|
|
147
|
+
_, x0, y0 = _point(cursor)
|
|
148
|
+
_, x1, y1 = _point(cursor + total)
|
|
149
|
+
dx, dy = x1 - x0, y1 - y0
|
|
150
|
+
norm = float(np.hypot(dx, dy))
|
|
151
|
+
nx, ny = (-dy / norm, dx / norm) if norm else (0.0, 1.0)
|
|
152
|
+
scale = self._offset * renderer.points_to_pixels(1.0)
|
|
153
|
+
ox, oy = nx * scale, ny * scale
|
|
154
|
+
|
|
155
|
+
# ``cursor`` walks the label's left edge along the arc; each glyph is
|
|
156
|
+
# centered on its own midpoint and rotated to the local tangent.
|
|
157
|
+
for t, w in zip(self._chars, widths):
|
|
158
|
+
i, px, py = _point(cursor + w / 2.0)
|
|
159
|
+
t.set_position(inv.transform((px + ox, py + oy)))
|
|
160
|
+
t.set_rotation(np.degrees(rads[i]))
|
|
161
|
+
t.set_visible(True)
|
|
162
|
+
cursor += w
|
|
163
|
+
|
|
164
|
+
|
|
165
|
+
def curved_text(ax: Axes, x: ArrayLike, y: ArrayLike, text: str, *,
|
|
166
|
+
pos: float = 0.5, anchor: str = "center", offset: float = 0.0,
|
|
167
|
+
**kwargs: Any) -> CurvedText:
|
|
168
|
+
"""Draw ``text`` along the curve ``(x, y)`` on ``ax`` and return the artist.
|
|
169
|
+
|
|
170
|
+
Thin convenience wrapper around :class:`CurvedText`; see it for the meaning of
|
|
171
|
+
``pos``, ``anchor``, and ``offset``. The axes is the first argument here,
|
|
172
|
+
matching matplotlib's axes-first helper functions, whereas :class:`CurvedText`
|
|
173
|
+
takes it after ``x, y, text`` to match :class:`matplotlib.text.Text`.
|
|
174
|
+
"""
|
|
175
|
+
return CurvedText(x, y, text, ax, pos=pos, anchor=anchor, offset=offset,
|
|
176
|
+
**kwargs)
|
|
@@ -0,0 +1,134 @@
|
|
|
1
|
+
Metadata-Version: 2.4
|
|
2
|
+
Name: curved-text
|
|
3
|
+
Version: 0.1.0
|
|
4
|
+
Summary: Draw text along an arbitrary curve in matplotlib, with arc-length positioning and a perpendicular offset.
|
|
5
|
+
Author-email: Joseph Thiebes <joseph@thiebes.org>
|
|
6
|
+
License-Expression: MIT
|
|
7
|
+
Project-URL: Homepage, https://github.com/thiebes/curved-text
|
|
8
|
+
Project-URL: Source, https://github.com/thiebes/curved-text
|
|
9
|
+
Project-URL: Issues, https://github.com/thiebes/curved-text/issues
|
|
10
|
+
Project-URL: Changelog, https://github.com/thiebes/curved-text/blob/main/CHANGELOG.md
|
|
11
|
+
Keywords: matplotlib,text,annotation,label,curve,visualization
|
|
12
|
+
Classifier: Development Status :: 3 - Alpha
|
|
13
|
+
Classifier: Programming Language :: Python :: 3
|
|
14
|
+
Classifier: Programming Language :: Python :: 3.9
|
|
15
|
+
Classifier: Programming Language :: Python :: 3.10
|
|
16
|
+
Classifier: Programming Language :: Python :: 3.11
|
|
17
|
+
Classifier: Programming Language :: Python :: 3.12
|
|
18
|
+
Classifier: Programming Language :: Python :: 3.13
|
|
19
|
+
Classifier: Framework :: Matplotlib
|
|
20
|
+
Classifier: Topic :: Scientific/Engineering :: Visualization
|
|
21
|
+
Classifier: Intended Audience :: Science/Research
|
|
22
|
+
Requires-Python: >=3.9
|
|
23
|
+
Description-Content-Type: text/markdown
|
|
24
|
+
License-File: LICENSE
|
|
25
|
+
Requires-Dist: matplotlib>=3.5
|
|
26
|
+
Requires-Dist: numpy>=1.20
|
|
27
|
+
Provides-Extra: test
|
|
28
|
+
Requires-Dist: pytest>=7.0; extra == "test"
|
|
29
|
+
Provides-Extra: examples
|
|
30
|
+
Requires-Dist: seaborn>=0.11; extra == "examples"
|
|
31
|
+
Requires-Dist: pandas>=1.3; extra == "examples"
|
|
32
|
+
Dynamic: license-file
|
|
33
|
+
|
|
34
|
+
# curved-text
|
|
35
|
+
|
|
36
|
+
[](https://github.com/thiebes/curved-text/actions/workflows/ci.yml)
|
|
37
|
+
|
|
38
|
+
Draw text that follows an arbitrary curve in [matplotlib](https://matplotlib.org/).
|
|
39
|
+
|
|
40
|
+

|
|
41
|
+
|
|
42
|
+
Label curves along their own paths instead of in a legend, so the eye never
|
|
43
|
+
leaves the data to decode a colour key.
|
|
44
|
+
|
|
45
|
+
Each character is placed in display coordinates and rotated to the local tangent
|
|
46
|
+
of the curve, recomputed on every draw, so the label keeps following the curve
|
|
47
|
+
through layout, resizing, and interactive panning or zooming. Placement is
|
|
48
|
+
controlled by three independent parameters:
|
|
49
|
+
|
|
50
|
+
- `pos` -- where the label is anchored along the curve, as a fraction of arc
|
|
51
|
+
length (`0.0` = first point, `1.0` = last).
|
|
52
|
+
- `anchor` -- which part of the label lands at `pos`: `"start"`, `"center"`, or
|
|
53
|
+
`"end"`.
|
|
54
|
+
- `offset` -- a perpendicular shift off the curve, in typographic points, along
|
|
55
|
+
the normal of the label's chord (positive is above a left-to-right curve).
|
|
56
|
+
|
|
57
|
+
A label that overruns either end of the curve is not clipped: the curve is
|
|
58
|
+
extended along its end tangent and the overrunning glyphs sit on that straight
|
|
59
|
+
extension.
|
|
60
|
+
|
|
61
|
+
## Install
|
|
62
|
+
|
|
63
|
+
```bash
|
|
64
|
+
pip install curved-text
|
|
65
|
+
```
|
|
66
|
+
|
|
67
|
+
Or, from a clone, an editable install:
|
|
68
|
+
|
|
69
|
+
```bash
|
|
70
|
+
pip install -e .
|
|
71
|
+
```
|
|
72
|
+
|
|
73
|
+
## Usage
|
|
74
|
+
|
|
75
|
+
```python
|
|
76
|
+
import numpy as np
|
|
77
|
+
import matplotlib.pyplot as plt
|
|
78
|
+
from curved_text import curved_text
|
|
79
|
+
|
|
80
|
+
x = np.linspace(0, 2 * np.pi, 400)
|
|
81
|
+
y = np.sin(x)
|
|
82
|
+
|
|
83
|
+
fig, ax = plt.subplots()
|
|
84
|
+
ax.plot(x, y)
|
|
85
|
+
curved_text(ax, x, y, "text that follows the curve",
|
|
86
|
+
pos=0.5, anchor="center", offset=6.0, color="C3")
|
|
87
|
+
plt.show()
|
|
88
|
+
```
|
|
89
|
+
|
|
90
|
+

|
|
91
|
+
|
|
92
|
+
More worked examples -- the three placement controls, overrun behaviour, and
|
|
93
|
+
integration with seaborn and pandas -- are in [examples/](examples/README.md).
|
|
94
|
+
|
|
95
|
+
The object-oriented form is also available:
|
|
96
|
+
|
|
97
|
+
```python
|
|
98
|
+
from curved_text import CurvedText
|
|
99
|
+
|
|
100
|
+
CurvedText(x, y, "along the curve", ax, pos=0.2, anchor="start", offset=4.0)
|
|
101
|
+
```
|
|
102
|
+
|
|
103
|
+
Note the axes argument position: the `CurvedText` class takes it after `x, y,
|
|
104
|
+
text` (matching `matplotlib.text.Text`), while the `curved_text` function takes it
|
|
105
|
+
first (matching matplotlib's axes-first helper functions).
|
|
106
|
+
|
|
107
|
+
Any extra keyword arguments (`color`, `fontsize`, `alpha`, `fontfamily`, ...) are
|
|
108
|
+
passed through to each character's `matplotlib.text.Text`.
|
|
109
|
+
|
|
110
|
+
## Works with seaborn, pandas, and other matplotlib-backed libraries
|
|
111
|
+
|
|
112
|
+
`curved_text` needs a `matplotlib.axes.Axes`, so it works with any library that
|
|
113
|
+
draws on matplotlib. seaborn's axes-level functions return an `Axes`, its
|
|
114
|
+
figure-level functions expose one through `.axes`, and `pandas` `DataFrame.plot`
|
|
115
|
+
returns an `Axes` as well. Pass that axes in directly:
|
|
116
|
+
|
|
117
|
+
```python
|
|
118
|
+
import seaborn as sns
|
|
119
|
+
|
|
120
|
+
ax = sns.lineplot(data=df, x="x", y="y")
|
|
121
|
+
curved_text(ax, df["x"], df["y"], "along the curve",
|
|
122
|
+
pos=0.5, anchor="center", offset=6.0)
|
|
123
|
+
```
|
|
124
|
+
|
|
125
|
+
## Notes
|
|
126
|
+
|
|
127
|
+
- The curve `(x, y)` should be ordered along the curve (monotonic in arc length)
|
|
128
|
+
and have at least two points.
|
|
129
|
+
- Arc length and the offset are computed in display space, so spacing and the
|
|
130
|
+
offset are correct at any DPI and figure size.
|
|
131
|
+
|
|
132
|
+
## License
|
|
133
|
+
|
|
134
|
+
MIT
|
|
@@ -0,0 +1,11 @@
|
|
|
1
|
+
LICENSE
|
|
2
|
+
README.md
|
|
3
|
+
pyproject.toml
|
|
4
|
+
src/curved_text/__init__.py
|
|
5
|
+
src/curved_text/_core.py
|
|
6
|
+
src/curved_text.egg-info/PKG-INFO
|
|
7
|
+
src/curved_text.egg-info/SOURCES.txt
|
|
8
|
+
src/curved_text.egg-info/dependency_links.txt
|
|
9
|
+
src/curved_text.egg-info/requires.txt
|
|
10
|
+
src/curved_text.egg-info/top_level.txt
|
|
11
|
+
tests/test_core.py
|
|
@@ -0,0 +1 @@
|
|
|
1
|
+
|
|
@@ -0,0 +1 @@
|
|
|
1
|
+
curved_text
|
|
@@ -0,0 +1,188 @@
|
|
|
1
|
+
"""Smoke and behaviour tests for curved_text.
|
|
2
|
+
|
|
3
|
+
The Agg backend is selected in conftest.py before pyplot is imported.
|
|
4
|
+
"""
|
|
5
|
+
import matplotlib.pyplot as plt
|
|
6
|
+
import numpy as np
|
|
7
|
+
import pytest
|
|
8
|
+
|
|
9
|
+
from curved_text import CurvedText, curved_text
|
|
10
|
+
|
|
11
|
+
|
|
12
|
+
def _draw(fig):
|
|
13
|
+
"""Force a draw so CurvedText positions its glyphs."""
|
|
14
|
+
fig.canvas.draw()
|
|
15
|
+
|
|
16
|
+
|
|
17
|
+
def test_places_one_artist_per_character():
|
|
18
|
+
fig, ax = plt.subplots()
|
|
19
|
+
x = np.linspace(0, 1, 50)
|
|
20
|
+
ct = curved_text(ax, x, np.sin(x), "abc", pos=0.5, anchor="center")
|
|
21
|
+
assert len(ct._chars) == 3
|
|
22
|
+
_draw(fig)
|
|
23
|
+
assert all(t.get_visible() for t in ct._chars)
|
|
24
|
+
plt.close(fig)
|
|
25
|
+
|
|
26
|
+
|
|
27
|
+
def test_anchor_shifts_label_along_curve():
|
|
28
|
+
# A straight horizontal curve so arc length maps to x directly.
|
|
29
|
+
fig, ax = plt.subplots()
|
|
30
|
+
ax.set_xlim(0, 10)
|
|
31
|
+
ax.set_ylim(0, 1)
|
|
32
|
+
x = np.linspace(0, 10, 100)
|
|
33
|
+
y = np.full_like(x, 0.5)
|
|
34
|
+
start = curved_text(ax, x, y, "word", pos=0.5, anchor="start")
|
|
35
|
+
end = curved_text(ax, x, y, "word", pos=0.5, anchor="end")
|
|
36
|
+
_draw(fig)
|
|
37
|
+
# "start" puts the text to the right of "end" at the same pos.
|
|
38
|
+
sx = np.mean([t.get_position()[0] for t in start._chars])
|
|
39
|
+
ex = np.mean([t.get_position()[0] for t in end._chars])
|
|
40
|
+
assert sx > ex
|
|
41
|
+
plt.close(fig)
|
|
42
|
+
|
|
43
|
+
|
|
44
|
+
def test_offset_moves_perpendicular():
|
|
45
|
+
fig, ax = plt.subplots()
|
|
46
|
+
ax.set_xlim(0, 10)
|
|
47
|
+
ax.set_ylim(0, 10)
|
|
48
|
+
x = np.linspace(0, 10, 100)
|
|
49
|
+
y = np.full_like(x, 5.0)
|
|
50
|
+
flat = curved_text(ax, x, y, "word", pos=0.5, anchor="center", offset=0.0)
|
|
51
|
+
lifted = curved_text(ax, x, y, "word", pos=0.5, anchor="center", offset=10.0)
|
|
52
|
+
_draw(fig)
|
|
53
|
+
fy = np.mean([t.get_position()[1] for t in flat._chars])
|
|
54
|
+
ly = np.mean([t.get_position()[1] for t in lifted._chars])
|
|
55
|
+
# Positive offset is above a left-to-right curve.
|
|
56
|
+
assert ly > fy
|
|
57
|
+
plt.close(fig)
|
|
58
|
+
|
|
59
|
+
|
|
60
|
+
def test_offset_is_dpi_invariant_in_points():
|
|
61
|
+
# The offset is specified in typographic points, so the same point value must
|
|
62
|
+
# produce the same data-space displacement regardless of figure DPI.
|
|
63
|
+
def displacement(dpi):
|
|
64
|
+
fig, ax = plt.subplots(dpi=dpi)
|
|
65
|
+
ax.set_xlim(0, 10)
|
|
66
|
+
ax.set_ylim(0, 10)
|
|
67
|
+
x = np.linspace(0, 10, 100)
|
|
68
|
+
y = np.full_like(x, 5.0)
|
|
69
|
+
flat = curved_text(ax, x, y, "word", pos=0.5, anchor="center", offset=0.0)
|
|
70
|
+
lifted = curved_text(ax, x, y, "word", pos=0.5, anchor="center",
|
|
71
|
+
offset=10.0)
|
|
72
|
+
_draw(fig)
|
|
73
|
+
fy = np.mean([t.get_position()[1] for t in flat._chars])
|
|
74
|
+
ly = np.mean([t.get_position()[1] for t in lifted._chars])
|
|
75
|
+
plt.close(fig)
|
|
76
|
+
return ly - fy
|
|
77
|
+
|
|
78
|
+
assert displacement(72) == pytest.approx(displacement(144), rel=0.02)
|
|
79
|
+
|
|
80
|
+
|
|
81
|
+
def test_overrun_is_not_clipped():
|
|
82
|
+
# Anchor the start of a long label past the right end of a short curve; the
|
|
83
|
+
# overrunning glyphs should ride the tangent extension, all still visible.
|
|
84
|
+
fig, ax = plt.subplots()
|
|
85
|
+
x = np.linspace(0, 1, 20)
|
|
86
|
+
ct = curved_text(ax, x, np.zeros_like(x), "a long label", pos=1.0,
|
|
87
|
+
anchor="start")
|
|
88
|
+
_draw(fig)
|
|
89
|
+
assert all(t.get_visible() for t in ct._chars)
|
|
90
|
+
plt.close(fig)
|
|
91
|
+
|
|
92
|
+
|
|
93
|
+
def test_left_overrun_is_not_clipped():
|
|
94
|
+
# The symmetric case: anchor the end of a long label before the left end of a
|
|
95
|
+
# short curve so the label rides the left tangent extension.
|
|
96
|
+
fig, ax = plt.subplots()
|
|
97
|
+
x = np.linspace(0, 1, 20)
|
|
98
|
+
ct = curved_text(ax, x, np.zeros_like(x), "a long label", pos=0.0,
|
|
99
|
+
anchor="end")
|
|
100
|
+
_draw(fig)
|
|
101
|
+
assert all(t.get_visible() for t in ct._chars)
|
|
102
|
+
plt.close(fig)
|
|
103
|
+
|
|
104
|
+
|
|
105
|
+
def test_degenerate_curve_does_not_raise():
|
|
106
|
+
# A curve whose points are all identical has zero arc length; drawing must
|
|
107
|
+
# short-circuit cleanly rather than raising.
|
|
108
|
+
fig, ax = plt.subplots()
|
|
109
|
+
x = np.full(10, 3.0)
|
|
110
|
+
y = np.full(10, 3.0)
|
|
111
|
+
ct = curved_text(ax, x, y, "abc", pos=0.5, anchor="center")
|
|
112
|
+
_draw(fig)
|
|
113
|
+
assert len(ct._chars) == 3
|
|
114
|
+
plt.close(fig)
|
|
115
|
+
|
|
116
|
+
|
|
117
|
+
def test_wrapper_matches_class():
|
|
118
|
+
# curved_text is a thin wrapper; for the same inputs the two forms must place
|
|
119
|
+
# glyphs identically despite the different argument order.
|
|
120
|
+
fig, ax = plt.subplots()
|
|
121
|
+
ax.set_xlim(0, 10)
|
|
122
|
+
ax.set_ylim(0, 1)
|
|
123
|
+
x = np.linspace(0, 10, 100)
|
|
124
|
+
y = np.full_like(x, 0.5)
|
|
125
|
+
via_fn = curved_text(ax, x, y, "word", pos=0.5, anchor="center")
|
|
126
|
+
via_cls = CurvedText(x, y, "word", ax, pos=0.5, anchor="center")
|
|
127
|
+
_draw(fig)
|
|
128
|
+
for a, b in zip(via_fn._chars, via_cls._chars):
|
|
129
|
+
assert a.get_position() == pytest.approx(b.get_position())
|
|
130
|
+
plt.close(fig)
|
|
131
|
+
|
|
132
|
+
|
|
133
|
+
def test_set_zorder_lifts_glyphs_above_container():
|
|
134
|
+
fig, ax = plt.subplots()
|
|
135
|
+
x = np.linspace(0, 1, 10)
|
|
136
|
+
ct = curved_text(ax, x, np.zeros_like(x), "ab", pos=0.5, anchor="center")
|
|
137
|
+
ct.set_zorder(5)
|
|
138
|
+
assert ct.get_zorder() == 5
|
|
139
|
+
assert all(t.get_zorder() == 6 for t in ct._chars)
|
|
140
|
+
plt.close(fig)
|
|
141
|
+
|
|
142
|
+
|
|
143
|
+
def test_remove_drops_child_glyphs():
|
|
144
|
+
fig, ax = plt.subplots()
|
|
145
|
+
x = np.linspace(0, 1, 10)
|
|
146
|
+
ct = curved_text(ax, x, np.zeros_like(x), "ab", pos=0.5, anchor="center")
|
|
147
|
+
chars = list(ct._chars)
|
|
148
|
+
ct.remove()
|
|
149
|
+
children = ax.get_children()
|
|
150
|
+
assert ct not in children
|
|
151
|
+
assert all(t not in children for t in chars)
|
|
152
|
+
plt.close(fig)
|
|
153
|
+
|
|
154
|
+
|
|
155
|
+
def test_redraw_is_idempotent():
|
|
156
|
+
# Layout is recomputed every draw; two draws of an unchanged figure must yield
|
|
157
|
+
# the same glyph positions.
|
|
158
|
+
fig, ax = plt.subplots()
|
|
159
|
+
ax.set_xlim(0, 10)
|
|
160
|
+
ax.set_ylim(0, 10)
|
|
161
|
+
x = np.linspace(0, 10, 100)
|
|
162
|
+
ct = curved_text(ax, x, np.sin(x) + 5.0, "stable", pos=0.5, anchor="center",
|
|
163
|
+
offset=8.0)
|
|
164
|
+
_draw(fig)
|
|
165
|
+
first = [t.get_position() for t in ct._chars]
|
|
166
|
+
_draw(fig)
|
|
167
|
+
second = [t.get_position() for t in ct._chars]
|
|
168
|
+
for a, b in zip(first, second):
|
|
169
|
+
assert a == pytest.approx(b)
|
|
170
|
+
plt.close(fig)
|
|
171
|
+
|
|
172
|
+
|
|
173
|
+
def test_validates_inputs():
|
|
174
|
+
fig, ax = plt.subplots()
|
|
175
|
+
with pytest.raises(ValueError):
|
|
176
|
+
CurvedText([0.0], [0.0], "x", ax) # too few points
|
|
177
|
+
with pytest.raises(ValueError):
|
|
178
|
+
CurvedText([0, 1], [0, 1], "x", ax, anchor="middle") # bad anchor
|
|
179
|
+
plt.close(fig)
|
|
180
|
+
|
|
181
|
+
|
|
182
|
+
def test_rejects_non_finite_input():
|
|
183
|
+
fig, ax = plt.subplots()
|
|
184
|
+
with pytest.raises(ValueError):
|
|
185
|
+
CurvedText([0.0, np.nan, 1.0], [0.0, 0.0, 0.0], "x", ax)
|
|
186
|
+
with pytest.raises(ValueError):
|
|
187
|
+
CurvedText([0.0, 1.0], [0.0, np.inf], "x", ax)
|
|
188
|
+
plt.close(fig)
|