camminady_matplotlib_theme 0.2.0__tar.gz
This diff represents the content of publicly available package versions that have been released to one of the supported registries. The information contained in this diff is provided for informational purposes only and reflects changes between package versions as they appear in their respective public registries.
- camminady_matplotlib_theme-0.2.0/.gitignore +176 -0
- camminady_matplotlib_theme-0.2.0/LICENSE +21 -0
- camminady_matplotlib_theme-0.2.0/PKG-INFO +177 -0
- camminady_matplotlib_theme-0.2.0/README.md +151 -0
- camminady_matplotlib_theme-0.2.0/pyproject.toml +57 -0
- camminady_matplotlib_theme-0.2.0/src/camminady_matplotlib_theme/__init__.py +47 -0
- camminady_matplotlib_theme-0.2.0/src/camminady_matplotlib_theme/camminady.mplstyle +85 -0
- camminady_matplotlib_theme-0.2.0/src/camminady_matplotlib_theme/camminady_dark.mplstyle +85 -0
- camminady_matplotlib_theme-0.2.0/src/camminady_matplotlib_theme/layout.py +242 -0
- camminady_matplotlib_theme-0.2.0/src/camminady_matplotlib_theme/py.typed +0 -0
- camminady_matplotlib_theme-0.2.0/src/camminady_matplotlib_theme/theme.py +286 -0
- camminady_matplotlib_theme-0.2.0/src/camminady_matplotlib_theme/ticks.py +127 -0
- camminady_matplotlib_theme-0.2.0/tests/test_theme.py +488 -0
|
@@ -0,0 +1,176 @@
|
|
|
1
|
+
# Byte-compiled / optimized / DLL files
|
|
2
|
+
__pycache__/
|
|
3
|
+
**/__pycache__/
|
|
4
|
+
*.py[cod]
|
|
5
|
+
*$py.class
|
|
6
|
+
.cache/
|
|
7
|
+
# C extensions
|
|
8
|
+
*.so
|
|
9
|
+
|
|
10
|
+
# Distribution / packaging
|
|
11
|
+
.Python
|
|
12
|
+
build/
|
|
13
|
+
develop-eggs/
|
|
14
|
+
dist/
|
|
15
|
+
downloads/
|
|
16
|
+
eggs/
|
|
17
|
+
.eggs/
|
|
18
|
+
lib/
|
|
19
|
+
lib64/
|
|
20
|
+
parts/
|
|
21
|
+
sdist/
|
|
22
|
+
var/
|
|
23
|
+
wheels/
|
|
24
|
+
share/python-wheels/
|
|
25
|
+
*.egg-info/
|
|
26
|
+
.installed.cfg
|
|
27
|
+
*.egg
|
|
28
|
+
MANIFEST
|
|
29
|
+
|
|
30
|
+
# PyInstaller
|
|
31
|
+
# Usually these files are written by a python script from a template
|
|
32
|
+
# before PyInstaller builds the exe, so as to inject date/other infos into it.
|
|
33
|
+
*.manifest
|
|
34
|
+
*.spec
|
|
35
|
+
|
|
36
|
+
# Installer logs
|
|
37
|
+
pip-log.txt
|
|
38
|
+
pip-delete-this-directory.txt
|
|
39
|
+
|
|
40
|
+
# Unit test / coverage reports
|
|
41
|
+
htmlcov/
|
|
42
|
+
.tox/
|
|
43
|
+
.nox/
|
|
44
|
+
.coverage
|
|
45
|
+
.coverage.*
|
|
46
|
+
.cache
|
|
47
|
+
nosetests.xml
|
|
48
|
+
coverage.xml
|
|
49
|
+
*.cover
|
|
50
|
+
*.py,cover
|
|
51
|
+
.hypothesis/
|
|
52
|
+
.pytest_cache/
|
|
53
|
+
cover/
|
|
54
|
+
|
|
55
|
+
# Translations
|
|
56
|
+
*.mo
|
|
57
|
+
*.pot
|
|
58
|
+
|
|
59
|
+
# Django stuff:
|
|
60
|
+
*.log
|
|
61
|
+
local_settings.py
|
|
62
|
+
db.sqlite3
|
|
63
|
+
db.sqlite3-journal
|
|
64
|
+
|
|
65
|
+
# Flask stuff:
|
|
66
|
+
instande/
|
|
67
|
+
.webassets-cache
|
|
68
|
+
|
|
69
|
+
# Scrapy stuff:
|
|
70
|
+
.scrapy
|
|
71
|
+
|
|
72
|
+
# Sphinx documentation
|
|
73
|
+
docs/_build/
|
|
74
|
+
|
|
75
|
+
# PyBuilder
|
|
76
|
+
.pybuilder/
|
|
77
|
+
target/
|
|
78
|
+
|
|
79
|
+
# Jupyter Notebook
|
|
80
|
+
.ipynb_checkpoints
|
|
81
|
+
|
|
82
|
+
# IPython
|
|
83
|
+
profile_default/
|
|
84
|
+
ipython_config.py
|
|
85
|
+
|
|
86
|
+
# pyenv
|
|
87
|
+
# For a library or package, you might want to ignore these files since the code is
|
|
88
|
+
# intended to run in multiple environments; otherwise, check them in:
|
|
89
|
+
# .python-version
|
|
90
|
+
|
|
91
|
+
# pipenv
|
|
92
|
+
# According to pypa/pipenv#598, it is recommended to include Pipfile.lock in version control.
|
|
93
|
+
# However, in case of collaboration, if having platform-specific dependencies or dependencies
|
|
94
|
+
# having no cross-platform support, pipenv may install dependencies that don't work, or not
|
|
95
|
+
# install all needed dependencies.
|
|
96
|
+
#Pipfile.lock
|
|
97
|
+
|
|
98
|
+
# poetry
|
|
99
|
+
# Similar to Pipfile.lock, it is generally recommended to include poetry.lock in version control.
|
|
100
|
+
# This is especially recommended for binary packages to ensure reproducibility, and is more
|
|
101
|
+
# commonly ignored for libraries.
|
|
102
|
+
# https://python-poetry.org/docs/basic-usage/#commit-your-poetrylock-file-to-version-control
|
|
103
|
+
#poetry.lock
|
|
104
|
+
|
|
105
|
+
# PEP 582; used by e.g. github.com/David-OConnor/pyflow
|
|
106
|
+
__pypackages__/
|
|
107
|
+
|
|
108
|
+
# Celery stuff
|
|
109
|
+
celerybeat-schedule
|
|
110
|
+
celerybeat.pid
|
|
111
|
+
|
|
112
|
+
# SageMath parsed files
|
|
113
|
+
*.sage.py
|
|
114
|
+
|
|
115
|
+
# Environments
|
|
116
|
+
.env
|
|
117
|
+
.venv
|
|
118
|
+
env/
|
|
119
|
+
venv/
|
|
120
|
+
ENV/
|
|
121
|
+
env.bak/
|
|
122
|
+
venv.bak/
|
|
123
|
+
|
|
124
|
+
# Spyder project settings
|
|
125
|
+
.spyderproject
|
|
126
|
+
.spyproject
|
|
127
|
+
|
|
128
|
+
# Rope project settings
|
|
129
|
+
.ropeproject
|
|
130
|
+
|
|
131
|
+
# mkdocs documentation
|
|
132
|
+
/site
|
|
133
|
+
|
|
134
|
+
# mypy
|
|
135
|
+
.mypy_cache/
|
|
136
|
+
.dmypy.json
|
|
137
|
+
dmypy.json
|
|
138
|
+
|
|
139
|
+
# Pyre type checker
|
|
140
|
+
.pyre/
|
|
141
|
+
|
|
142
|
+
# pytype static type analyzer
|
|
143
|
+
.pytype/
|
|
144
|
+
|
|
145
|
+
# Cython debug symbols
|
|
146
|
+
cython_debug/
|
|
147
|
+
|
|
148
|
+
# PyCharm
|
|
149
|
+
# JetBrains specific template is maintainted in a separate JetBrains.gitignore that can
|
|
150
|
+
# be found at https://github.com/github/gitignore/blob/main/Global/JetBrains.gitignore
|
|
151
|
+
# and can be added to the global gitignore or merged into this file. For a more nuclear
|
|
152
|
+
# option (not recommended) you can uncomment the following to ignore the entire idea folder.
|
|
153
|
+
#.idea/
|
|
154
|
+
|
|
155
|
+
|
|
156
|
+
# Images
|
|
157
|
+
*.png
|
|
158
|
+
*.jpg
|
|
159
|
+
|
|
160
|
+
*.pyc
|
|
161
|
+
|
|
162
|
+
notebooks/
|
|
163
|
+
Makefile
|
|
164
|
+
logs/
|
|
165
|
+
.venv/
|
|
166
|
+
.vscode/
|
|
167
|
+
.pytest_cache/
|
|
168
|
+
.ruff_cache/
|
|
169
|
+
.editorconfig
|
|
170
|
+
data/.gitkeep
|
|
171
|
+
data/
|
|
172
|
+
poetry.toml
|
|
173
|
+
ideation/
|
|
174
|
+
|
|
175
|
+
# pdoc output, built and deployed by the Docs workflow
|
|
176
|
+
/docs/
|
|
@@ -0,0 +1,21 @@
|
|
|
1
|
+
MIT License
|
|
2
|
+
|
|
3
|
+
Copyright (c) 2026, Thomas Camminady
|
|
4
|
+
|
|
5
|
+
Permission is hereby granted, free of charge, to any person obtaining a copy
|
|
6
|
+
of this software and associated documentation files (the "Software"), to deal
|
|
7
|
+
in the Software without restriction, including without limitation the rights
|
|
8
|
+
to use, copy, modify, merge, publish, distribute, sublicense, and/or sell
|
|
9
|
+
copies of the Software, and to permit persons to whom the Software is
|
|
10
|
+
furnished to do so, subject to the following conditions:
|
|
11
|
+
|
|
12
|
+
The above copyright notice and this permission notice shall be included in all
|
|
13
|
+
copies or substantial portions of the Software.
|
|
14
|
+
|
|
15
|
+
THE SOFTWARE IS PROVIDED "AS IS", WITHOUT WARRANTY OF ANY KIND, EXPRESS OR
|
|
16
|
+
IMPLIED, INCLUDING BUT NOT LIMITED TO THE WARRANTIES OF MERCHANTABILITY,
|
|
17
|
+
FITNESS FOR A PARTICULAR PURPOSE AND NONINFRINGEMENT. IN NO EVENT SHALL THE
|
|
18
|
+
AUTHORS OR COPYRIGHT HOLDERS BE LIABLE FOR ANY CLAIM, DAMAGES OR OTHER
|
|
19
|
+
LIABILITY, WHETHER IN AN ACTION OF CONTRACT, TORT OR OTHERWISE, ARISING FROM,
|
|
20
|
+
OUT OF OR IN CONNECTION WITH THE SOFTWARE OR THE USE OR OTHER DEALINGS IN THE
|
|
21
|
+
SOFTWARE.
|
|
@@ -0,0 +1,177 @@
|
|
|
1
|
+
Metadata-Version: 2.5
|
|
2
|
+
Name: camminady_matplotlib_theme
|
|
3
|
+
Version: 0.2.0
|
|
4
|
+
Summary: A minimal matplotlib style that matches camminady_altair_theme: muted gray text, dashed grid lines and horizontal axis titles.
|
|
5
|
+
Project-URL: Homepage, https://github.com/thomascamminady/camminady_matplotlib_theme
|
|
6
|
+
Project-URL: Documentation, https://camminady.dev/camminady_matplotlib_theme/
|
|
7
|
+
Project-URL: Repository, https://github.com/thomascamminady/camminady_matplotlib_theme
|
|
8
|
+
Project-URL: Issues, https://github.com/thomascamminady/camminady_matplotlib_theme/issues
|
|
9
|
+
Author-email: Thomas Camminady <0milieux_member@icloud.com>
|
|
10
|
+
License-Expression: MIT
|
|
11
|
+
License-File: LICENSE
|
|
12
|
+
Keywords: charts,matplotlib,style,theme,visualization
|
|
13
|
+
Classifier: Development Status :: 4 - Beta
|
|
14
|
+
Classifier: Framework :: Matplotlib
|
|
15
|
+
Classifier: Intended Audience :: Science/Research
|
|
16
|
+
Classifier: Programming Language :: Python :: 3
|
|
17
|
+
Classifier: Programming Language :: Python :: 3.11
|
|
18
|
+
Classifier: Programming Language :: Python :: 3.12
|
|
19
|
+
Classifier: Programming Language :: Python :: 3.13
|
|
20
|
+
Classifier: Programming Language :: Python :: 3.14
|
|
21
|
+
Classifier: Topic :: Scientific/Engineering :: Visualization
|
|
22
|
+
Classifier: Typing :: Typed
|
|
23
|
+
Requires-Python: >=3.11
|
|
24
|
+
Requires-Dist: matplotlib>=3.10
|
|
25
|
+
Description-Content-Type: text/markdown
|
|
26
|
+
|
|
27
|
+
# camminady_matplotlib_theme
|
|
28
|
+
|
|
29
|
+
A minimal [matplotlib](https://matplotlib.org) style that matches
|
|
30
|
+
[camminady_altair_theme](https://github.com/thomascamminady/camminady_altair_theme):
|
|
31
|
+
muted gray text, dashed grid lines, no frame around the plot, and horizontal
|
|
32
|
+
axis titles at the end of each axis. It comes in a light (`camminady`) and a
|
|
33
|
+
dark (`camminady_dark`) variant.
|
|
34
|
+
|
|
35
|
+
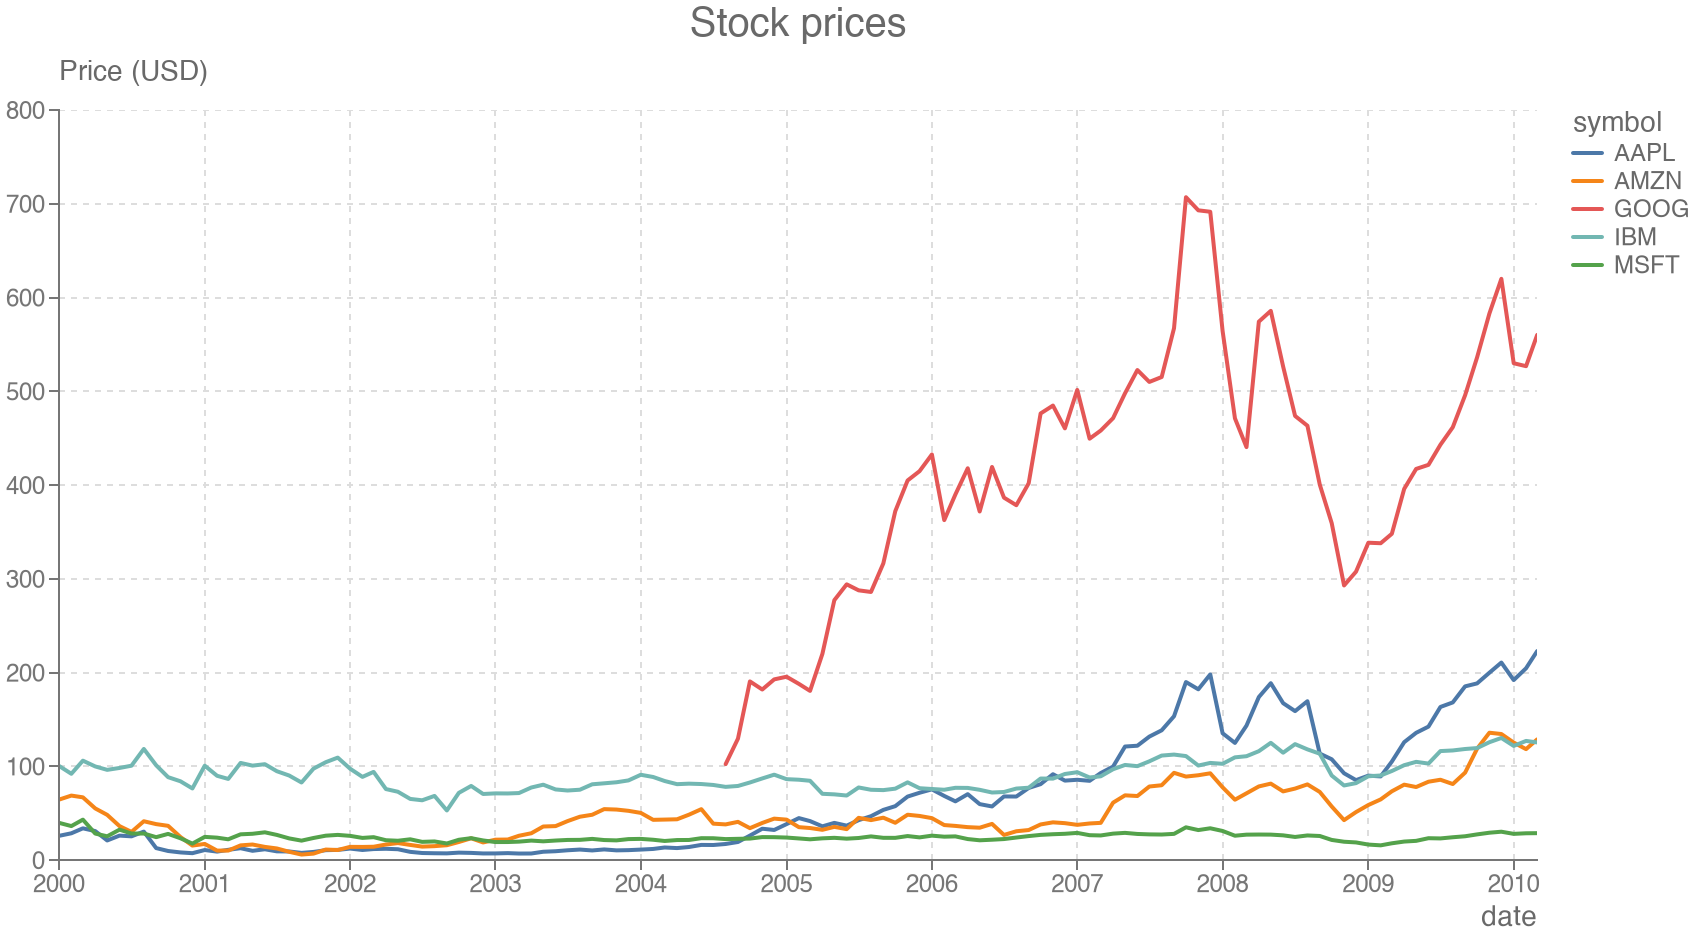
|
|
36
|
+
|
|
37
|
+
<!-- docs-start -->
|
|
38
|
+
|
|
39
|
+
## Installation
|
|
40
|
+
|
|
41
|
+
```bash
|
|
42
|
+
uv add camminady-matplotlib-theme
|
|
43
|
+
# or
|
|
44
|
+
pip install camminady-matplotlib-theme
|
|
45
|
+
```
|
|
46
|
+
|
|
47
|
+
Requires Python 3.11+ and matplotlib 3.10+.
|
|
48
|
+
|
|
49
|
+
## Usage
|
|
50
|
+
|
|
51
|
+
```python
|
|
52
|
+
import matplotlib.pyplot as plt
|
|
53
|
+
|
|
54
|
+
plt.style.use("camminady_matplotlib_theme.camminady") # or ".camminady_dark"
|
|
55
|
+
```
|
|
56
|
+
|
|
57
|
+
There is no need to import the package. After
|
|
58
|
+
`import camminady_matplotlib_theme`, the short names `"camminady"` and
|
|
59
|
+
`"camminady_dark"` work as well; importing does not apply a style.
|
|
60
|
+
|
|
61
|
+
To use the style for some figures only:
|
|
62
|
+
|
|
63
|
+
```python
|
|
64
|
+
with plt.style.context("camminady_matplotlib_theme.camminady"):
|
|
65
|
+
fig, ax = plt.subplots()
|
|
66
|
+
...
|
|
67
|
+
fig.savefig("chart.png")
|
|
68
|
+
```
|
|
69
|
+
|
|
70
|
+
## Example
|
|
71
|
+
|
|
72
|
+
A complete script that draws a line chart of stock prices. The data comes
|
|
73
|
+
from [vega_datasets](https://github.com/altair-viz/vega_datasets)
|
|
74
|
+
(`uv add vega_datasets`), which ships it, so the script runs offline.
|
|
75
|
+
|
|
76
|
+
```python
|
|
77
|
+
import matplotlib.pyplot as plt
|
|
78
|
+
from vega_datasets import data
|
|
79
|
+
|
|
80
|
+
plt.style.use("camminady_matplotlib_theme.camminady")
|
|
81
|
+
|
|
82
|
+
stocks = data.stocks()
|
|
83
|
+
fig, ax = plt.subplots()
|
|
84
|
+
for symbol, group in stocks.groupby("symbol"):
|
|
85
|
+
ax.plot(group["date"], group["price"], label=symbol)
|
|
86
|
+
ax.set(title="Stock prices", xlabel="date", ylabel="Price (USD)")
|
|
87
|
+
ax.legend(title="symbol")
|
|
88
|
+
fig.savefig("stock_prices.png")
|
|
89
|
+
```
|
|
90
|
+
|
|
91
|
+

|
|
92
|
+
|
|
93
|
+
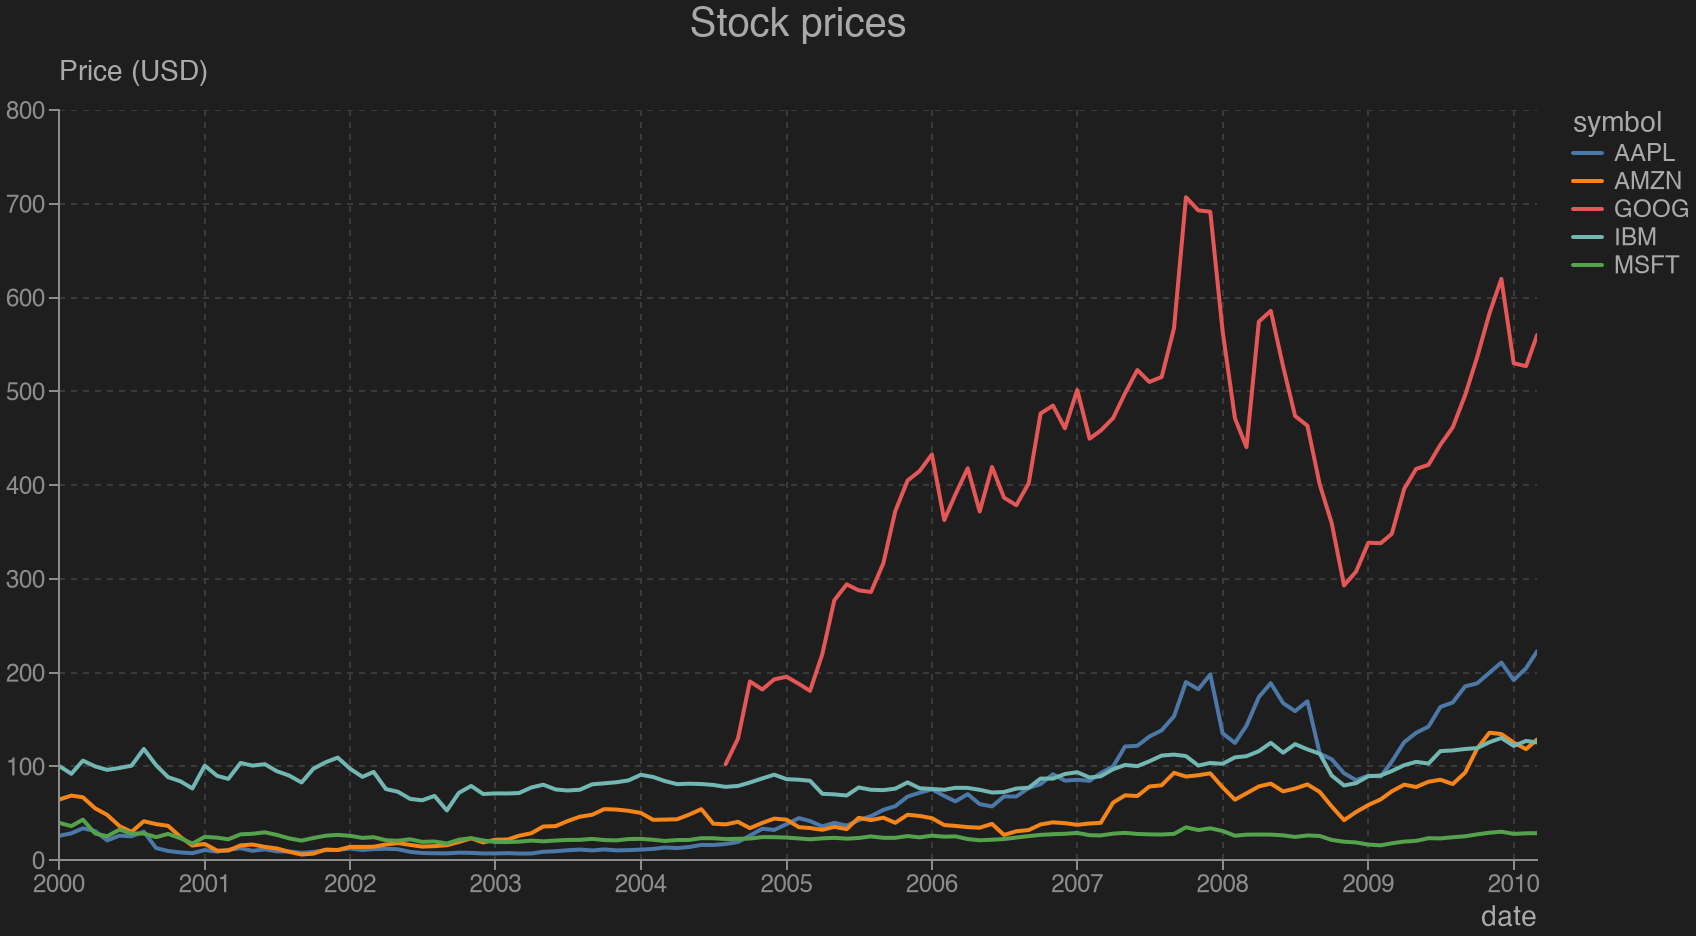
With `"camminady_matplotlib_theme.camminady_dark"`:
|
|
94
|
+
|
|
95
|
+
|
|
96
|
+
|
|
97
|
+
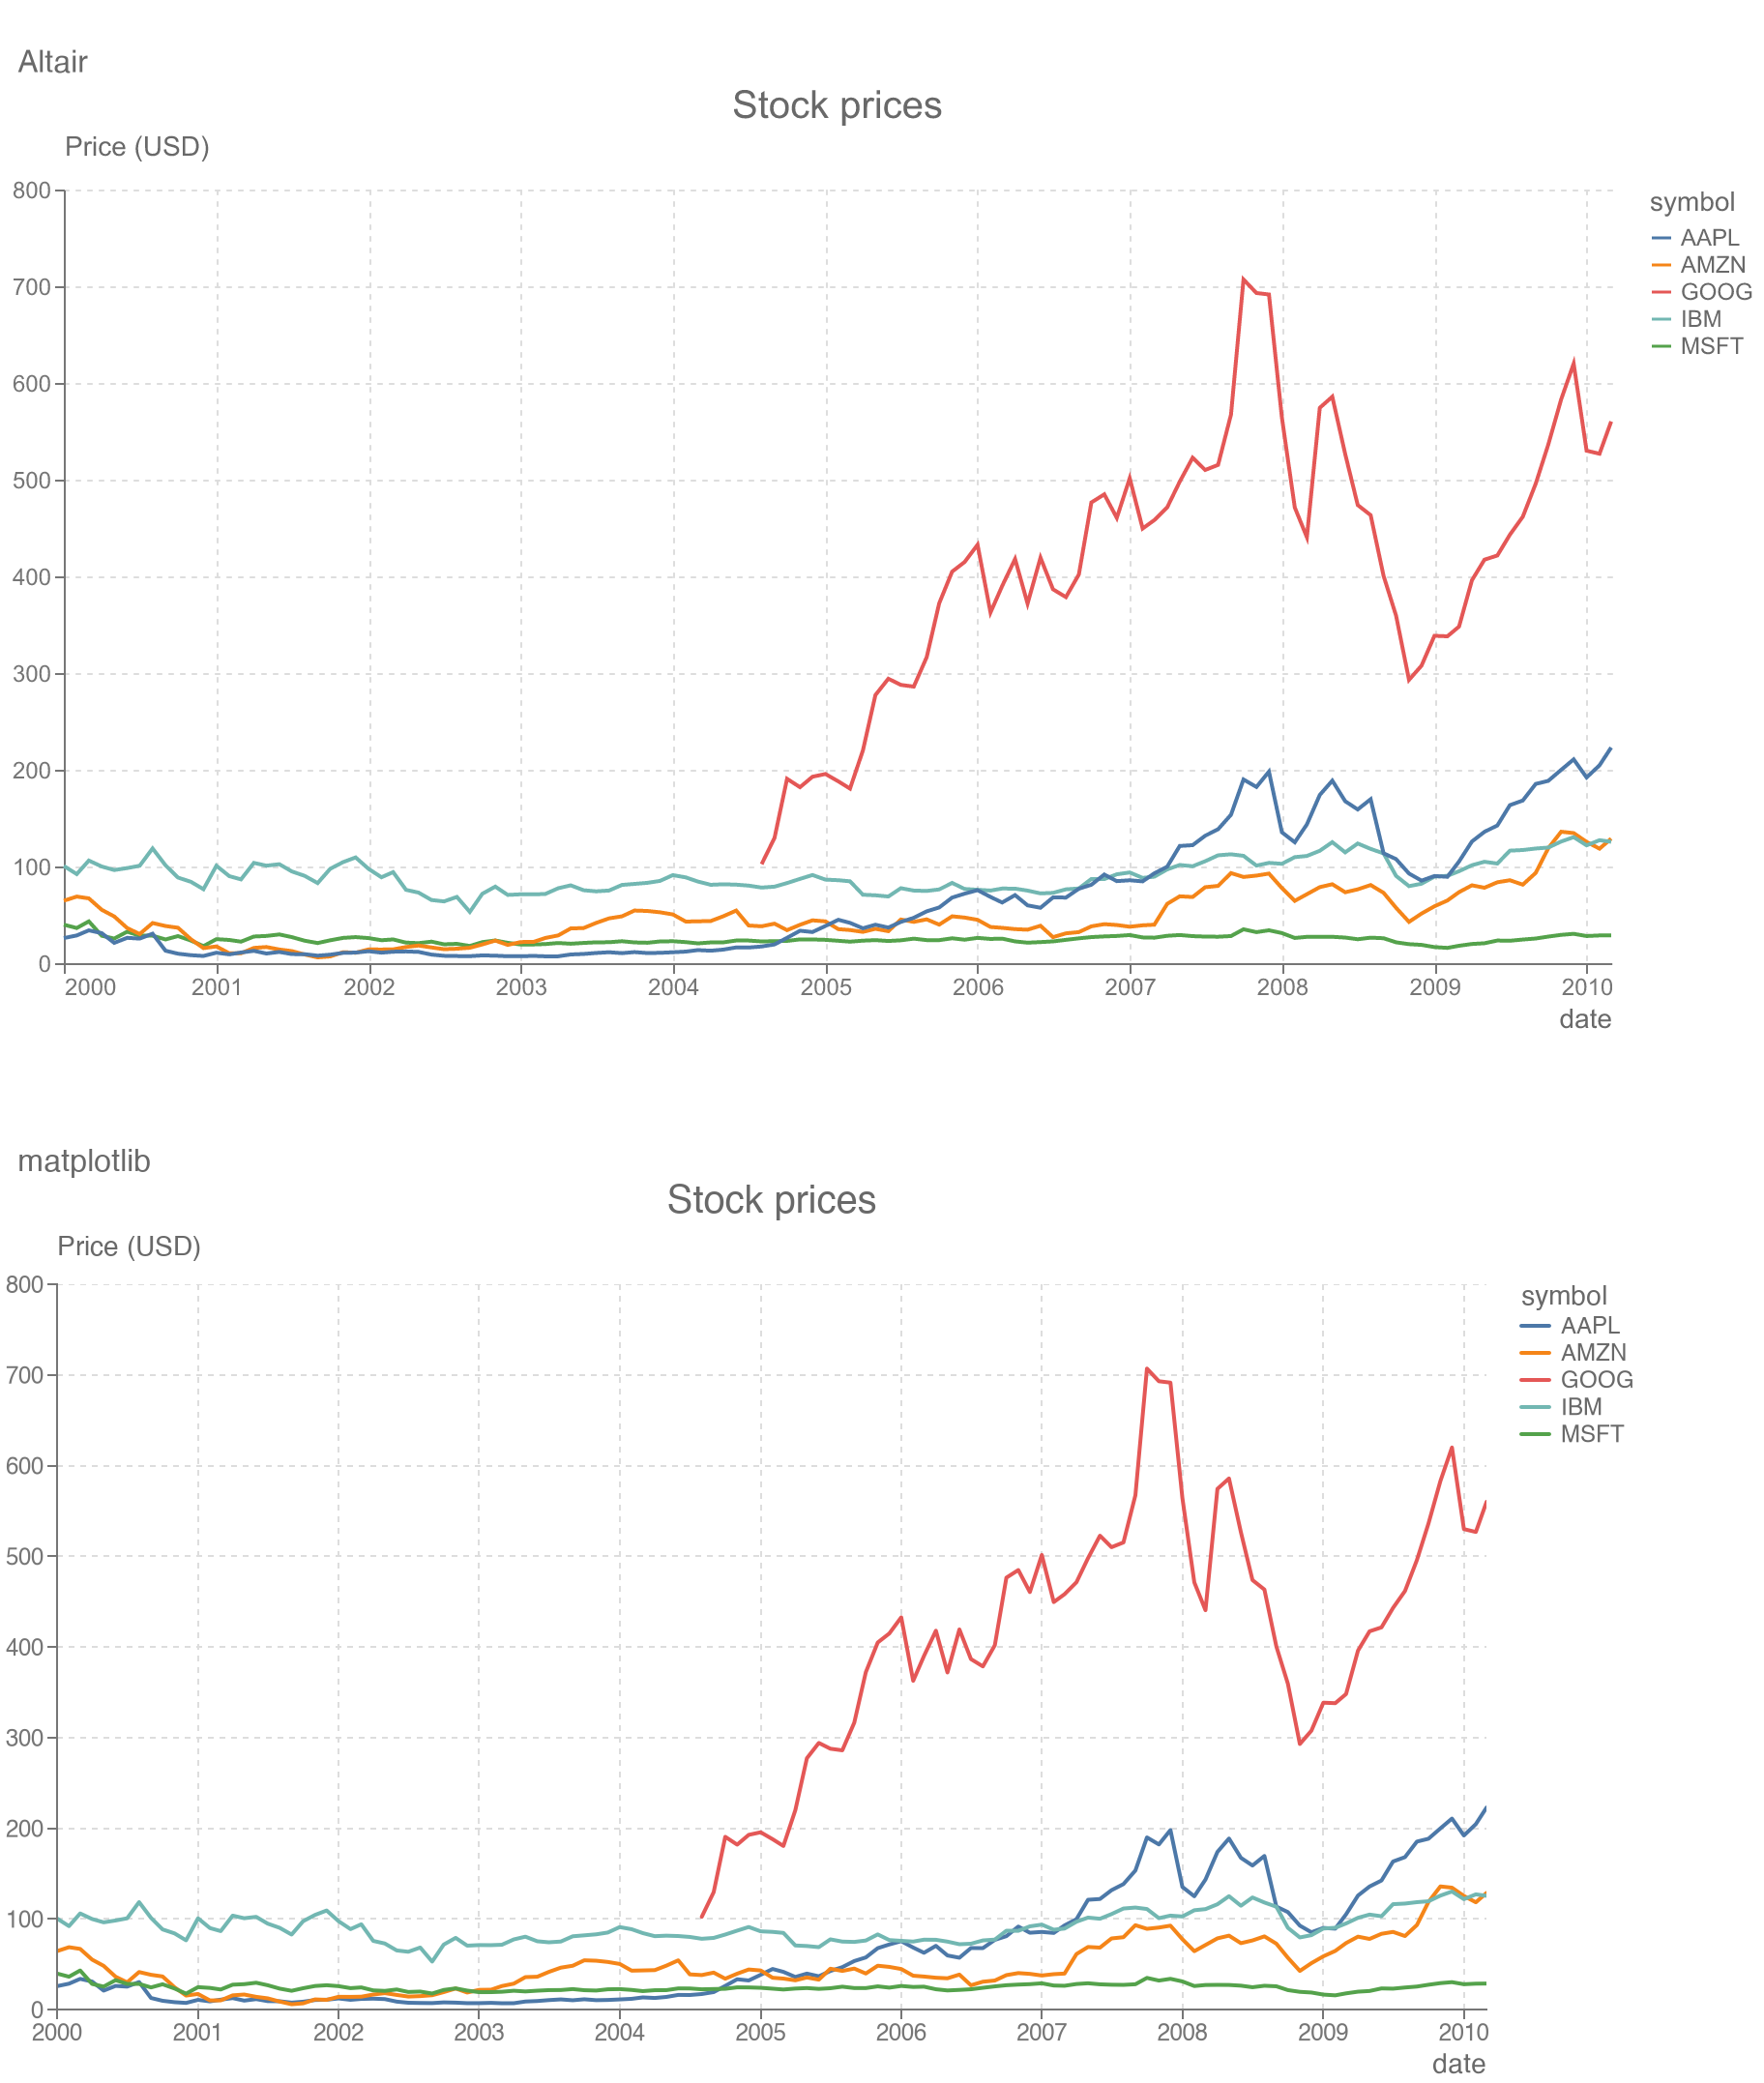
The same chart made with Altair and the Altair theme (top) and with this
|
|
98
|
+
style (bottom):
|
|
99
|
+
|
|
100
|
+
|
|
101
|
+
|
|
102
|
+
## Matching the Altair theme
|
|
103
|
+
|
|
104
|
+
The style uses the design tokens of the Altair theme (colours, font sizes and
|
|
105
|
+
the 800 × 400 plot area) and Vega's default colour palette. It sets
|
|
106
|
+
`figure.dpi` to 72 so that one point is one pixel on screen, as in Vega;
|
|
107
|
+
`savefig` writes at 288 dpi (four pixels per point), so saved PNGs stay sharp
|
|
108
|
+
when scaled up. Pass `dpi=` to `savefig` to override it.
|
|
109
|
+
|
|
110
|
+
Some of the look cannot be expressed in a style file. The style therefore
|
|
111
|
+
registers a figure hook that gives each figure created through pyplot a
|
|
112
|
+
constrained layout which, before drawing:
|
|
113
|
+
|
|
114
|
+
- turns the y-axis title horizontal and places it above the axis, aligned
|
|
115
|
+
with the axis line (titles of `ax.twinx()` go to the right end),
|
|
116
|
+
- moves the axes title above that y-axis title,
|
|
117
|
+
- places a legend outside the plot on the right, unless you pass a location
|
|
118
|
+
(`ax.legend(loc="lower right")` stays where you put it),
|
|
119
|
+
- places ticks and rounds axis limits like Vega: about one tick per 40
|
|
120
|
+
points, at multiples of 1, 2 or 5 times a power of ten,
|
|
121
|
+
- removes grid lines across categorical axes and images.
|
|
122
|
+
|
|
123
|
+
The hook leaves figures alone that use another layout
|
|
124
|
+
(`plt.subplots(layout="tight")`). For a figure created without pyplot, call
|
|
125
|
+
`camminady_matplotlib_theme.install(fig)`.
|
|
126
|
+
|
|
127
|
+
Two differences remain: Vega-Lite includes zero in quantitative axes and
|
|
128
|
+
draws points as hollow circles; matplotlib does neither by default.
|
|
129
|
+
|
|
130
|
+
## Customising
|
|
131
|
+
|
|
132
|
+
All colours, font sizes and the plot size are fields of `Config`, with the
|
|
133
|
+
same names and defaults as in the Altair theme:
|
|
134
|
+
|
|
135
|
+
```python
|
|
136
|
+
import matplotlib.pyplot as plt
|
|
137
|
+
from camminady_matplotlib_theme import Config, rc_params
|
|
138
|
+
|
|
139
|
+
plt.style.use(rc_params(Config(width=400, height=250)))
|
|
140
|
+
```
|
|
141
|
+
|
|
142
|
+
`to_mplstyle(rc_params(...))` returns the contents of a `.mplstyle` file.
|
|
143
|
+
|
|
144
|
+
## Colour-blind safety
|
|
145
|
+
|
|
146
|
+
The default palette is Vega's `tableau10`. Its third (red) and fifth (green)
|
|
147
|
+
colours are nearly indistinguishable for people with deuteranopia, so for five
|
|
148
|
+
or more categories use the bundled Okabe-Ito palette:
|
|
149
|
+
|
|
150
|
+
```python
|
|
151
|
+
from camminady_matplotlib_theme import OKABE_ITO
|
|
152
|
+
|
|
153
|
+
ax.set_prop_cycle(color=OKABE_ITO)
|
|
154
|
+
```
|
|
155
|
+
|
|
156
|
+
## Development
|
|
157
|
+
|
|
158
|
+
```bash
|
|
159
|
+
uv sync
|
|
160
|
+
uv run pytest
|
|
161
|
+
uv run ruff check . && uv run ruff format --check .
|
|
162
|
+
uv run ty check
|
|
163
|
+
uv run python create_charts.py # regenerate the images above
|
|
164
|
+
```
|
|
165
|
+
|
|
166
|
+
The `.mplstyle` files are generated from `Config`; after changing a token,
|
|
167
|
+
rewrite them with:
|
|
168
|
+
|
|
169
|
+
```bash
|
|
170
|
+
uv run python -c "
|
|
171
|
+
from importlib.resources import files
|
|
172
|
+
from camminady_matplotlib_theme import theme
|
|
173
|
+
for name, c in {'camminady': theme.config, 'camminady_dark': theme.config_dark}.items():
|
|
174
|
+
(files('camminady_matplotlib_theme') / f'{name}.mplstyle').write_text(
|
|
175
|
+
theme.to_mplstyle(theme.rc_params(c)))
|
|
176
|
+
"
|
|
177
|
+
```
|
|
@@ -0,0 +1,151 @@
|
|
|
1
|
+
# camminady_matplotlib_theme
|
|
2
|
+
|
|
3
|
+
A minimal [matplotlib](https://matplotlib.org) style that matches
|
|
4
|
+
[camminady_altair_theme](https://github.com/thomascamminady/camminady_altair_theme):
|
|
5
|
+
muted gray text, dashed grid lines, no frame around the plot, and horizontal
|
|
6
|
+
axis titles at the end of each axis. It comes in a light (`camminady`) and a
|
|
7
|
+
dark (`camminady_dark`) variant.
|
|
8
|
+
|
|
9
|
+

|
|
10
|
+
|
|
11
|
+
<!-- docs-start -->
|
|
12
|
+
|
|
13
|
+
## Installation
|
|
14
|
+
|
|
15
|
+
```bash
|
|
16
|
+
uv add camminady-matplotlib-theme
|
|
17
|
+
# or
|
|
18
|
+
pip install camminady-matplotlib-theme
|
|
19
|
+
```
|
|
20
|
+
|
|
21
|
+
Requires Python 3.11+ and matplotlib 3.10+.
|
|
22
|
+
|
|
23
|
+
## Usage
|
|
24
|
+
|
|
25
|
+
```python
|
|
26
|
+
import matplotlib.pyplot as plt
|
|
27
|
+
|
|
28
|
+
plt.style.use("camminady_matplotlib_theme.camminady") # or ".camminady_dark"
|
|
29
|
+
```
|
|
30
|
+
|
|
31
|
+
There is no need to import the package. After
|
|
32
|
+
`import camminady_matplotlib_theme`, the short names `"camminady"` and
|
|
33
|
+
`"camminady_dark"` work as well; importing does not apply a style.
|
|
34
|
+
|
|
35
|
+
To use the style for some figures only:
|
|
36
|
+
|
|
37
|
+
```python
|
|
38
|
+
with plt.style.context("camminady_matplotlib_theme.camminady"):
|
|
39
|
+
fig, ax = plt.subplots()
|
|
40
|
+
...
|
|
41
|
+
fig.savefig("chart.png")
|
|
42
|
+
```
|
|
43
|
+
|
|
44
|
+
## Example
|
|
45
|
+
|
|
46
|
+
A complete script that draws a line chart of stock prices. The data comes
|
|
47
|
+
from [vega_datasets](https://github.com/altair-viz/vega_datasets)
|
|
48
|
+
(`uv add vega_datasets`), which ships it, so the script runs offline.
|
|
49
|
+
|
|
50
|
+
```python
|
|
51
|
+
import matplotlib.pyplot as plt
|
|
52
|
+
from vega_datasets import data
|
|
53
|
+
|
|
54
|
+
plt.style.use("camminady_matplotlib_theme.camminady")
|
|
55
|
+
|
|
56
|
+
stocks = data.stocks()
|
|
57
|
+
fig, ax = plt.subplots()
|
|
58
|
+
for symbol, group in stocks.groupby("symbol"):
|
|
59
|
+
ax.plot(group["date"], group["price"], label=symbol)
|
|
60
|
+
ax.set(title="Stock prices", xlabel="date", ylabel="Price (USD)")
|
|
61
|
+
ax.legend(title="symbol")
|
|
62
|
+
fig.savefig("stock_prices.png")
|
|
63
|
+
```
|
|
64
|
+
|
|
65
|
+

|
|
66
|
+
|
|
67
|
+
With `"camminady_matplotlib_theme.camminady_dark"`:
|
|
68
|
+
|
|
69
|
+

|
|
70
|
+
|
|
71
|
+
The same chart made with Altair and the Altair theme (top) and with this
|
|
72
|
+
style (bottom):
|
|
73
|
+
|
|
74
|
+

|
|
75
|
+
|
|
76
|
+
## Matching the Altair theme
|
|
77
|
+
|
|
78
|
+
The style uses the design tokens of the Altair theme (colours, font sizes and
|
|
79
|
+
the 800 × 400 plot area) and Vega's default colour palette. It sets
|
|
80
|
+
`figure.dpi` to 72 so that one point is one pixel on screen, as in Vega;
|
|
81
|
+
`savefig` writes at 288 dpi (four pixels per point), so saved PNGs stay sharp
|
|
82
|
+
when scaled up. Pass `dpi=` to `savefig` to override it.
|
|
83
|
+
|
|
84
|
+
Some of the look cannot be expressed in a style file. The style therefore
|
|
85
|
+
registers a figure hook that gives each figure created through pyplot a
|
|
86
|
+
constrained layout which, before drawing:
|
|
87
|
+
|
|
88
|
+
- turns the y-axis title horizontal and places it above the axis, aligned
|
|
89
|
+
with the axis line (titles of `ax.twinx()` go to the right end),
|
|
90
|
+
- moves the axes title above that y-axis title,
|
|
91
|
+
- places a legend outside the plot on the right, unless you pass a location
|
|
92
|
+
(`ax.legend(loc="lower right")` stays where you put it),
|
|
93
|
+
- places ticks and rounds axis limits like Vega: about one tick per 40
|
|
94
|
+
points, at multiples of 1, 2 or 5 times a power of ten,
|
|
95
|
+
- removes grid lines across categorical axes and images.
|
|
96
|
+
|
|
97
|
+
The hook leaves figures alone that use another layout
|
|
98
|
+
(`plt.subplots(layout="tight")`). For a figure created without pyplot, call
|
|
99
|
+
`camminady_matplotlib_theme.install(fig)`.
|
|
100
|
+
|
|
101
|
+
Two differences remain: Vega-Lite includes zero in quantitative axes and
|
|
102
|
+
draws points as hollow circles; matplotlib does neither by default.
|
|
103
|
+
|
|
104
|
+
## Customising
|
|
105
|
+
|
|
106
|
+
All colours, font sizes and the plot size are fields of `Config`, with the
|
|
107
|
+
same names and defaults as in the Altair theme:
|
|
108
|
+
|
|
109
|
+
```python
|
|
110
|
+
import matplotlib.pyplot as plt
|
|
111
|
+
from camminady_matplotlib_theme import Config, rc_params
|
|
112
|
+
|
|
113
|
+
plt.style.use(rc_params(Config(width=400, height=250)))
|
|
114
|
+
```
|
|
115
|
+
|
|
116
|
+
`to_mplstyle(rc_params(...))` returns the contents of a `.mplstyle` file.
|
|
117
|
+
|
|
118
|
+
## Colour-blind safety
|
|
119
|
+
|
|
120
|
+
The default palette is Vega's `tableau10`. Its third (red) and fifth (green)
|
|
121
|
+
colours are nearly indistinguishable for people with deuteranopia, so for five
|
|
122
|
+
or more categories use the bundled Okabe-Ito palette:
|
|
123
|
+
|
|
124
|
+
```python
|
|
125
|
+
from camminady_matplotlib_theme import OKABE_ITO
|
|
126
|
+
|
|
127
|
+
ax.set_prop_cycle(color=OKABE_ITO)
|
|
128
|
+
```
|
|
129
|
+
|
|
130
|
+
## Development
|
|
131
|
+
|
|
132
|
+
```bash
|
|
133
|
+
uv sync
|
|
134
|
+
uv run pytest
|
|
135
|
+
uv run ruff check . && uv run ruff format --check .
|
|
136
|
+
uv run ty check
|
|
137
|
+
uv run python create_charts.py # regenerate the images above
|
|
138
|
+
```
|
|
139
|
+
|
|
140
|
+
The `.mplstyle` files are generated from `Config`; after changing a token,
|
|
141
|
+
rewrite them with:
|
|
142
|
+
|
|
143
|
+
```bash
|
|
144
|
+
uv run python -c "
|
|
145
|
+
from importlib.resources import files
|
|
146
|
+
from camminady_matplotlib_theme import theme
|
|
147
|
+
for name, c in {'camminady': theme.config, 'camminady_dark': theme.config_dark}.items():
|
|
148
|
+
(files('camminady_matplotlib_theme') / f'{name}.mplstyle').write_text(
|
|
149
|
+
theme.to_mplstyle(theme.rc_params(c)))
|
|
150
|
+
"
|
|
151
|
+
```
|
|
@@ -0,0 +1,57 @@
|
|
|
1
|
+
[project]
|
|
2
|
+
name = "camminady_matplotlib_theme"
|
|
3
|
+
version = "0.2.0"
|
|
4
|
+
description = "A minimal matplotlib style that matches camminady_altair_theme: muted gray text, dashed grid lines and horizontal axis titles."
|
|
5
|
+
authors = [
|
|
6
|
+
{ name = "Thomas Camminady", email = "0milieux_member@icloud.com" }
|
|
7
|
+
]
|
|
8
|
+
readme = "README.md"
|
|
9
|
+
license = "MIT"
|
|
10
|
+
license-files = ["LICENSE"]
|
|
11
|
+
keywords = ["matplotlib", "style", "theme", "visualization", "charts"]
|
|
12
|
+
classifiers = [
|
|
13
|
+
"Development Status :: 4 - Beta",
|
|
14
|
+
"Framework :: Matplotlib",
|
|
15
|
+
"Intended Audience :: Science/Research",
|
|
16
|
+
"Programming Language :: Python :: 3",
|
|
17
|
+
"Programming Language :: Python :: 3.11",
|
|
18
|
+
"Programming Language :: Python :: 3.12",
|
|
19
|
+
"Programming Language :: Python :: 3.13",
|
|
20
|
+
"Programming Language :: Python :: 3.14",
|
|
21
|
+
"Topic :: Scientific/Engineering :: Visualization",
|
|
22
|
+
"Typing :: Typed",
|
|
23
|
+
]
|
|
24
|
+
requires-python = ">=3.11"
|
|
25
|
+
dependencies = [
|
|
26
|
+
"matplotlib>=3.10",
|
|
27
|
+
]
|
|
28
|
+
|
|
29
|
+
[project.urls]
|
|
30
|
+
Homepage = "https://github.com/thomascamminady/camminady_matplotlib_theme"
|
|
31
|
+
Documentation = "https://camminady.dev/camminady_matplotlib_theme/"
|
|
32
|
+
Repository = "https://github.com/thomascamminady/camminady_matplotlib_theme"
|
|
33
|
+
Issues = "https://github.com/thomascamminady/camminady_matplotlib_theme/issues"
|
|
34
|
+
|
|
35
|
+
[build-system]
|
|
36
|
+
requires = ["hatchling>=1.27"]
|
|
37
|
+
build-backend = "hatchling.build"
|
|
38
|
+
|
|
39
|
+
[tool.hatch.build.targets.sdist]
|
|
40
|
+
include = ["/src", "/tests", "/README.md", "/LICENSE"]
|
|
41
|
+
|
|
42
|
+
[dependency-groups]
|
|
43
|
+
dev = [
|
|
44
|
+
"camminady-altair-theme>=0.2.1",
|
|
45
|
+
"pytest>=8.4.2",
|
|
46
|
+
"pytest-cov>=6.3.0",
|
|
47
|
+
"ruff>=0.15.20",
|
|
48
|
+
"ty>=0.0.57",
|
|
49
|
+
"vega-datasets>=0.9.0",
|
|
50
|
+
"vl-convert-python>=1.9.0",
|
|
51
|
+
]
|
|
52
|
+
docs = [
|
|
53
|
+
"pdoc>=14.7.0",
|
|
54
|
+
]
|
|
55
|
+
|
|
56
|
+
[tool.pytest.ini_options]
|
|
57
|
+
testpaths = ["tests"]
|
|
@@ -0,0 +1,47 @@
|
|
|
1
|
+
"""Minimal matplotlib styles: ``"camminady"`` and ``"camminady_dark"``.
|
|
2
|
+
|
|
3
|
+
They match the Altair theme of ``camminady_altair_theme``. Use a style
|
|
4
|
+
without importing this package::
|
|
5
|
+
|
|
6
|
+
import matplotlib.pyplot as plt
|
|
7
|
+
|
|
8
|
+
plt.style.use("camminady_matplotlib_theme.camminady")
|
|
9
|
+
|
|
10
|
+
Importing the package also registers the short names ``"camminady"`` and
|
|
11
|
+
``"camminady_dark"`` with matplotlib, without applying a style.
|
|
12
|
+
|
|
13
|
+
.. include:: ../../README.md
|
|
14
|
+
:start-after: <!-- docs-start -->
|
|
15
|
+
"""
|
|
16
|
+
|
|
17
|
+
from importlib.metadata import version
|
|
18
|
+
|
|
19
|
+
import matplotlib
|
|
20
|
+
import matplotlib.style
|
|
21
|
+
|
|
22
|
+
from camminady_matplotlib_theme.layout import install
|
|
23
|
+
from camminady_matplotlib_theme.theme import (
|
|
24
|
+
OKABE_ITO,
|
|
25
|
+
TABLEAU10,
|
|
26
|
+
Config,
|
|
27
|
+
config,
|
|
28
|
+
config_dark,
|
|
29
|
+
rc_params,
|
|
30
|
+
to_mplstyle,
|
|
31
|
+
)
|
|
32
|
+
|
|
33
|
+
__all__ = [
|
|
34
|
+
"OKABE_ITO",
|
|
35
|
+
"TABLEAU10",
|
|
36
|
+
"Config",
|
|
37
|
+
"install",
|
|
38
|
+
"rc_params",
|
|
39
|
+
"to_mplstyle",
|
|
40
|
+
]
|
|
41
|
+
__version__ = version("camminady-matplotlib-theme")
|
|
42
|
+
|
|
43
|
+
matplotlib.style.library["camminady"] = matplotlib.RcParams(rc_params(config))
|
|
44
|
+
matplotlib.style.library["camminady_dark"] = matplotlib.RcParams(
|
|
45
|
+
rc_params(config_dark)
|
|
46
|
+
)
|
|
47
|
+
matplotlib.style.available[:] = sorted(matplotlib.style.library)
|