briefing 0.1.2__tar.gz → 0.2.0__tar.gz
This diff represents the content of publicly available package versions that have been released to one of the supported registries. The information contained in this diff is provided for informational purposes only and reflects changes between package versions as they appear in their respective public registries.
- {briefing-0.1.2 → briefing-0.2.0}/.gitignore +3 -0
- {briefing-0.1.2 → briefing-0.2.0}/CHANGELOG.md +65 -1
- briefing-0.2.0/PKG-INFO +151 -0
- briefing-0.2.0/README.md +75 -0
- {briefing-0.1.2 → briefing-0.2.0}/noxfile.py +15 -0
- {briefing-0.1.2 → briefing-0.2.0}/pyproject.toml +14 -0
- {briefing-0.1.2 → briefing-0.2.0}/src/briefing/__init__.py +23 -1
- briefing-0.2.0/src/briefing/__main__.py +9 -0
- briefing-0.2.0/src/briefing/_cli.py +86 -0
- briefing-0.2.0/src/briefing/_error.py +10 -0
- {briefing-0.1.2 → briefing-0.2.0}/src/briefing/_preview.py +11 -1
- {briefing-0.1.2 → briefing-0.2.0}/src/briefing/blocks/__init__.py +2 -0
- {briefing-0.1.2 → briefing-0.2.0}/src/briefing/blocks/asset.py +17 -0
- briefing-0.2.0/src/briefing/blocks/banner.py +121 -0
- {briefing-0.1.2 → briefing-0.2.0}/src/briefing/blocks/base.py +25 -4
- {briefing-0.1.2 → briefing-0.2.0}/src/briefing/blocks/layout.py +70 -0
- {briefing-0.1.2 → briefing-0.2.0}/src/briefing/blocks/text.py +41 -0
- briefing-0.2.0/src/briefing/export/__init__.py +10 -0
- briefing-0.2.0/src/briefing/export/_image.py +150 -0
- briefing-0.2.0/src/briefing/export/_pdf.py +102 -0
- briefing-0.2.0/src/briefing/export/_render.py +221 -0
- {briefing-0.1.2 → briefing-0.2.0}/src/briefing/lab/__init__.py +12 -2
- briefing-0.2.0/src/briefing/lab/_blocks.py +341 -0
- briefing-0.2.0/src/briefing/lab/_render_calendar.py +448 -0
- briefing-0.2.0/src/briefing/lab/static/calendar.js +60 -0
- {briefing-0.1.2 → briefing-0.2.0}/src/briefing/renderers/formatting.py +45 -0
- {briefing-0.1.2 → briefing-0.2.0}/src/briefing/renderers/html.py +61 -6
- briefing-0.2.0/src/briefing/static/export.css +14 -0
- briefing-0.2.0/src/briefing/static/export.js +81 -0
- {briefing-0.1.2 → briefing-0.2.0}/src/briefing/static/report.css +94 -0
- {briefing-0.1.2 → briefing-0.2.0}/src/briefing/static/report.js +54 -0
- {briefing-0.1.2 → briefing-0.2.0}/src/briefing/templates/report.html.j2 +2 -2
- briefing-0.2.0/tests/banner_images.py +8 -0
- briefing-0.2.0/tests/compat_reports.py +52 -0
- briefing-0.2.0/tests/conftest.py +140 -0
- {briefing-0.1.2 → briefing-0.2.0}/tests/contract.py +2 -1
- briefing-0.2.0/tests/image_helpers.py +23 -0
- briefing-0.2.0/tests/pdf_reader.py +98 -0
- briefing-0.2.0/tests/snapshots/compat_0_1_2/blocks.body.html +59 -0
- briefing-0.2.0/tests/snapshots/compat_0_1_2/pages.body.html +14 -0
- briefing-0.2.0/tests/test_blocks/test_banner.py +115 -0
- {briefing-0.1.2 → briefing-0.2.0}/tests/test_browser/conftest.py +21 -0
- briefing-0.2.0/tests/test_browser/test_banner.py +134 -0
- briefing-0.2.0/tests/test_browser/test_calendar.py +81 -0
- briefing-0.2.0/tests/test_browser/test_cli_export.py +35 -0
- briefing-0.2.0/tests/test_browser/test_export_image.py +158 -0
- briefing-0.2.0/tests/test_browser/test_export_menu.py +55 -0
- briefing-0.2.0/tests/test_browser/test_export_pdf.py +101 -0
- briefing-0.2.0/tests/test_browser/test_print.py +150 -0
- briefing-0.2.0/tests/test_cli.py +97 -0
- briefing-0.2.0/tests/test_compat.py +17 -0
- {briefing-0.1.2 → briefing-0.2.0}/tests/test_contract.py +20 -0
- briefing-0.2.0/tests/test_docs_gallery.py +133 -0
- briefing-0.2.0/tests/test_docstrings.py +43 -0
- briefing-0.2.0/tests/test_export.py +76 -0
- briefing-0.2.0/tests/test_lab/test_calendar.py +303 -0
- briefing-0.2.0/tests/test_pdf_reader.py +24 -0
- {briefing-0.1.2 → briefing-0.2.0}/tests/test_readme.py +3 -1
- briefing-0.2.0/tests/test_renderers/test_export_menu.py +46 -0
- briefing-0.1.2/PKG-INFO +0 -699
- briefing-0.1.2/README.md +0 -633
- briefing-0.1.2/src/briefing/_error.py +0 -2
- briefing-0.1.2/src/briefing/lab/_blocks.py +0 -138
- briefing-0.1.2/tests/conftest.py +0 -78
- {briefing-0.1.2 → briefing-0.2.0}/LICENSE +0 -0
- {briefing-0.1.2 → briefing-0.2.0}/src/briefing/_frames.py +0 -0
- {briefing-0.1.2 → briefing-0.2.0}/src/briefing/lab/_render_datadive.py +0 -0
- {briefing-0.1.2 → briefing-0.2.0}/src/briefing/lab/_render_profile.py +0 -0
- {briefing-0.1.2 → briefing-0.2.0}/src/briefing/lab/static/lab.js +0 -0
- {briefing-0.1.2 → briefing-0.2.0}/src/briefing/py.typed +0 -0
- {briefing-0.1.2 → briefing-0.2.0}/src/briefing/renderers/__init__.py +0 -0
- {briefing-0.1.2 → briefing-0.2.0}/src/briefing/renderers/formula.py +0 -0
- {briefing-0.1.2 → briefing-0.2.0}/src/briefing/renderers/normalize.py +0 -0
- {briefing-0.1.2 → briefing-0.2.0}/src/briefing/renderers/plot.py +0 -0
- {briefing-0.1.2 → briefing-0.2.0}/src/briefing/renderers/registry.py +0 -0
- {briefing-0.1.2 → briefing-0.2.0}/src/briefing/renderers/script_json.py +0 -0
- {briefing-0.1.2 → briefing-0.2.0}/src/briefing/renderers/table.py +0 -0
- {briefing-0.1.2 → briefing-0.2.0}/tests/__init__.py +0 -0
- {briefing-0.1.2 → briefing-0.2.0}/tests/html_helpers.py +0 -0
- {briefing-0.1.2 → briefing-0.2.0}/tests/test_blocks/__init__.py +0 -0
- {briefing-0.1.2 → briefing-0.2.0}/tests/test_blocks/test_base.py +0 -0
- {briefing-0.1.2 → briefing-0.2.0}/tests/test_blocks/test_layout.py +0 -0
- {briefing-0.1.2 → briefing-0.2.0}/tests/test_blocks/test_text.py +0 -0
- {briefing-0.1.2 → briefing-0.2.0}/tests/test_browser/__init__.py +0 -0
- {briefing-0.1.2 → briefing-0.2.0}/tests/test_browser/test_bignumber.py +0 -0
- {briefing-0.1.2 → briefing-0.2.0}/tests/test_browser/test_code.py +0 -0
- {briefing-0.1.2 → briefing-0.2.0}/tests/test_browser/test_datadive.py +0 -0
- {briefing-0.1.2 → briefing-0.2.0}/tests/test_browser/test_datatable.py +0 -0
- {briefing-0.1.2 → briefing-0.2.0}/tests/test_browser/test_formula.py +0 -0
- {briefing-0.1.2 → briefing-0.2.0}/tests/test_browser/test_layout.py +0 -0
- {briefing-0.1.2 → briefing-0.2.0}/tests/test_browser/test_notebook.py +0 -0
- {briefing-0.1.2 → briefing-0.2.0}/tests/test_browser/test_plots.py +0 -0
- {briefing-0.1.2 → briefing-0.2.0}/tests/test_browser/test_spacing.py +0 -0
- {briefing-0.1.2 → briefing-0.2.0}/tests/test_browser/test_text.py +0 -0
- {briefing-0.1.2 → briefing-0.2.0}/tests/test_browser/test_toggle_theme.py +0 -0
- {briefing-0.1.2 → briefing-0.2.0}/tests/test_deprecations.py +0 -0
- {briefing-0.1.2 → briefing-0.2.0}/tests/test_frames.py +0 -0
- {briefing-0.1.2 → briefing-0.2.0}/tests/test_lab/__init__.py +0 -0
- {briefing-0.1.2 → briefing-0.2.0}/tests/test_lab/test_datadive.py +0 -0
- {briefing-0.1.2 → briefing-0.2.0}/tests/test_lab/test_lab_boundary.py +0 -0
- {briefing-0.1.2 → briefing-0.2.0}/tests/test_lab/test_profile.py +0 -0
- {briefing-0.1.2 → briefing-0.2.0}/tests/test_no_viz_deps.py +0 -0
- {briefing-0.1.2 → briefing-0.2.0}/tests/test_preview.py +0 -0
- {briefing-0.1.2 → briefing-0.2.0}/tests/test_renderers/__init__.py +0 -0
- {briefing-0.1.2 → briefing-0.2.0}/tests/test_renderers/test_formula.py +0 -0
- {briefing-0.1.2 → briefing-0.2.0}/tests/test_renderers/test_html.py +0 -0
- {briefing-0.1.2 → briefing-0.2.0}/tests/test_renderers/test_normalize.py +0 -0
- {briefing-0.1.2 → briefing-0.2.0}/tests/test_renderers/test_plot.py +0 -0
- {briefing-0.1.2 → briefing-0.2.0}/tests/test_renderers/test_reproducible.py +0 -0
- {briefing-0.1.2 → briefing-0.2.0}/tests/test_renderers/test_table.py +0 -0
|
@@ -10,6 +10,69 @@ and this project adheres to [Semantic Versioning](https://semver.org/spec/v2.0.0
|
|
|
10
10
|
|
|
11
11
|
## [Unreleased]
|
|
12
12
|
|
|
13
|
+
## [0.2.0] - 2026-11-04
|
|
14
|
+
|
|
15
|
+
### Added
|
|
16
|
+
|
|
17
|
+
- Printing a report (or saving it as PDF from the browser) shows everything: every
|
|
18
|
+
page and tab prints under its label, with each top-level `Page` on a new sheet;
|
|
19
|
+
toggles print open; search boxes, pagination, tab bars, dropdowns and DataDive
|
|
20
|
+
selectors are hidden; a `DataTable` prints up to 1,000 rows matching its search,
|
|
21
|
+
with a note giving the total; charts are resized to the paper's width and KPI
|
|
22
|
+
groups, charts and alerts avoid splitting across sheets; colours print. The
|
|
23
|
+
screen layout is restored afterwards (#37).
|
|
24
|
+
- `bf.save_image(report, "q1.png", page="all")` renders report pages as PNG, JPEG or
|
|
25
|
+
WebP in headless Chromium, offline: one image per top-level `Page` (named after it),
|
|
26
|
+
or one page by title, `name` or index; `width` and `scale` set the pixel size;
|
|
27
|
+
`size="og" | "square" | "portrait"` shrinks the page to fit a social-card size
|
|
28
|
+
without cropping; `expand=True` opens toggles first. Accepts a `Briefing` or a saved
|
|
29
|
+
`.html`. New extra: `pip install "briefing[image]"` (Playwright), then
|
|
30
|
+
`playwright install chromium` (#49).
|
|
31
|
+
- `bf.save_pdf(report, "q1.pdf", page="all", paper="a4", landscape=False)` writes the
|
|
32
|
+
report as one PDF with the print layout: each top-level page on a new sheet, text
|
|
33
|
+
selectable, links clickable, charts vector. One page by title, `name` or index;
|
|
34
|
+
`paper` is `a4`, `letter`, `legal`, `a3` or `a5` (#49).
|
|
35
|
+
- Command line for saved reports: `python -m briefing image report.html --page all -o out/`
|
|
36
|
+
and `python -m briefing pdf report.html -o report.pdf`, with the same options as
|
|
37
|
+
`save_image` / `save_pdf` and `--help` (#49).
|
|
38
|
+
- Opt-in export menu: `bf.Briefing(..., export=("png", "pdf"))` adds "Save as PNG" (the
|
|
39
|
+
open page, drawn in the reader's browser at 2×, no library, no network) and "Print"
|
|
40
|
+
to the report header. Reports without `export=` contain no export code. Best effort:
|
|
41
|
+
Bokeh's iframe charts and WebGL Plotly traces come out blank in the PNG. The menu
|
|
42
|
+
never appears in prints, PDFs or `save_image` images (#49, #100).
|
|
43
|
+
- `bf.lab.CalendarHeatmap(df, date="run_at", value=None, agg="sum")`: a GitHub-style
|
|
44
|
+
calendar, one cell per day and weeks as columns, drawn as SVG in Python. It counts
|
|
45
|
+
rows or aggregates a value per day; runs continuously across year boundaries with
|
|
46
|
+
month labels and a year marker; shows days without data differently from zeros;
|
|
47
|
+
`group=` stacks one calendar per group on a shared scale; `colors=` replaces the
|
|
48
|
+
GitHub greens and `center=` gives a diverging scale; `expected=` (a number, a
|
|
49
|
+
date-indexed Series or a DataFrame) flags days below target; `events=` marks single
|
|
50
|
+
days and multi-day spans; each day has a tooltip (#19).
|
|
51
|
+
- `CalendarHeatmap(views=("days", "hours"))` adds a 7 × 24 weekday-by-hour grid, with
|
|
52
|
+
tabs between the views, and `tz="America/Montreal"` converts timezone-aware timestamps
|
|
53
|
+
(naive timestamps and plain dates are left on their own day) (#19).
|
|
54
|
+
- `CalendarHeatmap(on_click="rows")`: clicking a day or an hour (or pressing Enter on
|
|
55
|
+
it) lists the rows behind it in a panel, shown as plain text, up to 50 per cell with a
|
|
56
|
+
note when there are more (#19).
|
|
57
|
+
- `bf.Banner(md, image=..., text_position=50, opacity=80, side="right", fade=True)`: markdown
|
|
58
|
+
text over a background image, as a report cover or section opener. The text sits on a
|
|
59
|
+
veil of the theme background that eases in over 20 % of the width; `height`, `focus`
|
|
60
|
+
and `alt` are optional; at phone width the image stacks above the text. The image (a
|
|
61
|
+
path or bytes) is embedded once; files over 2 MB warn. `Formatting` gains a
|
|
62
|
+
`--bf-bg-rgb` token for the veil (#50).
|
|
63
|
+
- `bf.Banner(..., fade=False)`: one uniform veil at `opacity` over the whole image, for
|
|
64
|
+
full-width backgrounds and textures; the text still follows `text_position` (#50).
|
|
65
|
+
- API reference documentation, built with Sphinx (`nox -s docs`): every public block
|
|
66
|
+
and function in `briefing` and `briefing.lab` documents each argument and gives an
|
|
67
|
+
example. New extra: `pip install "briefing[docs]"` (#41).
|
|
68
|
+
- Documentation guides with a live gallery: a quick start, one guide per block family,
|
|
69
|
+
themes, notebooks, printing and export, the lab, recipes and the changelog. Every
|
|
70
|
+
example runs when the docs are built and is embedded as the report it saves; a test
|
|
71
|
+
runs the same examples against the report contract (#41).
|
|
72
|
+
- The documentation is at https://briefing.readthedocs.io; the README is now a short
|
|
73
|
+
pitch and quick start that links to it, and the package metadata gains a
|
|
74
|
+
`Documentation` URL (#41).
|
|
75
|
+
|
|
13
76
|
## [0.1.2] - 2026-11-03
|
|
14
77
|
|
|
15
78
|
Bug fixes after 0.1.1, plus one rendering change: a `BigNumber` change with no
|
|
@@ -136,7 +199,8 @@ First public release.
|
|
|
136
199
|
inherits its base's renderer.
|
|
137
200
|
- Ships inline type hints (`py.typed`). Python 3.11+.
|
|
138
201
|
|
|
139
|
-
[Unreleased]: https://github.com/jeanmidevacc/briefing/compare/v0.
|
|
202
|
+
[Unreleased]: https://github.com/jeanmidevacc/briefing/compare/v0.2.0...HEAD
|
|
203
|
+
[0.2.0]: https://github.com/jeanmidevacc/briefing/compare/v0.1.2...v0.2.0
|
|
140
204
|
[0.1.2]: https://github.com/jeanmidevacc/briefing/compare/v0.1.1...v0.1.2
|
|
141
205
|
[0.1.1]: https://github.com/jeanmidevacc/briefing/compare/v0.1.0...v0.1.1
|
|
142
206
|
[0.1.0]: https://github.com/jeanmidevacc/briefing/releases/tag/v0.1.0
|
briefing-0.2.0/PKG-INFO
ADDED
|
@@ -0,0 +1,151 @@
|
|
|
1
|
+
Metadata-Version: 2.3
|
|
2
|
+
Name: briefing
|
|
3
|
+
Version: 0.2.0
|
|
4
|
+
Summary: Build beautiful self-contained HTML reports from Python analysis
|
|
5
|
+
Project-URL: Homepage, https://github.com/jeanmidevacc/briefing
|
|
6
|
+
Project-URL: Documentation, https://briefing.readthedocs.io
|
|
7
|
+
Project-URL: Repository, https://github.com/jeanmidevacc/briefing
|
|
8
|
+
Project-URL: Issues, https://github.com/jeanmidevacc/briefing/issues
|
|
9
|
+
Project-URL: Changelog, https://github.com/jeanmidevacc/briefing/blob/main/CHANGELOG.md
|
|
10
|
+
Author: jeanmidevacc
|
|
11
|
+
License: Apache-2.0
|
|
12
|
+
Keywords: data,html,pandas,polars,reporting,visualization
|
|
13
|
+
Classifier: Development Status :: 3 - Alpha
|
|
14
|
+
Classifier: Intended Audience :: Developers
|
|
15
|
+
Classifier: Intended Audience :: Science/Research
|
|
16
|
+
Classifier: License :: OSI Approved :: Apache Software License
|
|
17
|
+
Classifier: Programming Language :: Python :: 3.11
|
|
18
|
+
Classifier: Programming Language :: Python :: 3.12
|
|
19
|
+
Classifier: Programming Language :: Python :: 3.13
|
|
20
|
+
Classifier: Topic :: Scientific/Engineering :: Visualization
|
|
21
|
+
Classifier: Typing :: Typed
|
|
22
|
+
Requires-Python: >=3.11
|
|
23
|
+
Requires-Dist: jinja2>=3.1
|
|
24
|
+
Requires-Dist: latex2mathml>=3.77
|
|
25
|
+
Requires-Dist: markdown-it-py>=3.0
|
|
26
|
+
Requires-Dist: pygments>=2.15
|
|
27
|
+
Provides-Extra: altair
|
|
28
|
+
Requires-Dist: altair>=5.0; extra == 'altair'
|
|
29
|
+
Requires-Dist: vl-convert-python>=1.0; extra == 'altair'
|
|
30
|
+
Provides-Extra: bokeh
|
|
31
|
+
Requires-Dist: bokeh>=3.0; extra == 'bokeh'
|
|
32
|
+
Provides-Extra: charts
|
|
33
|
+
Requires-Dist: altair>=5.0; extra == 'charts'
|
|
34
|
+
Requires-Dist: bokeh>=3.0; extra == 'charts'
|
|
35
|
+
Requires-Dist: matplotlib>=3.7; extra == 'charts'
|
|
36
|
+
Requires-Dist: plotly>=5.0; extra == 'charts'
|
|
37
|
+
Requires-Dist: vl-convert-python>=1.0; extra == 'charts'
|
|
38
|
+
Provides-Extra: dev
|
|
39
|
+
Requires-Dist: altair>=5.0; extra == 'dev'
|
|
40
|
+
Requires-Dist: beautifulsoup4>=4.14; extra == 'dev'
|
|
41
|
+
Requires-Dist: hypothesis>=6.100; extra == 'dev'
|
|
42
|
+
Requires-Dist: matplotlib>=3.7; extra == 'dev'
|
|
43
|
+
Requires-Dist: mypy>=1.10; extra == 'dev'
|
|
44
|
+
Requires-Dist: nox>=2024.4; extra == 'dev'
|
|
45
|
+
Requires-Dist: pandas-stubs>=2.0; extra == 'dev'
|
|
46
|
+
Requires-Dist: pandas>=2.0; extra == 'dev'
|
|
47
|
+
Requires-Dist: plotly>=5.0; extra == 'dev'
|
|
48
|
+
Requires-Dist: pyarrow>=15.0; extra == 'dev'
|
|
49
|
+
Requires-Dist: pytest-cov>=5.0; extra == 'dev'
|
|
50
|
+
Requires-Dist: pytest-playwright>=0.5; extra == 'dev'
|
|
51
|
+
Requires-Dist: pytest-snapshot>=0.9; extra == 'dev'
|
|
52
|
+
Requires-Dist: pytest>=8.0; extra == 'dev'
|
|
53
|
+
Requires-Dist: ruff>=0.4; extra == 'dev'
|
|
54
|
+
Requires-Dist: vl-convert-python>=1.0; extra == 'dev'
|
|
55
|
+
Provides-Extra: docs
|
|
56
|
+
Requires-Dist: furo>=2024.1.29; extra == 'docs'
|
|
57
|
+
Requires-Dist: matplotlib>=3.7; extra == 'docs'
|
|
58
|
+
Requires-Dist: myst-parser>=2.0; extra == 'docs'
|
|
59
|
+
Requires-Dist: pandas>=2.0; extra == 'docs'
|
|
60
|
+
Requires-Dist: plotly>=5.0; extra == 'docs'
|
|
61
|
+
Requires-Dist: sphinx>=7.0; extra == 'docs'
|
|
62
|
+
Provides-Extra: email
|
|
63
|
+
Requires-Dist: kaleido>=0.2; extra == 'email'
|
|
64
|
+
Requires-Dist: premailer>=3.10; extra == 'email'
|
|
65
|
+
Provides-Extra: image
|
|
66
|
+
Requires-Dist: playwright>=1.40; extra == 'image'
|
|
67
|
+
Provides-Extra: lab
|
|
68
|
+
Requires-Dist: pandas>=2.0; extra == 'lab'
|
|
69
|
+
Provides-Extra: matplotlib
|
|
70
|
+
Requires-Dist: matplotlib>=3.7; extra == 'matplotlib'
|
|
71
|
+
Provides-Extra: pandas
|
|
72
|
+
Requires-Dist: pandas>=2.0; extra == 'pandas'
|
|
73
|
+
Provides-Extra: plotly
|
|
74
|
+
Requires-Dist: plotly>=5.0; extra == 'plotly'
|
|
75
|
+
Description-Content-Type: text/markdown
|
|
76
|
+
|
|
77
|
+
# briefing
|
|
78
|
+
|
|
79
|
+
[](https://briefing.readthedocs.io)
|
|
80
|
+
[](https://pypi.org/project/briefing/)
|
|
81
|
+
|
|
82
|
+
Build beautiful, self-contained reports from Python, authored by a person, a coding agent, or both.
|
|
83
|
+
|
|
84
|
+
A report is a short list of blocks (`Text`, `BigNumber`, `Plot`, `DataTable`, `Group`, `Select`, …),
|
|
85
|
+
saved as **one HTML file** with every script, style and image inside it: no CDN, no server, no
|
|
86
|
+
account. It opens offline, forever, and prints, or exports to PNG and PDF, cleanly.
|
|
87
|
+
|
|
88
|
+
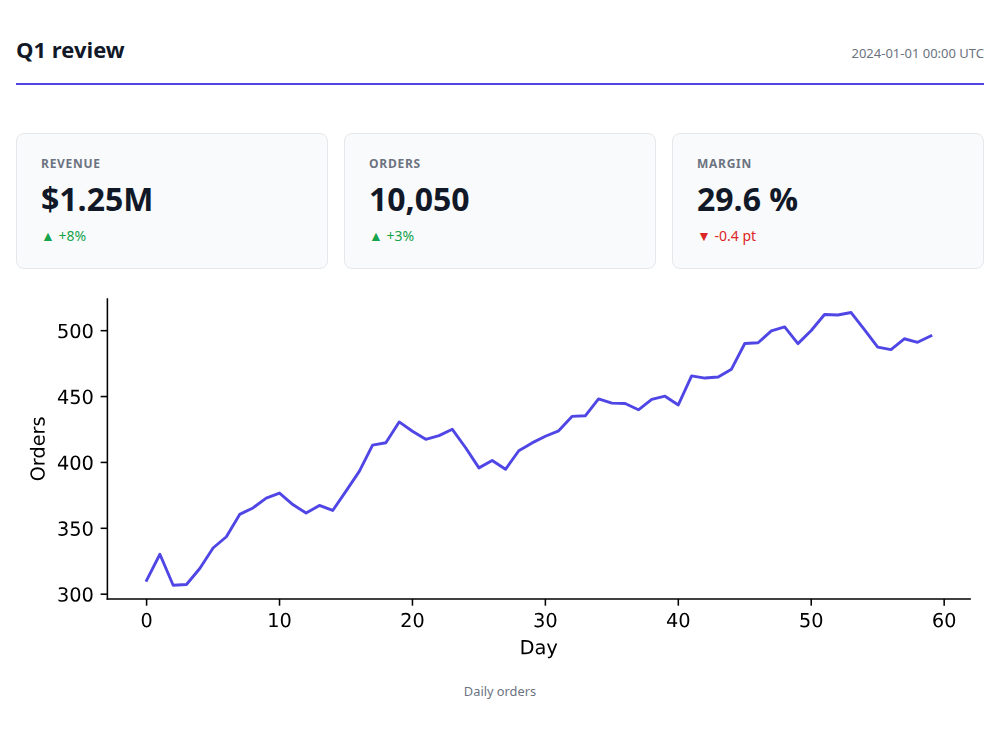
|
|
89
|
+
|
|
90
|
+
## Why briefing exists
|
|
91
|
+
|
|
92
|
+
Three things led me here:
|
|
93
|
+
|
|
94
|
+
- **Coding agents are good at making something to show you, not at making it consistently.** A few months of building with coding agents surfaced the same gap every time: they're happy to produce an artifact, but each one comes out with its own structure, and nothing tracks how a piece of content evolved across a project. There was no shared grammar a person and an agent could both build reports from as the report generation was opaque.
|
|
95
|
+
- **[datapane](https://github.com/datapane/datapane) was the cleanest report builder I'd used.** Block-based, self-contained HTML output, a dead-simple API. I relied on it constantly to turn Python analysis into reports for stakeholders and to monitor pipelines. It was decommissioned in 2023 when the SaaS behind it shut down, and nothing since has replaced it.
|
|
96
|
+
- **No visualization tool covers everything, and the ones that push furthest often don't stick around.** Years of building visualizations taught me that every tool, however good, eventually falls short of the next thing you want to show. The niche packages that *do* push past that, like [Facets](https://github.com/PAIR-code/facets) (PAIR / Google) and its Facets Dive explorer, bring real value but rarely stay maintained. I wanted a place of my own to keep building and sharing that kind of custom, interactive visualization, without depending on someone else's side project staying alive.
|
|
97
|
+
|
|
98
|
+
briefing is built to close all three gaps at once: a block grammar solid enough for me *and* my coding agents to build reports from consistently, with datapane's simplicity and a home for the custom, interactive visualization that inspired it. All of it self-contained, offline, with no cloud account required.
|
|
99
|
+
|
|
100
|
+
## Install
|
|
101
|
+
|
|
102
|
+
```bash
|
|
103
|
+
pip install briefing # the block grammar and the HTML renderer
|
|
104
|
+
pip install "briefing[pandas]" # tables from dataframes
|
|
105
|
+
pip install "briefing[lab]" # DataProfile, DataDive, CalendarHeatmap
|
|
106
|
+
pip install "briefing[image]" # save_image / save_pdf (then: playwright install chromium)
|
|
107
|
+
```
|
|
108
|
+
|
|
109
|
+
The core has no plotting or dataframe dependency. `Plot` takes a Plotly, Altair, Matplotlib or
|
|
110
|
+
Bokeh figure and imports only the library you pass; install `[plotly]`, `[altair]`, `[bokeh]`,
|
|
111
|
+
`[matplotlib]` or all of them with `[charts]`. Python 3.11+, pandas 2 and 3; polars and pyarrow
|
|
112
|
+
tables are converted for you.
|
|
113
|
+
|
|
114
|
+
## Quick start
|
|
115
|
+
|
|
116
|
+
```python
|
|
117
|
+
import briefing as bf
|
|
118
|
+
|
|
119
|
+
report = bf.Briefing(
|
|
120
|
+
bf.Text("# Sales Analysis, Q1 2024"),
|
|
121
|
+
bf.Group(
|
|
122
|
+
bf.BigNumber("Revenue", "$4.2M", change="-12%", is_upward_change=False),
|
|
123
|
+
bf.BigNumber("Active Users", "142K", change="+3%", is_upward_change=True),
|
|
124
|
+
columns=2,
|
|
125
|
+
),
|
|
126
|
+
bf.Select(
|
|
127
|
+
bf.Plot(fig, label="Trend"),
|
|
128
|
+
bf.DataTable(df, label="Raw Data"),
|
|
129
|
+
bf.lab.DataProfile(df, label="Profile"),
|
|
130
|
+
),
|
|
131
|
+
)
|
|
132
|
+
|
|
133
|
+
bf.save(report, "q1_analysis.html", name="Sales, Q1 2024")
|
|
134
|
+
```
|
|
135
|
+
|
|
136
|
+
Here `df` is a dataframe and `fig` a chart from any supported library. In a notebook, any block
|
|
137
|
+
previews itself as the last expression of a cell.
|
|
138
|
+
|
|
139
|
+
With `briefing[image]`, `bf.save_image(report, "q1.png", size="og")` renders a 1200×630 social
|
|
140
|
+
card and `bf.save_pdf(report, "q1.pdf")` a PDF of every page, both offline in headless Chromium.
|
|
141
|
+
|
|
142
|
+
## Documentation
|
|
143
|
+
|
|
144
|
+
**[briefing.readthedocs.io](https://briefing.readthedocs.io)** has a guide for each block family
|
|
145
|
+
with live examples, themes, notebooks, printing and export, the `briefing.lab` blocks, recipes and
|
|
146
|
+
the full API reference.
|
|
147
|
+
|
|
148
|
+
- [Changelog](CHANGELOG.md)
|
|
149
|
+
- [`examples/notebook_walkthrough.ipynb`](examples/notebook_walkthrough.ipynb): build a report
|
|
150
|
+
cell by cell, then save it ([the report it saves](examples/sales_report.html))
|
|
151
|
+
- [Issues](https://github.com/jeanmidevacc/briefing/issues): bugs, ideas and the roadmap
|
briefing-0.2.0/README.md
ADDED
|
@@ -0,0 +1,75 @@
|
|
|
1
|
+
# briefing
|
|
2
|
+
|
|
3
|
+
[](https://briefing.readthedocs.io)
|
|
4
|
+
[](https://pypi.org/project/briefing/)
|
|
5
|
+
|
|
6
|
+
Build beautiful, self-contained reports from Python, authored by a person, a coding agent, or both.
|
|
7
|
+
|
|
8
|
+
A report is a short list of blocks (`Text`, `BigNumber`, `Plot`, `DataTable`, `Group`, `Select`, …),
|
|
9
|
+
saved as **one HTML file** with every script, style and image inside it: no CDN, no server, no
|
|
10
|
+
account. It opens offline, forever, and prints, or exports to PNG and PDF, cleanly.
|
|
11
|
+
|
|
12
|
+

|
|
13
|
+
|
|
14
|
+
## Why briefing exists
|
|
15
|
+
|
|
16
|
+
Three things led me here:
|
|
17
|
+
|
|
18
|
+
- **Coding agents are good at making something to show you, not at making it consistently.** A few months of building with coding agents surfaced the same gap every time: they're happy to produce an artifact, but each one comes out with its own structure, and nothing tracks how a piece of content evolved across a project. There was no shared grammar a person and an agent could both build reports from as the report generation was opaque.
|
|
19
|
+
- **[datapane](https://github.com/datapane/datapane) was the cleanest report builder I'd used.** Block-based, self-contained HTML output, a dead-simple API. I relied on it constantly to turn Python analysis into reports for stakeholders and to monitor pipelines. It was decommissioned in 2023 when the SaaS behind it shut down, and nothing since has replaced it.
|
|
20
|
+
- **No visualization tool covers everything, and the ones that push furthest often don't stick around.** Years of building visualizations taught me that every tool, however good, eventually falls short of the next thing you want to show. The niche packages that *do* push past that, like [Facets](https://github.com/PAIR-code/facets) (PAIR / Google) and its Facets Dive explorer, bring real value but rarely stay maintained. I wanted a place of my own to keep building and sharing that kind of custom, interactive visualization, without depending on someone else's side project staying alive.
|
|
21
|
+
|
|
22
|
+
briefing is built to close all three gaps at once: a block grammar solid enough for me *and* my coding agents to build reports from consistently, with datapane's simplicity and a home for the custom, interactive visualization that inspired it. All of it self-contained, offline, with no cloud account required.
|
|
23
|
+
|
|
24
|
+
## Install
|
|
25
|
+
|
|
26
|
+
```bash
|
|
27
|
+
pip install briefing # the block grammar and the HTML renderer
|
|
28
|
+
pip install "briefing[pandas]" # tables from dataframes
|
|
29
|
+
pip install "briefing[lab]" # DataProfile, DataDive, CalendarHeatmap
|
|
30
|
+
pip install "briefing[image]" # save_image / save_pdf (then: playwright install chromium)
|
|
31
|
+
```
|
|
32
|
+
|
|
33
|
+
The core has no plotting or dataframe dependency. `Plot` takes a Plotly, Altair, Matplotlib or
|
|
34
|
+
Bokeh figure and imports only the library you pass; install `[plotly]`, `[altair]`, `[bokeh]`,
|
|
35
|
+
`[matplotlib]` or all of them with `[charts]`. Python 3.11+, pandas 2 and 3; polars and pyarrow
|
|
36
|
+
tables are converted for you.
|
|
37
|
+
|
|
38
|
+
## Quick start
|
|
39
|
+
|
|
40
|
+
```python
|
|
41
|
+
import briefing as bf
|
|
42
|
+
|
|
43
|
+
report = bf.Briefing(
|
|
44
|
+
bf.Text("# Sales Analysis, Q1 2024"),
|
|
45
|
+
bf.Group(
|
|
46
|
+
bf.BigNumber("Revenue", "$4.2M", change="-12%", is_upward_change=False),
|
|
47
|
+
bf.BigNumber("Active Users", "142K", change="+3%", is_upward_change=True),
|
|
48
|
+
columns=2,
|
|
49
|
+
),
|
|
50
|
+
bf.Select(
|
|
51
|
+
bf.Plot(fig, label="Trend"),
|
|
52
|
+
bf.DataTable(df, label="Raw Data"),
|
|
53
|
+
bf.lab.DataProfile(df, label="Profile"),
|
|
54
|
+
),
|
|
55
|
+
)
|
|
56
|
+
|
|
57
|
+
bf.save(report, "q1_analysis.html", name="Sales, Q1 2024")
|
|
58
|
+
```
|
|
59
|
+
|
|
60
|
+
Here `df` is a dataframe and `fig` a chart from any supported library. In a notebook, any block
|
|
61
|
+
previews itself as the last expression of a cell.
|
|
62
|
+
|
|
63
|
+
With `briefing[image]`, `bf.save_image(report, "q1.png", size="og")` renders a 1200×630 social
|
|
64
|
+
card and `bf.save_pdf(report, "q1.pdf")` a PDF of every page, both offline in headless Chromium.
|
|
65
|
+
|
|
66
|
+
## Documentation
|
|
67
|
+
|
|
68
|
+
**[briefing.readthedocs.io](https://briefing.readthedocs.io)** has a guide for each block family
|
|
69
|
+
with live examples, themes, notebooks, printing and export, the `briefing.lab` blocks, recipes and
|
|
70
|
+
the full API reference.
|
|
71
|
+
|
|
72
|
+
- [Changelog](CHANGELOG.md)
|
|
73
|
+
- [`examples/notebook_walkthrough.ipynb`](examples/notebook_walkthrough.ipynb): build a report
|
|
74
|
+
cell by cell, then save it ([the report it saves](examples/sales_report.html))
|
|
75
|
+
- [Issues](https://github.com/jeanmidevacc/briefing/issues): bugs, ideas and the roadmap
|
|
@@ -39,6 +39,21 @@ def typecheck(session: nox.Session) -> None:
|
|
|
39
39
|
session.run("mypy", "src/briefing", "tests")
|
|
40
40
|
|
|
41
41
|
|
|
42
|
+
@nox.session(python="3.11")
|
|
43
|
+
def docs(session: nox.Session) -> None:
|
|
44
|
+
"""Build the Sphinx site into docs/_build/html; any warning fails the build."""
|
|
45
|
+
session.install("-e", ".[docs]")
|
|
46
|
+
session.run("sphinx-build", "-W", "--keep-going", "-b", "html", "docs", "docs/_build/html")
|
|
47
|
+
|
|
48
|
+
|
|
49
|
+
@nox.session(name="docs-assets", python="3.11")
|
|
50
|
+
def docs_assets(session: nox.Session) -> None:
|
|
51
|
+
"""Regenerate the committed export samples in docs/_static/export/ (needs a browser)."""
|
|
52
|
+
session.install("-e", ".[image,docs]")
|
|
53
|
+
session.run("playwright", "install", "chromium")
|
|
54
|
+
session.run("python", "docs/make_export_assets.py")
|
|
55
|
+
|
|
56
|
+
|
|
42
57
|
# Re-executes the walkthrough in place. SOURCE_DATE_EPOCH pins every timestamp, so
|
|
43
58
|
# re-running it without code changes leaves the notebook and its saved report as they are.
|
|
44
59
|
_RUN_WALKTHROUGH = """
|
|
@@ -62,6 +62,7 @@ dependencies = [
|
|
|
62
62
|
|
|
63
63
|
[project.urls]
|
|
64
64
|
Homepage = "https://github.com/jeanmidevacc/briefing"
|
|
65
|
+
Documentation = "https://briefing.readthedocs.io"
|
|
65
66
|
Repository = "https://github.com/jeanmidevacc/briefing"
|
|
66
67
|
Issues = "https://github.com/jeanmidevacc/briefing/issues"
|
|
67
68
|
Changelog = "https://github.com/jeanmidevacc/briefing/blob/main/CHANGELOG.md"
|
|
@@ -82,6 +83,19 @@ bokeh = ["bokeh>=3.0"]
|
|
|
82
83
|
matplotlib = ["matplotlib>=3.7"]
|
|
83
84
|
# pip install briefing[charts] — every supported Plot backend at once
|
|
84
85
|
charts = ["plotly>=5.0", "altair>=5.0", "vl-convert-python>=1.0", "bokeh>=3.0", "matplotlib>=3.7"]
|
|
86
|
+
# pip install briefing[image] — bf.save_image / bf.save_pdf in headless Chromium;
|
|
87
|
+
# run `playwright install chromium` once after installing
|
|
88
|
+
image = ["playwright>=1.40"]
|
|
89
|
+
# pip install briefing[docs] — build the Sphinx site (nox -s docs); the examples it
|
|
90
|
+
# runs need pandas and the chart libraries, not Playwright
|
|
91
|
+
docs = [
|
|
92
|
+
"sphinx>=7.0",
|
|
93
|
+
"furo>=2024.1.29",
|
|
94
|
+
"myst-parser>=2.0",
|
|
95
|
+
"pandas>=2.0",
|
|
96
|
+
"matplotlib>=3.7",
|
|
97
|
+
"plotly>=5.0",
|
|
98
|
+
]
|
|
85
99
|
# pip install briefing[email]
|
|
86
100
|
email = [
|
|
87
101
|
"premailer>=3.10",
|
|
@@ -37,6 +37,7 @@ from briefing.blocks import (
|
|
|
37
37
|
HTML,
|
|
38
38
|
Alert,
|
|
39
39
|
AlertLevel,
|
|
40
|
+
Banner,
|
|
40
41
|
BigNumber,
|
|
41
42
|
Block,
|
|
42
43
|
Briefing,
|
|
@@ -55,6 +56,9 @@ from briefing.blocks import (
|
|
|
55
56
|
wrap_block,
|
|
56
57
|
)
|
|
57
58
|
|
|
59
|
+
# ── export: images and PDFs (Playwright is imported only when called) ────────
|
|
60
|
+
from briefing.export import save_image, save_pdf
|
|
61
|
+
|
|
58
62
|
# ── formatting ────────────────────────────────────────────────────────────────
|
|
59
63
|
from briefing.renderers.formatting import Formatting, TextAlignment, Width
|
|
60
64
|
|
|
@@ -110,12 +114,27 @@ def stringify(
|
|
|
110
114
|
as an isolated preview, and :func:`preview` adds a name or a theme.
|
|
111
115
|
|
|
112
116
|
Pass *now* (or set ``SOURCE_DATE_EPOCH``) for byte-reproducible output.
|
|
117
|
+
|
|
118
|
+
Args:
|
|
119
|
+
blocks: A :class:`Briefing`, a list of blocks, or a single block.
|
|
120
|
+
name: Report title, shown in the browser tab and the header.
|
|
121
|
+
formatting: A :class:`Formatting` instance controlling the theme.
|
|
122
|
+
now: Pin the header timestamp for byte-reproducible output (see also
|
|
123
|
+
the ``SOURCE_DATE_EPOCH`` environment variable).
|
|
124
|
+
|
|
125
|
+
Returns:
|
|
126
|
+
The complete HTML document.
|
|
127
|
+
|
|
128
|
+
Example::
|
|
129
|
+
|
|
130
|
+
html = bf.stringify(bf.Text("# Hello"), name="Greeting")
|
|
131
|
+
email_body = html # or write it anywhere a string goes
|
|
113
132
|
"""
|
|
114
133
|
wrapped = Briefing.wrap(blocks)
|
|
115
134
|
return render_report(wrapped, name=name, formatting=formatting, now=now)
|
|
116
135
|
|
|
117
136
|
|
|
118
|
-
__version__ = "0.
|
|
137
|
+
__version__ = "0.2.0"
|
|
119
138
|
|
|
120
139
|
__all__: list[str] = [
|
|
121
140
|
# error
|
|
@@ -139,6 +158,7 @@ __all__: list[str] = [
|
|
|
139
158
|
"VAlign",
|
|
140
159
|
"wrap_block",
|
|
141
160
|
# blocks — asset
|
|
161
|
+
"Banner",
|
|
142
162
|
"DataTable",
|
|
143
163
|
"Plot",
|
|
144
164
|
"Table",
|
|
@@ -152,6 +172,8 @@ __all__: list[str] = [
|
|
|
152
172
|
"Preview",
|
|
153
173
|
"preview",
|
|
154
174
|
"save",
|
|
175
|
+
"save_image",
|
|
176
|
+
"save_pdf",
|
|
155
177
|
"stringify",
|
|
156
178
|
# meta
|
|
157
179
|
"__version__",
|
|
@@ -0,0 +1,86 @@
|
|
|
1
|
+
"""Command line for saved reports: ``python -m briefing image|pdf report.html``."""
|
|
2
|
+
from __future__ import annotations
|
|
3
|
+
|
|
4
|
+
import argparse
|
|
5
|
+
import sys
|
|
6
|
+
from collections.abc import Sequence
|
|
7
|
+
from pathlib import Path
|
|
8
|
+
|
|
9
|
+
from briefing._error import BriefingError
|
|
10
|
+
from briefing.export import PAPERS, PRESETS, save_image, save_pdf
|
|
11
|
+
|
|
12
|
+
_FORMATS = ("png", "jpg", "webp")
|
|
13
|
+
|
|
14
|
+
|
|
15
|
+
def _page(value: str) -> str | int:
|
|
16
|
+
"""``--page``: "all", a 0-based index, or a page title or name."""
|
|
17
|
+
return int(value) if value.isdigit() else value
|
|
18
|
+
|
|
19
|
+
|
|
20
|
+
def _output(source: Path, output: Path | None, suffix: str) -> Path:
|
|
21
|
+
"""Where to write: the given file, inside the given directory, or next to the input."""
|
|
22
|
+
if output is None:
|
|
23
|
+
return source.with_suffix(suffix)
|
|
24
|
+
if output.is_dir():
|
|
25
|
+
return output / source.with_suffix(suffix).name
|
|
26
|
+
return output
|
|
27
|
+
|
|
28
|
+
|
|
29
|
+
def _parser() -> argparse.ArgumentParser:
|
|
30
|
+
from briefing import __version__
|
|
31
|
+
|
|
32
|
+
parser = argparse.ArgumentParser(
|
|
33
|
+
prog="python -m briefing",
|
|
34
|
+
description="Export a saved briefing report as images or a PDF, in headless Chromium, offline. "
|
|
35
|
+
'Needs pip install "briefing[image]" and, once, playwright install chromium.',
|
|
36
|
+
)
|
|
37
|
+
parser.add_argument("--version", action="version", version=f"briefing {__version__}")
|
|
38
|
+
commands = parser.add_subparsers(dest="command", required=True, metavar="{image,pdf}")
|
|
39
|
+
|
|
40
|
+
image = commands.add_parser("image", help="save report pages as PNG, JPEG or WebP images",
|
|
41
|
+
description="Save report pages as images (see bf.save_image).")
|
|
42
|
+
image.add_argument("report", type=Path, help="a saved report .html file")
|
|
43
|
+
image.add_argument("-o", "--output", type=Path,
|
|
44
|
+
help="output file, or a directory (default: next to the report, same name)")
|
|
45
|
+
image.add_argument("--page", type=_page, default="all",
|
|
46
|
+
help='"all" (default: one image per page), a page title or name, or a 0-based index')
|
|
47
|
+
image.add_argument("--format", choices=_FORMATS, default=None,
|
|
48
|
+
help="image format when --output is a directory or omitted (default: png)")
|
|
49
|
+
image.add_argument("--size", choices=sorted(PRESETS), default=None,
|
|
50
|
+
help="social-card size: og 1200x630, square 1080x1080, portrait 1080x1350 "
|
|
51
|
+
"(default: full height)")
|
|
52
|
+
image.add_argument("--width", type=int, default=1200, help="layout width in CSS pixels (default: 1200)")
|
|
53
|
+
image.add_argument("--scale", type=float, default=2.0, help="device pixels per CSS pixel (default: 2)")
|
|
54
|
+
image.add_argument("--no-expand", dest="expand", action="store_false", help="leave toggles closed")
|
|
55
|
+
|
|
56
|
+
pdf = commands.add_parser("pdf", help="save the report as one PDF",
|
|
57
|
+
description="Save a report as a PDF (see bf.save_pdf).")
|
|
58
|
+
pdf.add_argument("report", type=Path, help="a saved report .html file")
|
|
59
|
+
pdf.add_argument("-o", "--output", type=Path, help="output .pdf file, or a directory (default: next to the report)")
|
|
60
|
+
pdf.add_argument("--page", type=_page, default="all",
|
|
61
|
+
help='"all" (default), a page title or name, or a 0-based index')
|
|
62
|
+
pdf.add_argument("--paper", choices=sorted(PAPERS), default="a4", help="paper size (default: a4)")
|
|
63
|
+
pdf.add_argument("--landscape", action="store_true", help="turn the paper sideways")
|
|
64
|
+
return parser
|
|
65
|
+
|
|
66
|
+
|
|
67
|
+
def main(argv: Sequence[str] | None = None) -> int:
|
|
68
|
+
"""Run the command line; returns the exit status."""
|
|
69
|
+
args = _parser().parse_args(argv)
|
|
70
|
+
try:
|
|
71
|
+
if args.command == "image":
|
|
72
|
+
suffix = "." + (args.format or (args.output.suffix.lstrip(".") if args.output and args.output.suffix
|
|
73
|
+
and not args.output.is_dir() else "png"))
|
|
74
|
+
written = save_image(
|
|
75
|
+
args.report, _output(args.report, args.output, suffix),
|
|
76
|
+
page=args.page, width=args.width, scale=args.scale, size=args.size, expand=args.expand,
|
|
77
|
+
)
|
|
78
|
+
else:
|
|
79
|
+
written = [save_pdf(args.report, _output(args.report, args.output, ".pdf"),
|
|
80
|
+
page=args.page, paper=args.paper, landscape=args.landscape)]
|
|
81
|
+
except BriefingError as exc:
|
|
82
|
+
print(f"error: {exc}", file=sys.stderr)
|
|
83
|
+
return 1
|
|
84
|
+
for path in written:
|
|
85
|
+
print(path)
|
|
86
|
+
return 0
|
|
@@ -57,7 +57,17 @@ def _attribute(text: str) -> str:
|
|
|
57
57
|
|
|
58
58
|
|
|
59
59
|
class Preview:
|
|
60
|
-
"""A notebook preview of *blocks* with a report name and theme; see :func:`preview`.
|
|
60
|
+
"""A notebook preview of *blocks* with a report name and theme; see :func:`preview`.
|
|
61
|
+
|
|
62
|
+
Args:
|
|
63
|
+
blocks: A block, a list of blocks, or a :class:`~briefing.Briefing`.
|
|
64
|
+
name: Report title, shown in the header.
|
|
65
|
+
formatting: The theme.
|
|
66
|
+
|
|
67
|
+
Example::
|
|
68
|
+
|
|
69
|
+
bf.Preview(report, name="Q1 review", formatting=bf.Formatting.dark())
|
|
70
|
+
"""
|
|
61
71
|
|
|
62
72
|
def __init__(self, blocks: t.Any, *, name: str = "Report", formatting: Formatting | None = None) -> None:
|
|
63
73
|
self.blocks = blocks
|
|
@@ -3,6 +3,7 @@
|
|
|
3
3
|
Custom-visualisation blocks (DataProfile, DataDive) live in ``briefing.lab``.
|
|
4
4
|
"""
|
|
5
5
|
from briefing.blocks.asset import DataTable, Plot, Table
|
|
6
|
+
from briefing.blocks.banner import Banner
|
|
6
7
|
from briefing.blocks.base import Block, BlockId, BlockOrPrimitive, ContainerBlock, wrap_block
|
|
7
8
|
from briefing.blocks.layout import Briefing, Group, Page, Select, SelectType, Toggle, VAlign
|
|
8
9
|
from briefing.blocks.text import HTML, Alert, AlertLevel, BigNumber, Code, Formula, Text
|
|
@@ -31,6 +32,7 @@ __all__: list[str] = [
|
|
|
31
32
|
"Toggle",
|
|
32
33
|
"VAlign",
|
|
33
34
|
# asset
|
|
35
|
+
"Banner",
|
|
34
36
|
"DataTable",
|
|
35
37
|
"Plot",
|
|
36
38
|
"Table",
|
|
@@ -24,6 +24,7 @@ class Plot(Block):
|
|
|
24
24
|
"""Chart / figure block — library agnostic.
|
|
25
25
|
|
|
26
26
|
Auto-detects the figure type at render time:
|
|
27
|
+
|
|
27
28
|
- **Plotly** → embedded as interactive HTML (inline JS)
|
|
28
29
|
- **Altair / Vega-Lite** → embedded as Vega spec (inline runtime)
|
|
29
30
|
- **Matplotlib / Seaborn / Plotnine** → embedded as inline SVG
|
|
@@ -35,6 +36,8 @@ class Plot(Block):
|
|
|
35
36
|
responsive: Let the chart fill the width of its container.
|
|
36
37
|
scale: Deprecated, has no effect, and is removed after 0.2. Size the figure
|
|
37
38
|
in its plotting library instead, e.g. Matplotlib's ``figsize=(w, h)``.
|
|
39
|
+
name: Stable block id (letters, digits, ``_`` and ``-``), for referencing the block.
|
|
40
|
+
label: Tab or dropdown label when the block is inside a ``Select``.
|
|
38
41
|
|
|
39
42
|
Example::
|
|
40
43
|
|
|
@@ -73,6 +76,12 @@ class Table(Block):
|
|
|
73
76
|
formatting to be preserved. A Styler is used verbatim; any other frame
|
|
74
77
|
(pandas, polars, pyarrow, …) is normalised to pandas.
|
|
75
78
|
|
|
79
|
+
Args:
|
|
80
|
+
data: A dataframe (as for :class:`DataTable`) or a pandas ``Styler``, kept as-is.
|
|
81
|
+
caption: Optional caption below the table.
|
|
82
|
+
name: Stable block id (letters, digits, ``_`` and ``-``), for referencing the block.
|
|
83
|
+
label: Tab or dropdown label when the block is inside a ``Select``.
|
|
84
|
+
|
|
76
85
|
Example::
|
|
77
86
|
|
|
78
87
|
bf.Table(df)
|
|
@@ -102,6 +111,14 @@ class DataTable(Block):
|
|
|
102
111
|
Handles large datasets via client-side pagination. Viewers can also sort
|
|
103
112
|
columns and filter rows by typing in the search box.
|
|
104
113
|
|
|
114
|
+
Args:
|
|
115
|
+
df: The data: pandas, polars, pyarrow, anything with the dataframe
|
|
116
|
+
interchange protocol, or a dict of columns.
|
|
117
|
+
caption: Optional caption below the table.
|
|
118
|
+
max_rows: Rows beyond this are dropped with a warning.
|
|
119
|
+
name: Stable block id (letters, digits, ``_`` and ``-``), for referencing the block.
|
|
120
|
+
label: Tab or dropdown label when the block is inside a ``Select``.
|
|
121
|
+
|
|
105
122
|
Example::
|
|
106
123
|
|
|
107
124
|
bf.DataTable(df, caption="Top 1 000 orders")
|