bn-lightweight-charts 0.2.0__tar.gz
This diff represents the content of publicly available package versions that have been released to one of the supported registries. The information contained in this diff is provided for informational purposes only and reflects changes between package versions as they appear in their respective public registries.
- bn_lightweight_charts-0.2.0/.gitignore +17 -0
- bn_lightweight_charts-0.2.0/LICENSE +22 -0
- bn_lightweight_charts-0.2.0/PKG-INFO +317 -0
- bn_lightweight_charts-0.2.0/README.md +299 -0
- bn_lightweight_charts-0.2.0/bn_lightweight_charts/__init__.py +7 -0
- bn_lightweight_charts-0.2.0/bn_lightweight_charts/abstract.py +1001 -0
- bn_lightweight_charts-0.2.0/bn_lightweight_charts/chart.py +241 -0
- bn_lightweight_charts-0.2.0/bn_lightweight_charts/drawings.py +278 -0
- bn_lightweight_charts-0.2.0/bn_lightweight_charts/js/bundle.dev.js +2472 -0
- bn_lightweight_charts-0.2.0/bn_lightweight_charts/js/bundle.js +1 -0
- bn_lightweight_charts-0.2.0/bn_lightweight_charts/js/index.html +25 -0
- bn_lightweight_charts-0.2.0/bn_lightweight_charts/js/index_bn.html +144 -0
- bn_lightweight_charts-0.2.0/bn_lightweight_charts/js/lightweight-charts.js +15475 -0
- bn_lightweight_charts-0.2.0/bn_lightweight_charts/js/lightweight-charts.standalone.development.js +15475 -0
- bn_lightweight_charts-0.2.0/bn_lightweight_charts/js/styles.css +257 -0
- bn_lightweight_charts-0.2.0/bn_lightweight_charts/polygon.py +470 -0
- bn_lightweight_charts-0.2.0/bn_lightweight_charts/table.py +138 -0
- bn_lightweight_charts-0.2.0/bn_lightweight_charts/toolbox.py +45 -0
- bn_lightweight_charts-0.2.0/bn_lightweight_charts/topbar.py +128 -0
- bn_lightweight_charts-0.2.0/bn_lightweight_charts/util.py +227 -0
- bn_lightweight_charts-0.2.0/bn_lightweight_charts/widgets.py +357 -0
- bn_lightweight_charts-0.2.0/pyproject.toml +37 -0
|
@@ -0,0 +1,22 @@
|
|
|
1
|
+
MIT License
|
|
2
|
+
|
|
3
|
+
Copyright (c) 2025 smalinin
|
|
4
|
+
Copyright (c) 2023 louisnw01
|
|
5
|
+
|
|
6
|
+
Permission is hereby granted, free of charge, to any person obtaining a copy
|
|
7
|
+
of this software and associated documentation files (the "Software"), to deal
|
|
8
|
+
in the Software without restriction, including without limitation the rights
|
|
9
|
+
to use, copy, modify, merge, publish, distribute, sublicense, and/or sell
|
|
10
|
+
copies of the Software, and to permit persons to whom the Software is
|
|
11
|
+
furnished to do so, subject to the following conditions:
|
|
12
|
+
|
|
13
|
+
The above copyright notice and this permission notice shall be included in all
|
|
14
|
+
copies or substantial portions of the Software.
|
|
15
|
+
|
|
16
|
+
THE SOFTWARE IS PROVIDED "AS IS", WITHOUT WARRANTY OF ANY KIND, EXPRESS OR
|
|
17
|
+
IMPLIED, INCLUDING BUT NOT LIMITED TO THE WARRANTIES OF MERCHANTABILITY,
|
|
18
|
+
FITNESS FOR A PARTICULAR PURPOSE AND NONINFRINGEMENT. IN NO EVENT SHALL THE
|
|
19
|
+
AUTHORS OR COPYRIGHT HOLDERS BE LIABLE FOR ANY CLAIM, DAMAGES OR OTHER
|
|
20
|
+
LIABILITY, WHETHER IN AN ACTION OF CONTRACT, TORT OR OTHERWISE, ARISING FROM,
|
|
21
|
+
OUT OF OR IN CONNECTION WITH THE SOFTWARE OR THE USE OR OTHER DEALINGS IN THE
|
|
22
|
+
SOFTWARE.
|
|
@@ -0,0 +1,317 @@
|
|
|
1
|
+
Metadata-Version: 2.4
|
|
2
|
+
Name: bn-lightweight-charts
|
|
3
|
+
Version: 0.2.0
|
|
4
|
+
Summary: Python framework for TradingView's Lightweight Charts JavaScript library.
|
|
5
|
+
Project-URL: Homepage, https://github.com/smalinin/bn_lightweight-charts-python
|
|
6
|
+
Project-URL: Source, https://github.com/smalinin/bn_lightweight-charts-python
|
|
7
|
+
Author: smalinin
|
|
8
|
+
License: MIT
|
|
9
|
+
License-File: LICENSE
|
|
10
|
+
Classifier: Development Status :: 3 - Alpha
|
|
11
|
+
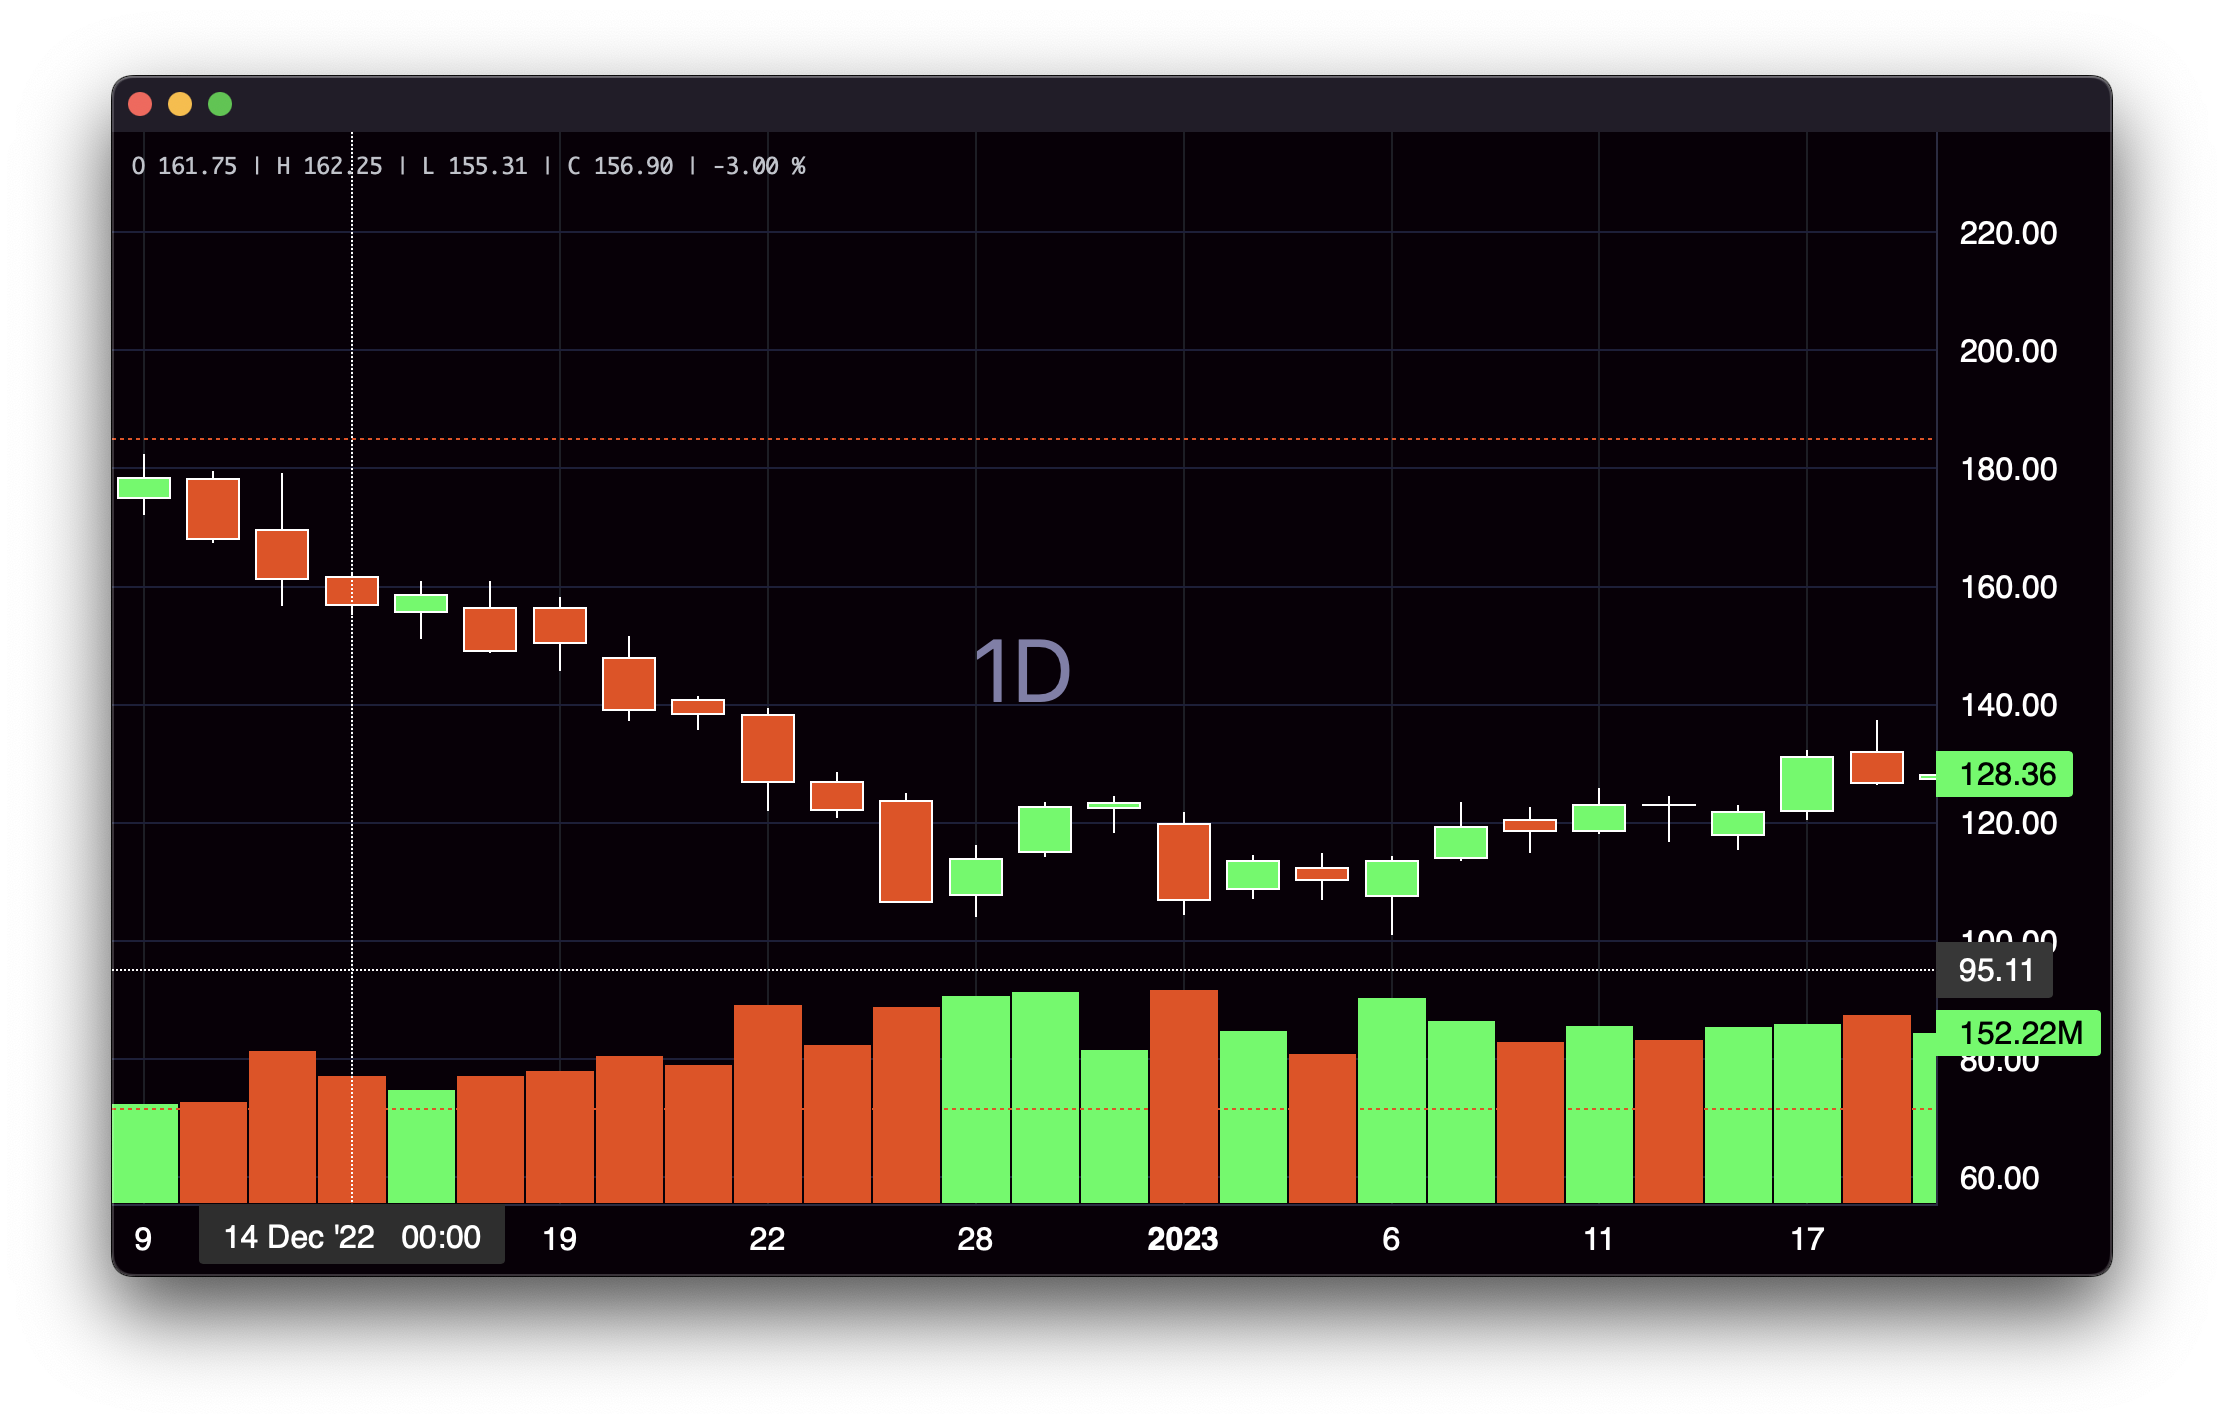
Classifier: License :: OSI Approved :: MIT License
|
|
12
|
+
Classifier: Operating System :: OS Independent
|
|
13
|
+
Classifier: Programming Language :: Python :: 3
|
|
14
|
+
Requires-Python: >=3.8
|
|
15
|
+
Requires-Dist: pandas
|
|
16
|
+
Requires-Dist: tzlocal
|
|
17
|
+
Description-Content-Type: text/markdown
|
|
18
|
+
|
|
19
|
+
<div align="center">
|
|
20
|
+
|
|
21
|
+
# bn-lightweight-charts-python
|
|
22
|
+
|
|
23
|
+
[](https://pypi.org/project/bn_lightweight-charts/)
|
|
24
|
+
[](https://python.org "Go to Python homepage")
|
|
25
|
+
[](https://github.com/smalinin/bn_lightweight-charts-python/blob/main/LICENSE)
|
|
26
|
+
[](https://lightweight-charts-python.readthedocs.io/en/latest/index.html)
|
|
27
|
+
|
|
28
|
+
lightweight-charts-python aims to provide a simple and pythonic way to access and implement [TradingView's Lightweight Charts](https://www.tradingview.com/lightweight-charts/).
|
|
29
|
+
|
|
30
|
+
</div>
|
|
31
|
+
|
|
32
|
+
## Installation
|
|
33
|
+
```
|
|
34
|
+
pip install bn-lightweight-charts
|
|
35
|
+
```
|
|
36
|
+
## History
|
|
37
|
+
Package is based on [lightweight-charts-python](https://github.com/louisnw01/lightweight-charts-python)
|
|
38
|
+
Changes:
|
|
39
|
+
|
|
40
|
+
- used lightweight-charts js v:5.x
|
|
41
|
+
- added milti-pane support from lightweight-charts js v:5.x
|
|
42
|
+
- added support for charts resize and panel resize
|
|
43
|
+
- fixed issue with sync charts
|
|
44
|
+
- added support view in browser
|
|
45
|
+
|
|
46
|
+
|
|
47
|
+
## Features
|
|
48
|
+
1. Streamlined for live data, with methods for updating directly from tick data.
|
|
49
|
+
2. Multi-pane charts using [Subcharts](https://lightweight-charts-python.readthedocs.io/en/latest/reference/abstract_chart.html#AbstractChart.create_subchart).
|
|
50
|
+
3. The [Toolbox](https://lightweight-charts-python.readthedocs.io/en/latest/reference/toolbox.html), allowing for trendlines, rectangles, rays and horizontal lines to be drawn directly onto charts.
|
|
51
|
+
4. [Events](https://lightweight-charts-python.readthedocs.io/en/latest/tutorials/events.html) allowing for timeframe selectors (1min, 5min, 30min etc.), searching, hotkeys, and more.
|
|
52
|
+
5. [Tables](https://lightweight-charts-python.readthedocs.io/en/latest/reference/tables.html) for watchlists, order entry, and trade management.
|
|
53
|
+
6. Direct integration of market data through [Polygon.io's](https://polygon.io/?utm_source=affiliate&utm_campaign=pythonlwcharts) market data API.
|
|
54
|
+
|
|
55
|
+
__Supports:__ Jupyter Notebooks, PyQt6, PyQt5, PySide6, wxPython, Streamlit, and asyncio.
|
|
56
|
+
|
|
57
|
+
PartTimeLarry: [Interactive Brokers API and TradingView Charts in Python](https://www.youtube.com/watch?v=TlhDI3PforA)
|
|
58
|
+
___
|
|
59
|
+
|
|
60
|
+
## Samples
|
|
61
|
+
### 0. Multi-pane support
|
|
62
|
+
```
|
|
63
|
+
import pandas as pd
|
|
64
|
+
import webbrowser
|
|
65
|
+
from bn_lightweight_charts import HTMLChart
|
|
66
|
+
|
|
67
|
+
def calculate_sma(df, period: int = 50, name = None):
|
|
68
|
+
name = name or f'SMA {period}'
|
|
69
|
+
return pd.DataFrame({
|
|
70
|
+
'time': df['date'],
|
|
71
|
+
name: df['close'].rolling(window=period).mean()
|
|
72
|
+
}) #.dropna()
|
|
73
|
+
|
|
74
|
+
def demo():
|
|
75
|
+
chart = HTMLChart(width=1200, height=800, inner_height=-500, filename='charts.html')
|
|
76
|
+
chart.legend(visible=True)
|
|
77
|
+
df = pd.read_csv('./PDATA/4ohlcv.csv')
|
|
78
|
+
chart.set(df)
|
|
79
|
+
|
|
80
|
+
# Pane 0
|
|
81
|
+
line7 = chart.create_line('SMA 7', color='red', price_line=False, price_label=False)
|
|
82
|
+
sma7_data = calculate_sma(df, period=7)
|
|
83
|
+
line7.set(sma7_data)
|
|
84
|
+
line14 = chart.create_line('SMA 14', color='blue', price_line=False, price_label=False)
|
|
85
|
+
sma14_data = calculate_sma(df, period=14)
|
|
86
|
+
line14.set(sma14_data)
|
|
87
|
+
|
|
88
|
+
# Pane 1
|
|
89
|
+
sma20_data = calculate_sma(df, period=20, name='Hist SMA(20)')
|
|
90
|
+
line20 = chart.create_histogram('Hist SMA(20)', price_line=False, price_label=False, pane_index=1)
|
|
91
|
+
line20.set(sma20_data)
|
|
92
|
+
|
|
93
|
+
# Pane 2
|
|
94
|
+
sma50_data = calculate_sma(df, period=50)
|
|
95
|
+
line50 = chart.create_line('SMA 50', color='green', price_line=False, price_label=False, pane_index=2)
|
|
96
|
+
line50.set(sma50_data)
|
|
97
|
+
|
|
98
|
+
chart.load()
|
|
99
|
+
webbrowser.open(chart.filename)
|
|
100
|
+
|
|
101
|
+
if __name__ == '__main__':
|
|
102
|
+
demo()
|
|
103
|
+
```
|
|
104
|
+
|
|
105
|
+
|
|
106
|
+
|
|
107
|
+
|
|
108
|
+
### 1. Display data from a csv:
|
|
109
|
+
|
|
110
|
+
```python
|
|
111
|
+
import pandas as pd
|
|
112
|
+
from bn_lightweight_charts import Chart
|
|
113
|
+
|
|
114
|
+
|
|
115
|
+
if __name__ == '__main__':
|
|
116
|
+
|
|
117
|
+
chart = Chart()
|
|
118
|
+
|
|
119
|
+
# Columns: time | open | high | low | close | volume
|
|
120
|
+
df = pd.read_csv('ohlcv.csv')
|
|
121
|
+
chart.set(df)
|
|
122
|
+
|
|
123
|
+
chart.show(block=True)
|
|
124
|
+
|
|
125
|
+
```
|
|
126
|
+
|
|
127
|
+
___
|
|
128
|
+
|
|
129
|
+
### 2. Updating bars in real-time:
|
|
130
|
+
|
|
131
|
+
```python
|
|
132
|
+
import pandas as pd
|
|
133
|
+
from time import sleep
|
|
134
|
+
from bn_lightweight_charts import Chart
|
|
135
|
+
|
|
136
|
+
if __name__ == '__main__':
|
|
137
|
+
|
|
138
|
+
chart = Chart()
|
|
139
|
+
|
|
140
|
+
df1 = pd.read_csv('ohlcv.csv')
|
|
141
|
+
df2 = pd.read_csv('next_ohlcv.csv')
|
|
142
|
+
|
|
143
|
+
chart.set(df1)
|
|
144
|
+
|
|
145
|
+
chart.show()
|
|
146
|
+
|
|
147
|
+
last_close = df1.iloc[-1]['close']
|
|
148
|
+
|
|
149
|
+
for i, series in df2.iterrows():
|
|
150
|
+
chart.update(series)
|
|
151
|
+
|
|
152
|
+
if series['close'] > 20 and last_close < 20:
|
|
153
|
+
chart.marker(text='The price crossed $20!')
|
|
154
|
+
|
|
155
|
+
last_close = series['close']
|
|
156
|
+
sleep(0.1)
|
|
157
|
+
|
|
158
|
+
```
|
|
159
|
+
|
|
160
|
+

|
|
161
|
+
___
|
|
162
|
+
|
|
163
|
+
### 3. Updating bars from tick data in real-time:
|
|
164
|
+
|
|
165
|
+
```python
|
|
166
|
+
import pandas as pd
|
|
167
|
+
from time import sleep
|
|
168
|
+
from bn_lightweight_charts import Chart
|
|
169
|
+
|
|
170
|
+
|
|
171
|
+
if __name__ == '__main__':
|
|
172
|
+
|
|
173
|
+
df1 = pd.read_csv('ohlc.csv')
|
|
174
|
+
|
|
175
|
+
# Columns: time | price
|
|
176
|
+
df2 = pd.read_csv('ticks.csv')
|
|
177
|
+
|
|
178
|
+
chart = Chart()
|
|
179
|
+
|
|
180
|
+
chart.set(df1)
|
|
181
|
+
|
|
182
|
+
chart.show()
|
|
183
|
+
|
|
184
|
+
for i, tick in df2.iterrows():
|
|
185
|
+
chart.update_from_tick(tick)
|
|
186
|
+
|
|
187
|
+
sleep(0.03)
|
|
188
|
+
|
|
189
|
+
```
|
|
190
|
+
|
|
191
|
+
___
|
|
192
|
+
|
|
193
|
+
### 4. Line Indicators:
|
|
194
|
+
|
|
195
|
+
```python
|
|
196
|
+
import pandas as pd
|
|
197
|
+
from bn_lightweight_charts import Chart
|
|
198
|
+
|
|
199
|
+
|
|
200
|
+
def calculate_sma(df, period: int = 50):
|
|
201
|
+
return pd.DataFrame({
|
|
202
|
+
'time': df['date'],
|
|
203
|
+
f'SMA {period}': df['close'].rolling(window=period).mean()
|
|
204
|
+
}).dropna()
|
|
205
|
+
|
|
206
|
+
|
|
207
|
+
if __name__ == '__main__':
|
|
208
|
+
chart = Chart()
|
|
209
|
+
chart.legend(visible=True)
|
|
210
|
+
|
|
211
|
+
df = pd.read_csv('ohlcv.csv')
|
|
212
|
+
chart.set(df)
|
|
213
|
+
|
|
214
|
+
line = chart.create_line('SMA 50')
|
|
215
|
+
sma_data = calculate_sma(df, period=50)
|
|
216
|
+
line.set(sma_data)
|
|
217
|
+
|
|
218
|
+
chart.show(block=True)
|
|
219
|
+
|
|
220
|
+
```
|
|
221
|
+
|
|
222
|
+
___
|
|
223
|
+
|
|
224
|
+
### 5. Styling:
|
|
225
|
+
|
|
226
|
+
```python
|
|
227
|
+
import pandas as pd
|
|
228
|
+
from bn_lightweight_charts import Chart
|
|
229
|
+
|
|
230
|
+
|
|
231
|
+
if __name__ == '__main__':
|
|
232
|
+
|
|
233
|
+
chart = Chart()
|
|
234
|
+
|
|
235
|
+
df = pd.read_csv('ohlcv.csv')
|
|
236
|
+
|
|
237
|
+
chart.layout(background_color='#090008', text_color='#FFFFFF', font_size=16,
|
|
238
|
+
font_family='Helvetica')
|
|
239
|
+
|
|
240
|
+
chart.candle_style(up_color='#00ff55', down_color='#ed4807',
|
|
241
|
+
border_up_color='#FFFFFF', border_down_color='#FFFFFF',
|
|
242
|
+
wick_up_color='#FFFFFF', wick_down_color='#FFFFFF')
|
|
243
|
+
|
|
244
|
+
chart.volume_config(up_color='#00ff55', down_color='#ed4807')
|
|
245
|
+
|
|
246
|
+
chart.watermark('1D', color='rgba(180, 180, 240, 0.7)')
|
|
247
|
+
|
|
248
|
+
chart.crosshair(mode='normal', vert_color='#FFFFFF', vert_style='dotted',
|
|
249
|
+
horz_color='#FFFFFF', horz_style='dotted')
|
|
250
|
+
|
|
251
|
+
chart.legend(visible=True, font_size=14)
|
|
252
|
+
|
|
253
|
+
chart.set(df)
|
|
254
|
+
|
|
255
|
+
chart.show(block=True)
|
|
256
|
+
|
|
257
|
+
```
|
|
258
|
+
|
|
259
|
+
___
|
|
260
|
+
|
|
261
|
+
### 6. Callbacks:
|
|
262
|
+
|
|
263
|
+
```python
|
|
264
|
+
import pandas as pd
|
|
265
|
+
from bn_lightweight_charts import Chart
|
|
266
|
+
|
|
267
|
+
|
|
268
|
+
def get_bar_data(symbol, timeframe):
|
|
269
|
+
if symbol not in ('AAPL', 'GOOGL', 'TSLA'):
|
|
270
|
+
print(f'No data for "{symbol}"')
|
|
271
|
+
return pd.DataFrame()
|
|
272
|
+
return pd.read_csv(f'bar_data/{symbol}_{timeframe}.csv')
|
|
273
|
+
|
|
274
|
+
|
|
275
|
+
def on_search(chart, searched_string): # Called when the user searches.
|
|
276
|
+
new_data = get_bar_data(searched_string, chart.topbar['timeframe'].value)
|
|
277
|
+
if new_data.empty:
|
|
278
|
+
return
|
|
279
|
+
chart.topbar['symbol'].set(searched_string)
|
|
280
|
+
chart.set(new_data)
|
|
281
|
+
|
|
282
|
+
|
|
283
|
+
def on_timeframe_selection(chart): # Called when the user changes the timeframe.
|
|
284
|
+
new_data = get_bar_data(chart.topbar['symbol'].value, chart.topbar['timeframe'].value)
|
|
285
|
+
if new_data.empty:
|
|
286
|
+
return
|
|
287
|
+
chart.set(new_data, True)
|
|
288
|
+
|
|
289
|
+
|
|
290
|
+
def on_horizontal_line_move(chart, line):
|
|
291
|
+
print(f'Horizontal line moved to: {line.price}')
|
|
292
|
+
|
|
293
|
+
|
|
294
|
+
if __name__ == '__main__':
|
|
295
|
+
chart = Chart(toolbox=True)
|
|
296
|
+
chart.legend(True)
|
|
297
|
+
|
|
298
|
+
chart.events.search += on_search
|
|
299
|
+
|
|
300
|
+
chart.topbar.textbox('symbol', 'TSLA')
|
|
301
|
+
chart.topbar.switcher('timeframe', ('1min', '5min', '30min'), default='5min',
|
|
302
|
+
func=on_timeframe_selection)
|
|
303
|
+
|
|
304
|
+
df = get_bar_data('TSLA', '5min')
|
|
305
|
+
chart.set(df)
|
|
306
|
+
|
|
307
|
+
chart.horizontal_line(200, func=on_horizontal_line_move)
|
|
308
|
+
|
|
309
|
+
chart.show(block=True)
|
|
310
|
+
|
|
311
|
+
```
|
|
312
|
+
|
|
313
|
+
___
|
|
314
|
+
|
|
315
|
+
<div align="center">
|
|
316
|
+
_This package is an independent creation and has not been endorsed, sponsored, or approved by TradingView. The author of this package does not have any official relationship with TradingView, and the package does not represent the views or opinions of TradingView._
|
|
317
|
+
</div>
|
|
@@ -0,0 +1,299 @@
|
|
|
1
|
+
<div align="center">
|
|
2
|
+
|
|
3
|
+
# bn-lightweight-charts-python
|
|
4
|
+
|
|
5
|
+
[](https://pypi.org/project/bn_lightweight-charts/)
|
|
6
|
+
[](https://python.org "Go to Python homepage")
|
|
7
|
+
[](https://github.com/smalinin/bn_lightweight-charts-python/blob/main/LICENSE)
|
|
8
|
+
[](https://lightweight-charts-python.readthedocs.io/en/latest/index.html)
|
|
9
|
+
|
|
10
|
+
lightweight-charts-python aims to provide a simple and pythonic way to access and implement [TradingView's Lightweight Charts](https://www.tradingview.com/lightweight-charts/).
|
|
11
|
+
|
|
12
|
+
</div>
|
|
13
|
+
|
|
14
|
+
## Installation
|
|
15
|
+
```
|
|
16
|
+
pip install bn-lightweight-charts
|
|
17
|
+
```
|
|
18
|
+
## History
|
|
19
|
+
Package is based on [lightweight-charts-python](https://github.com/louisnw01/lightweight-charts-python)
|
|
20
|
+
Changes:
|
|
21
|
+
|
|
22
|
+
- used lightweight-charts js v:5.x
|
|
23
|
+
- added milti-pane support from lightweight-charts js v:5.x
|
|
24
|
+
- added support for charts resize and panel resize
|
|
25
|
+
- fixed issue with sync charts
|
|
26
|
+
- added support view in browser
|
|
27
|
+
|
|
28
|
+
|
|
29
|
+
## Features
|
|
30
|
+
1. Streamlined for live data, with methods for updating directly from tick data.
|
|
31
|
+
2. Multi-pane charts using [Subcharts](https://lightweight-charts-python.readthedocs.io/en/latest/reference/abstract_chart.html#AbstractChart.create_subchart).
|
|
32
|
+
3. The [Toolbox](https://lightweight-charts-python.readthedocs.io/en/latest/reference/toolbox.html), allowing for trendlines, rectangles, rays and horizontal lines to be drawn directly onto charts.
|
|
33
|
+
4. [Events](https://lightweight-charts-python.readthedocs.io/en/latest/tutorials/events.html) allowing for timeframe selectors (1min, 5min, 30min etc.), searching, hotkeys, and more.
|
|
34
|
+
5. [Tables](https://lightweight-charts-python.readthedocs.io/en/latest/reference/tables.html) for watchlists, order entry, and trade management.
|
|
35
|
+
6. Direct integration of market data through [Polygon.io's](https://polygon.io/?utm_source=affiliate&utm_campaign=pythonlwcharts) market data API.
|
|
36
|
+
|
|
37
|
+
__Supports:__ Jupyter Notebooks, PyQt6, PyQt5, PySide6, wxPython, Streamlit, and asyncio.
|
|
38
|
+
|
|
39
|
+
PartTimeLarry: [Interactive Brokers API and TradingView Charts in Python](https://www.youtube.com/watch?v=TlhDI3PforA)
|
|
40
|
+
___
|
|
41
|
+
|
|
42
|
+
## Samples
|
|
43
|
+
### 0. Multi-pane support
|
|
44
|
+
```
|
|
45
|
+
import pandas as pd
|
|
46
|
+
import webbrowser
|
|
47
|
+
from bn_lightweight_charts import HTMLChart
|
|
48
|
+
|
|
49
|
+
def calculate_sma(df, period: int = 50, name = None):
|
|
50
|
+
name = name or f'SMA {period}'
|
|
51
|
+
return pd.DataFrame({
|
|
52
|
+
'time': df['date'],
|
|
53
|
+
name: df['close'].rolling(window=period).mean()
|
|
54
|
+
}) #.dropna()
|
|
55
|
+
|
|
56
|
+
def demo():
|
|
57
|
+
chart = HTMLChart(width=1200, height=800, inner_height=-500, filename='charts.html')
|
|
58
|
+
chart.legend(visible=True)
|
|
59
|
+
df = pd.read_csv('./PDATA/4ohlcv.csv')
|
|
60
|
+
chart.set(df)
|
|
61
|
+
|
|
62
|
+
# Pane 0
|
|
63
|
+
line7 = chart.create_line('SMA 7', color='red', price_line=False, price_label=False)
|
|
64
|
+
sma7_data = calculate_sma(df, period=7)
|
|
65
|
+
line7.set(sma7_data)
|
|
66
|
+
line14 = chart.create_line('SMA 14', color='blue', price_line=False, price_label=False)
|
|
67
|
+
sma14_data = calculate_sma(df, period=14)
|
|
68
|
+
line14.set(sma14_data)
|
|
69
|
+
|
|
70
|
+
# Pane 1
|
|
71
|
+
sma20_data = calculate_sma(df, period=20, name='Hist SMA(20)')
|
|
72
|
+
line20 = chart.create_histogram('Hist SMA(20)', price_line=False, price_label=False, pane_index=1)
|
|
73
|
+
line20.set(sma20_data)
|
|
74
|
+
|
|
75
|
+
# Pane 2
|
|
76
|
+
sma50_data = calculate_sma(df, period=50)
|
|
77
|
+
line50 = chart.create_line('SMA 50', color='green', price_line=False, price_label=False, pane_index=2)
|
|
78
|
+
line50.set(sma50_data)
|
|
79
|
+
|
|
80
|
+
chart.load()
|
|
81
|
+
webbrowser.open(chart.filename)
|
|
82
|
+
|
|
83
|
+
if __name__ == '__main__':
|
|
84
|
+
demo()
|
|
85
|
+
```
|
|
86
|
+

|
|
87
|
+
|
|
88
|
+
|
|
89
|
+
|
|
90
|
+
### 1. Display data from a csv:
|
|
91
|
+
|
|
92
|
+
```python
|
|
93
|
+
import pandas as pd
|
|
94
|
+
from bn_lightweight_charts import Chart
|
|
95
|
+
|
|
96
|
+
|
|
97
|
+
if __name__ == '__main__':
|
|
98
|
+
|
|
99
|
+
chart = Chart()
|
|
100
|
+
|
|
101
|
+
# Columns: time | open | high | low | close | volume
|
|
102
|
+
df = pd.read_csv('ohlcv.csv')
|
|
103
|
+
chart.set(df)
|
|
104
|
+
|
|
105
|
+
chart.show(block=True)
|
|
106
|
+
|
|
107
|
+
```
|
|
108
|
+

|
|
109
|
+
___
|
|
110
|
+
|
|
111
|
+
### 2. Updating bars in real-time:
|
|
112
|
+
|
|
113
|
+
```python
|
|
114
|
+
import pandas as pd
|
|
115
|
+
from time import sleep
|
|
116
|
+
from bn_lightweight_charts import Chart
|
|
117
|
+
|
|
118
|
+
if __name__ == '__main__':
|
|
119
|
+
|
|
120
|
+
chart = Chart()
|
|
121
|
+
|
|
122
|
+
df1 = pd.read_csv('ohlcv.csv')
|
|
123
|
+
df2 = pd.read_csv('next_ohlcv.csv')
|
|
124
|
+
|
|
125
|
+
chart.set(df1)
|
|
126
|
+
|
|
127
|
+
chart.show()
|
|
128
|
+
|
|
129
|
+
last_close = df1.iloc[-1]['close']
|
|
130
|
+
|
|
131
|
+
for i, series in df2.iterrows():
|
|
132
|
+
chart.update(series)
|
|
133
|
+
|
|
134
|
+
if series['close'] > 20 and last_close < 20:
|
|
135
|
+
chart.marker(text='The price crossed $20!')
|
|
136
|
+
|
|
137
|
+
last_close = series['close']
|
|
138
|
+
sleep(0.1)
|
|
139
|
+
|
|
140
|
+
```
|
|
141
|
+
|
|
142
|
+

|
|
143
|
+
___
|
|
144
|
+
|
|
145
|
+
### 3. Updating bars from tick data in real-time:
|
|
146
|
+
|
|
147
|
+
```python
|
|
148
|
+
import pandas as pd
|
|
149
|
+
from time import sleep
|
|
150
|
+
from bn_lightweight_charts import Chart
|
|
151
|
+
|
|
152
|
+
|
|
153
|
+
if __name__ == '__main__':
|
|
154
|
+
|
|
155
|
+
df1 = pd.read_csv('ohlc.csv')
|
|
156
|
+
|
|
157
|
+
# Columns: time | price
|
|
158
|
+
df2 = pd.read_csv('ticks.csv')
|
|
159
|
+
|
|
160
|
+
chart = Chart()
|
|
161
|
+
|
|
162
|
+
chart.set(df1)
|
|
163
|
+
|
|
164
|
+
chart.show()
|
|
165
|
+
|
|
166
|
+
for i, tick in df2.iterrows():
|
|
167
|
+
chart.update_from_tick(tick)
|
|
168
|
+
|
|
169
|
+
sleep(0.03)
|
|
170
|
+
|
|
171
|
+
```
|
|
172
|
+

|
|
173
|
+
___
|
|
174
|
+
|
|
175
|
+
### 4. Line Indicators:
|
|
176
|
+
|
|
177
|
+
```python
|
|
178
|
+
import pandas as pd
|
|
179
|
+
from bn_lightweight_charts import Chart
|
|
180
|
+
|
|
181
|
+
|
|
182
|
+
def calculate_sma(df, period: int = 50):
|
|
183
|
+
return pd.DataFrame({
|
|
184
|
+
'time': df['date'],
|
|
185
|
+
f'SMA {period}': df['close'].rolling(window=period).mean()
|
|
186
|
+
}).dropna()
|
|
187
|
+
|
|
188
|
+
|
|
189
|
+
if __name__ == '__main__':
|
|
190
|
+
chart = Chart()
|
|
191
|
+
chart.legend(visible=True)
|
|
192
|
+
|
|
193
|
+
df = pd.read_csv('ohlcv.csv')
|
|
194
|
+
chart.set(df)
|
|
195
|
+
|
|
196
|
+
line = chart.create_line('SMA 50')
|
|
197
|
+
sma_data = calculate_sma(df, period=50)
|
|
198
|
+
line.set(sma_data)
|
|
199
|
+
|
|
200
|
+
chart.show(block=True)
|
|
201
|
+
|
|
202
|
+
```
|
|
203
|
+

|
|
204
|
+
___
|
|
205
|
+
|
|
206
|
+
### 5. Styling:
|
|
207
|
+
|
|
208
|
+
```python
|
|
209
|
+
import pandas as pd
|
|
210
|
+
from bn_lightweight_charts import Chart
|
|
211
|
+
|
|
212
|
+
|
|
213
|
+
if __name__ == '__main__':
|
|
214
|
+
|
|
215
|
+
chart = Chart()
|
|
216
|
+
|
|
217
|
+
df = pd.read_csv('ohlcv.csv')
|
|
218
|
+
|
|
219
|
+
chart.layout(background_color='#090008', text_color='#FFFFFF', font_size=16,
|
|
220
|
+
font_family='Helvetica')
|
|
221
|
+
|
|
222
|
+
chart.candle_style(up_color='#00ff55', down_color='#ed4807',
|
|
223
|
+
border_up_color='#FFFFFF', border_down_color='#FFFFFF',
|
|
224
|
+
wick_up_color='#FFFFFF', wick_down_color='#FFFFFF')
|
|
225
|
+
|
|
226
|
+
chart.volume_config(up_color='#00ff55', down_color='#ed4807')
|
|
227
|
+
|
|
228
|
+
chart.watermark('1D', color='rgba(180, 180, 240, 0.7)')
|
|
229
|
+
|
|
230
|
+
chart.crosshair(mode='normal', vert_color='#FFFFFF', vert_style='dotted',
|
|
231
|
+
horz_color='#FFFFFF', horz_style='dotted')
|
|
232
|
+
|
|
233
|
+
chart.legend(visible=True, font_size=14)
|
|
234
|
+
|
|
235
|
+
chart.set(df)
|
|
236
|
+
|
|
237
|
+
chart.show(block=True)
|
|
238
|
+
|
|
239
|
+
```
|
|
240
|
+

|
|
241
|
+
___
|
|
242
|
+
|
|
243
|
+
### 6. Callbacks:
|
|
244
|
+
|
|
245
|
+
```python
|
|
246
|
+
import pandas as pd
|
|
247
|
+
from bn_lightweight_charts import Chart
|
|
248
|
+
|
|
249
|
+
|
|
250
|
+
def get_bar_data(symbol, timeframe):
|
|
251
|
+
if symbol not in ('AAPL', 'GOOGL', 'TSLA'):
|
|
252
|
+
print(f'No data for "{symbol}"')
|
|
253
|
+
return pd.DataFrame()
|
|
254
|
+
return pd.read_csv(f'bar_data/{symbol}_{timeframe}.csv')
|
|
255
|
+
|
|
256
|
+
|
|
257
|
+
def on_search(chart, searched_string): # Called when the user searches.
|
|
258
|
+
new_data = get_bar_data(searched_string, chart.topbar['timeframe'].value)
|
|
259
|
+
if new_data.empty:
|
|
260
|
+
return
|
|
261
|
+
chart.topbar['symbol'].set(searched_string)
|
|
262
|
+
chart.set(new_data)
|
|
263
|
+
|
|
264
|
+
|
|
265
|
+
def on_timeframe_selection(chart): # Called when the user changes the timeframe.
|
|
266
|
+
new_data = get_bar_data(chart.topbar['symbol'].value, chart.topbar['timeframe'].value)
|
|
267
|
+
if new_data.empty:
|
|
268
|
+
return
|
|
269
|
+
chart.set(new_data, True)
|
|
270
|
+
|
|
271
|
+
|
|
272
|
+
def on_horizontal_line_move(chart, line):
|
|
273
|
+
print(f'Horizontal line moved to: {line.price}')
|
|
274
|
+
|
|
275
|
+
|
|
276
|
+
if __name__ == '__main__':
|
|
277
|
+
chart = Chart(toolbox=True)
|
|
278
|
+
chart.legend(True)
|
|
279
|
+
|
|
280
|
+
chart.events.search += on_search
|
|
281
|
+
|
|
282
|
+
chart.topbar.textbox('symbol', 'TSLA')
|
|
283
|
+
chart.topbar.switcher('timeframe', ('1min', '5min', '30min'), default='5min',
|
|
284
|
+
func=on_timeframe_selection)
|
|
285
|
+
|
|
286
|
+
df = get_bar_data('TSLA', '5min')
|
|
287
|
+
chart.set(df)
|
|
288
|
+
|
|
289
|
+
chart.horizontal_line(200, func=on_horizontal_line_move)
|
|
290
|
+
|
|
291
|
+
chart.show(block=True)
|
|
292
|
+
|
|
293
|
+
```
|
|
294
|
+

|
|
295
|
+
___
|
|
296
|
+
|
|
297
|
+
<div align="center">
|
|
298
|
+
_This package is an independent creation and has not been endorsed, sponsored, or approved by TradingView. The author of this package does not have any official relationship with TradingView, and the package does not represent the views or opinions of TradingView._
|
|
299
|
+
</div>
|