bfplot 1.0.0__tar.gz
This diff represents the content of publicly available package versions that have been released to one of the supported registries. The information contained in this diff is provided for informational purposes only and reflects changes between package versions as they appear in their respective public registries.
- bfplot-1.0.0/.gitignore +11 -0
- bfplot-1.0.0/LICENSE +21 -0
- bfplot-1.0.0/PKG-INFO +220 -0
- bfplot-1.0.0/README.md +194 -0
- bfplot-1.0.0/examples/README.md +5 -0
- bfplot-1.0.0/examples/gallery.py +349 -0
- bfplot-1.0.0/pyproject.toml +65 -0
- bfplot-1.0.0/src/bfplot/__init__.py +38 -0
- bfplot-1.0.0/src/bfplot/adapters/__init__.py +1 -0
- bfplot-1.0.0/src/bfplot/adapters/matplotlib.py +543 -0
- bfplot-1.0.0/src/bfplot/api.py +196 -0
- bfplot-1.0.0/src/bfplot/artifact.py +302 -0
- bfplot-1.0.0/src/bfplot/bfir.py +263 -0
- bfplot-1.0.0/src/bfplot/bfir.schema.json +110 -0
- bfplot-1.0.0/src/bfplot/preview.py +553 -0
- bfplot-1.0.0/src/bfplot/py.typed +0 -0
- bfplot-1.0.0/src/bfplot/result.py +231 -0
- bfplot-1.0.0/src/bfplot/temporal.py +212 -0
- bfplot-1.0.0/tests/conftest.py +16 -0
- bfplot-1.0.0/tests/helpers.py +35 -0
- bfplot-1.0.0/tests/test_animation.py +113 -0
- bfplot-1.0.0/tests/test_api.py +255 -0
- bfplot-1.0.0/tests/test_bfir.py +125 -0
- bfplot-1.0.0/tests/test_compile.py +106 -0
- bfplot-1.0.0/tests/test_examples.py +55 -0
- bfplot-1.0.0/tests/test_hash.py +230 -0
- bfplot-1.0.0/tests/test_result.py +343 -0
bfplot-1.0.0/.gitignore
ADDED
bfplot-1.0.0/LICENSE
ADDED
|
@@ -0,0 +1,21 @@
|
|
|
1
|
+
MIT License
|
|
2
|
+
|
|
3
|
+
Copyright (c) 2026 Bryan Fichera
|
|
4
|
+
|
|
5
|
+
Permission is hereby granted, free of charge, to any person obtaining a copy
|
|
6
|
+
of this software and associated documentation files (the "Software"), to deal
|
|
7
|
+
in the Software without restriction, including without limitation the rights
|
|
8
|
+
to use, copy, modify, merge, publish, distribute, sublicense, and/or sell
|
|
9
|
+
copies of the Software, and to permit persons to whom the Software is
|
|
10
|
+
furnished to do so, subject to the following conditions:
|
|
11
|
+
|
|
12
|
+
The above copyright notice and this permission notice shall be included in all
|
|
13
|
+
copies or substantial portions of the Software.
|
|
14
|
+
|
|
15
|
+
THE SOFTWARE IS PROVIDED "AS IS", WITHOUT WARRANTY OF ANY KIND, EXPRESS OR
|
|
16
|
+
IMPLIED, INCLUDING BUT NOT LIMITED TO THE WARRANTIES OF MERCHANTABILITY,
|
|
17
|
+
FITNESS FOR A PARTICULAR PURPOSE AND NONINFRINGEMENT. IN NO EVENT SHALL THE
|
|
18
|
+
AUTHORS OR COPYRIGHT HOLDERS BE LIABLE FOR ANY CLAIM, DAMAGES OR OTHER
|
|
19
|
+
LIABILITY, WHETHER IN AN ACTION OF CONTRACT, TORT OR OTHERWISE, ARISING FROM,
|
|
20
|
+
OUT OF OR IN CONNECTION WITH THE SOFTWARE OR THE USE OR OTHER DEALINGS IN THE
|
|
21
|
+
SOFTWARE.
|
bfplot-1.0.0/PKG-INFO
ADDED
|
@@ -0,0 +1,220 @@
|
|
|
1
|
+
Metadata-Version: 2.5
|
|
2
|
+
Name: bfplot
|
|
3
|
+
Version: 1.0.0
|
|
4
|
+
Summary: Interactive, reproducible scientific plots, with a Python implementation for Matplotlib
|
|
5
|
+
Project-URL: Homepage, https://bfichera.github.io/bfplot/
|
|
6
|
+
Project-URL: Documentation, https://bfichera.github.io/bfplot/
|
|
7
|
+
Project-URL: Repository, https://github.com/bfichera/bfplot
|
|
8
|
+
Project-URL: Issues, https://github.com/bfichera/bfplot/issues
|
|
9
|
+
Project-URL: Changelog, https://github.com/bfichera/bfplot/releases
|
|
10
|
+
Author: BFPlot contributors
|
|
11
|
+
License-Expression: MIT
|
|
12
|
+
License-File: LICENSE
|
|
13
|
+
Keywords: matplotlib,plotting,reproducibility,scientific,visualization
|
|
14
|
+
Classifier: Development Status :: 4 - Beta
|
|
15
|
+
Classifier: Framework :: Matplotlib
|
|
16
|
+
Classifier: Intended Audience :: Science/Research
|
|
17
|
+
Classifier: Programming Language :: Python :: 3
|
|
18
|
+
Classifier: Programming Language :: Python :: 3 :: Only
|
|
19
|
+
Classifier: Topic :: Scientific/Engineering :: Visualization
|
|
20
|
+
Classifier: Typing :: Typed
|
|
21
|
+
Requires-Python: >=3.10
|
|
22
|
+
Requires-Dist: matplotlib>=3.7
|
|
23
|
+
Requires-Dist: numpy>=1.24
|
|
24
|
+
Requires-Dist: zstandard>=0.21
|
|
25
|
+
Description-Content-Type: text/markdown
|
|
26
|
+
|
|
27
|
+
# BFPlot
|
|
28
|
+
|
|
29
|
+
> **[Read the documentation →](https://bfichera.github.io/bfplot/)**
|
|
30
|
+
|
|
31
|
+
Basically I was tired of saving `matplotlib` outputs as non-interactive static files. I also [hate jupyter notebooks](https://www.youtube.com/watch?v=7jiPeIFXb6U)! `bfplot` lets you save `matplotlib` figures:
|
|
32
|
+
|
|
33
|
+
```python
|
|
34
|
+
import matplotlib.pyplot as plt
|
|
35
|
+
import bfplot
|
|
36
|
+
|
|
37
|
+
fig, ax = plt.subplots()
|
|
38
|
+
ax.plot([1, 2, 3, 4], [1, 4, 9, 16], marker="o")
|
|
39
|
+
|
|
40
|
+
bfplot.savefig("my_plot.bfplot", fig)
|
|
41
|
+
```
|
|
42
|
+
|
|
43
|
+
in a format that you can open up and interact with later using an integrated viewer app:
|
|
44
|
+
|
|
45
|
+
```console
|
|
46
|
+
$ bfplot view my_plot.bfplot
|
|
47
|
+
```
|
|
48
|
+
|
|
49
|
+
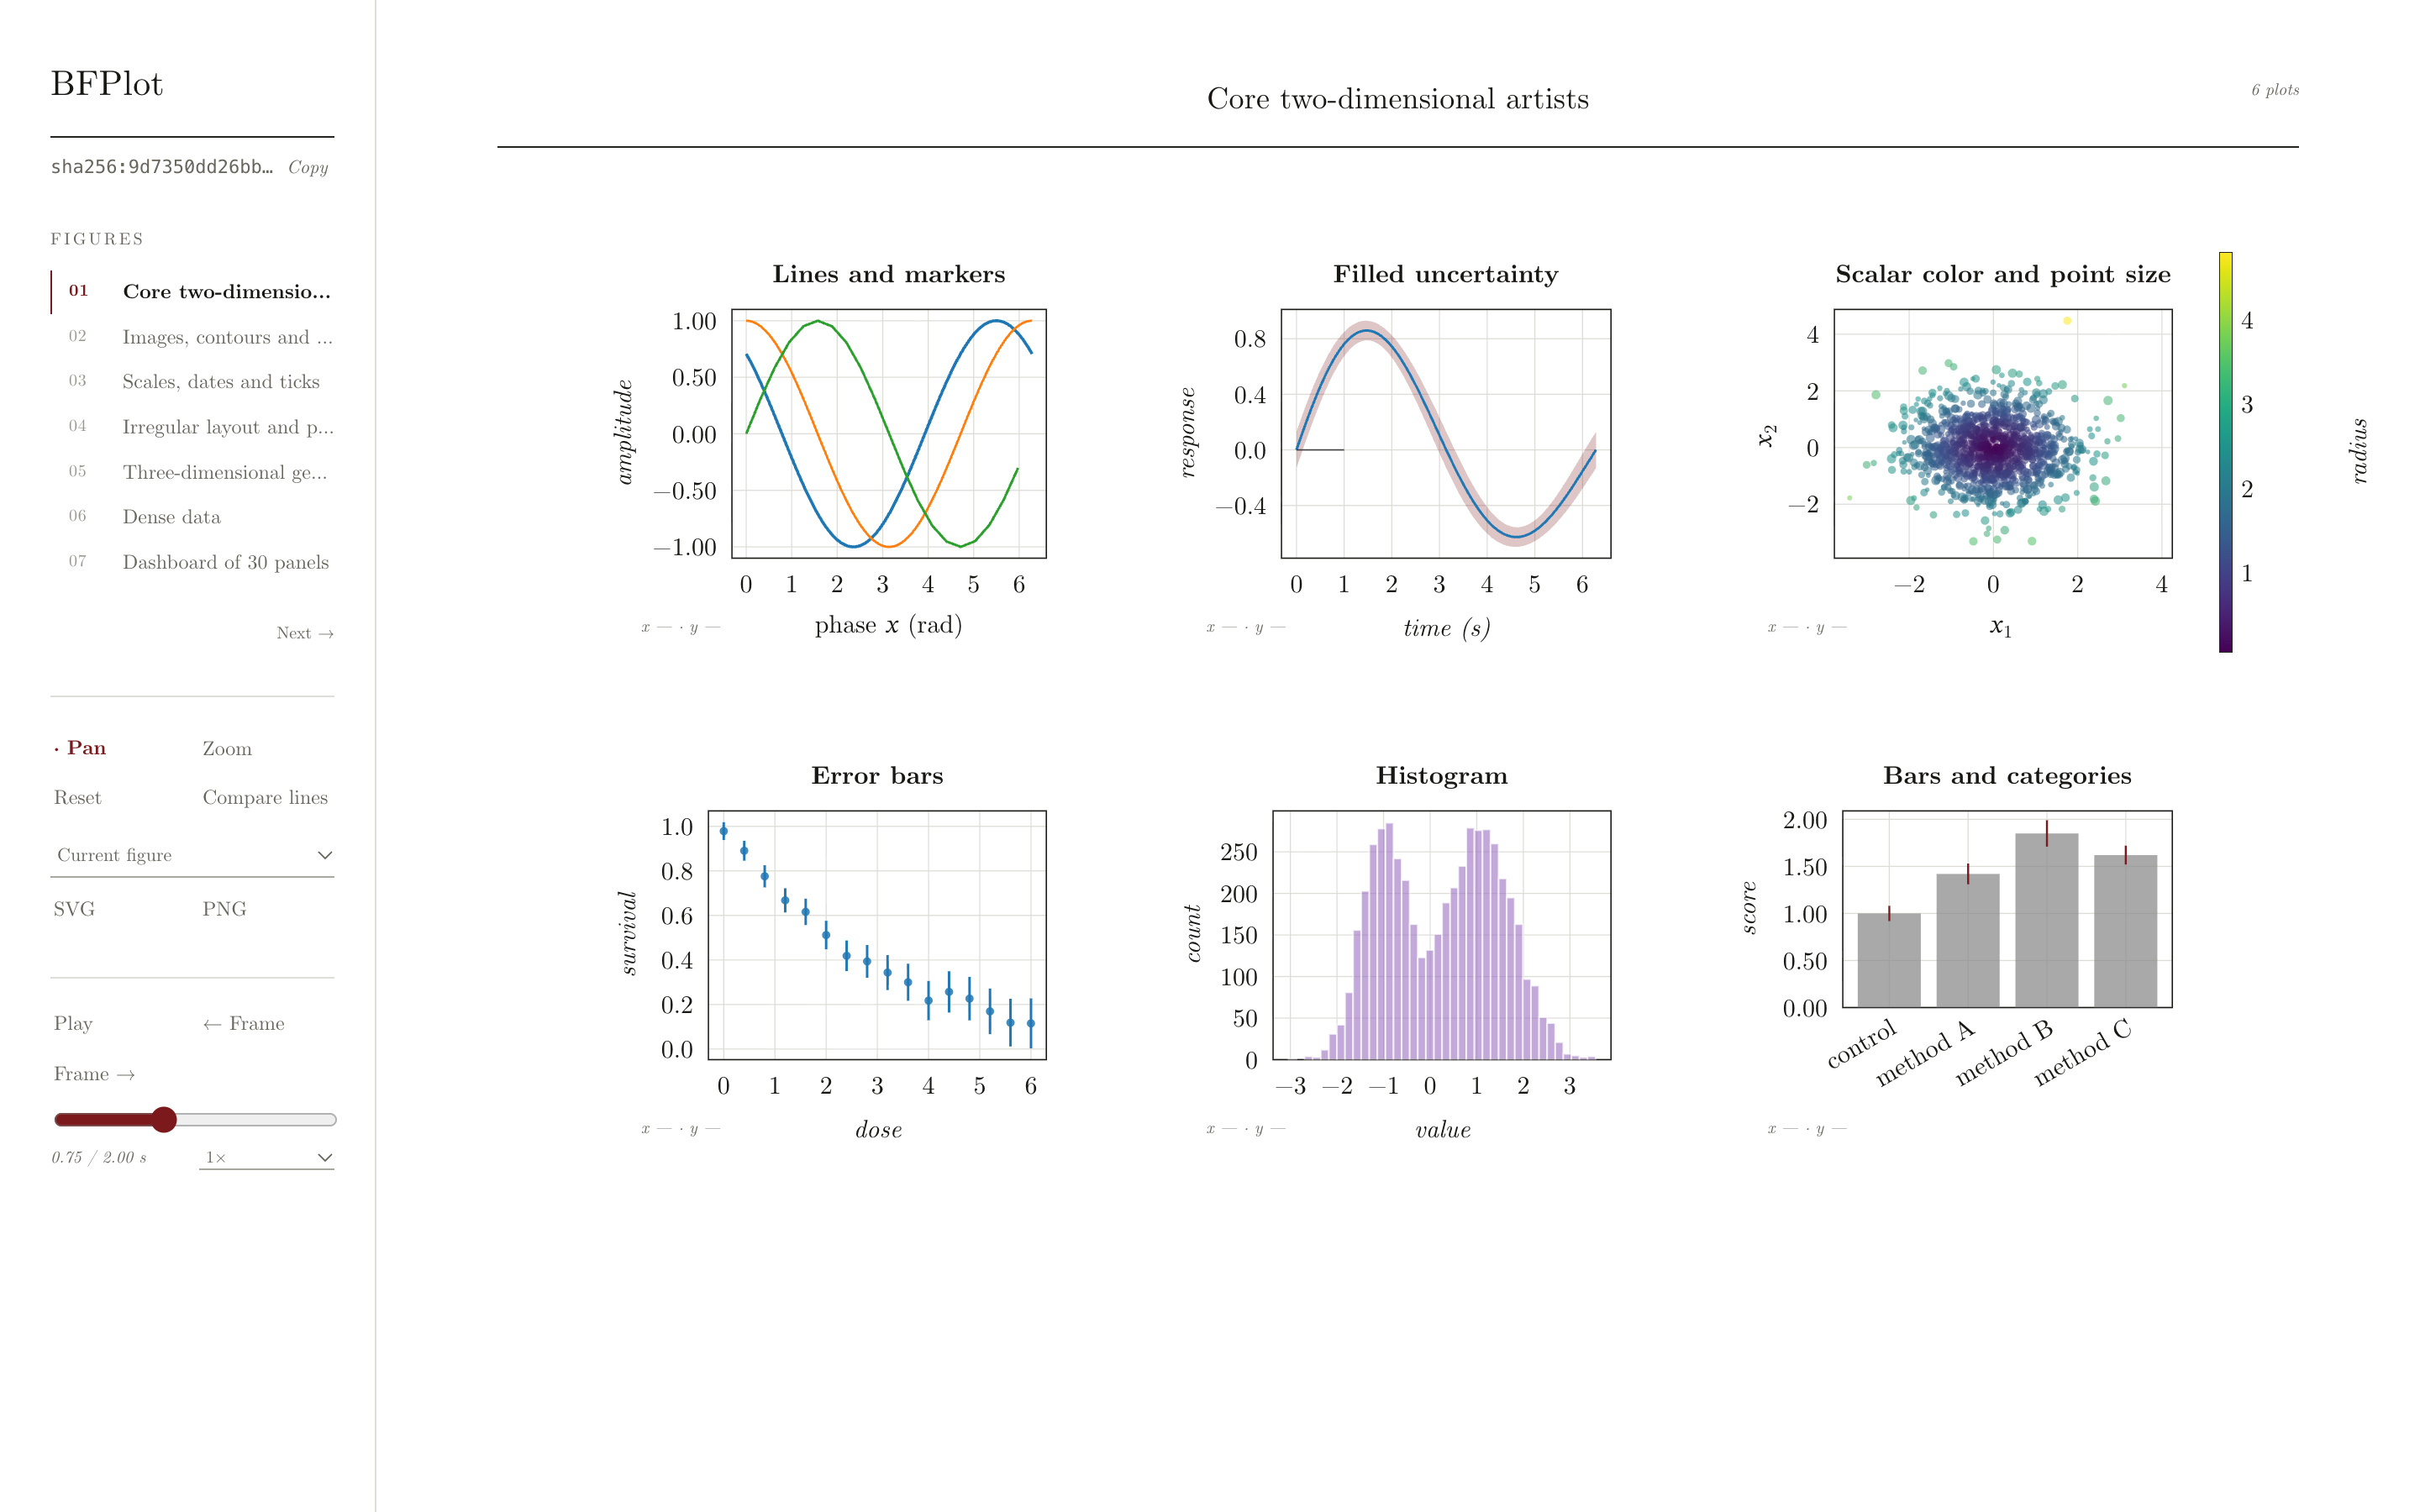
Here's what the viewer looks like:
|
|
50
|
+
|
|
51
|
+
|
|
52
|
+
|
|
53
|
+
## Installation
|
|
54
|
+
|
|
55
|
+
Install the `bfplot` app, which has the viewer built in, on macOS or Linux:
|
|
56
|
+
|
|
57
|
+
```console
|
|
58
|
+
$ curl -LsSf https://github.com/bfichera/bfplot/releases/latest/download/install.sh | sh
|
|
59
|
+
```
|
|
60
|
+
|
|
61
|
+
Then install the Python interface (Python 3.10+):
|
|
62
|
+
|
|
63
|
+
```console
|
|
64
|
+
$ python -m pip install bfplot
|
|
65
|
+
```
|
|
66
|
+
|
|
67
|
+
See [Installation](https://bfichera.github.io/bfplot/getting-started/installation/) for uninstalling and other options.
|
|
68
|
+
|
|
69
|
+
## Building from source
|
|
70
|
+
|
|
71
|
+
On other platforms, or to build everything yourself, you need:
|
|
72
|
+
|
|
73
|
+
- Python 3.10+ (pip 25.1+ if you want the development dependency groups)
|
|
74
|
+
- Rust 1.88+ (install with [rustup](https://rustup.rs))
|
|
75
|
+
- Node.js, only if you change the viewer
|
|
76
|
+
|
|
77
|
+
Clone the repository and install both parts into a virtual environment:
|
|
78
|
+
|
|
79
|
+
```console
|
|
80
|
+
$ git clone https://github.com/bfichera/bfplot.git
|
|
81
|
+
$ cd bfplot
|
|
82
|
+
$ python -m venv .venv
|
|
83
|
+
$ . .venv/bin/activate
|
|
84
|
+
$ python -m pip install --upgrade pip
|
|
85
|
+
$ python -m pip install ./crates/bfplot-cli -e .
|
|
86
|
+
```
|
|
87
|
+
|
|
88
|
+
`./crates/bfplot-cli` compiles the `bfplot` app with Cargo (through maturin) and installs it into the same environment as the Python library, where `bfplot.show()` finds it even if the environment is not activated. `-e .` installs the Python library in editable mode. Check both parts:
|
|
89
|
+
|
|
90
|
+
```console
|
|
91
|
+
$ python -c "import bfplot; print(bfplot.__version__)"
|
|
92
|
+
$ bfplot --version
|
|
93
|
+
```
|
|
94
|
+
|
|
95
|
+
To build only the app, without Python:
|
|
96
|
+
|
|
97
|
+
```console
|
|
98
|
+
$ cargo build --release --locked -p bfplot-cli
|
|
99
|
+
```
|
|
100
|
+
|
|
101
|
+
The binary is written to `target/release/bfplot`; copy it anywhere on your `PATH`.
|
|
102
|
+
|
|
103
|
+
For the development setup, tests and linters, see [Contributing](https://github.com/bfichera/bfplot/blob/main/CONTRIBUTING.md).
|
|
104
|
+
|
|
105
|
+
## Results
|
|
106
|
+
|
|
107
|
+
The code here:
|
|
108
|
+
|
|
109
|
+
```python
|
|
110
|
+
with bfplot.result("results/fit.bfplot") as result:
|
|
111
|
+
result.add(fig_spectrum, name="spectrum")
|
|
112
|
+
result.add(fig_residuals, name="residuals")
|
|
113
|
+
```
|
|
114
|
+
produces a directory called `results/fit.bfplot` with the following structure:
|
|
115
|
+
```text
|
|
116
|
+
results/fit.bfplot/
|
|
117
|
+
├── manifest.toml
|
|
118
|
+
├── .gitignore
|
|
119
|
+
└── objects/
|
|
120
|
+
```
|
|
121
|
+
|
|
122
|
+
The `.gitignore` file keeps the data (in `objects/`) out of version control.
|
|
123
|
+
|
|
124
|
+
By default, `manifest.toml` ends with a rough ASCII/Braille drawing of each figure, written as `#` comments. It lets you see the plot in a diff or commit without opening the viewer. Pass `preview=False` to leave it out.
|
|
125
|
+
|
|
126
|
+
```toml
|
|
127
|
+
# Preview (approximate; regenerated on every save)
|
|
128
|
+
#
|
|
129
|
+
# ── calibration · Detector calibration ──────────────────────────────────
|
|
130
|
+
# 1.1┌──────────────── Response ─────────────────┐
|
|
131
|
+
# s │⠐⠲⣄⡴⠒⠲⡄ ⣠⠖⠂ │
|
|
132
|
+
# i │ ⢠⠟⣆ ⠙⣆ ⣰⠃ │
|
|
133
|
+
# g │⢀⠏ ⠘⣆ ⠘⡆ ⣰⠃ │
|
|
134
|
+
# -1.1└───────────────────────────────────────────┘
|
|
135
|
+
# 0 6.3
|
|
136
|
+
```
|
|
137
|
+
|
|
138
|
+
## Animations
|
|
139
|
+
|
|
140
|
+
```python
|
|
141
|
+
with bfplot.animation("wave.bfplot", fig, fps=30) as recording:
|
|
142
|
+
for phase in np.linspace(0, 2 * np.pi, 180, endpoint=False):
|
|
143
|
+
line.set_ydata(np.sin(x + phase))
|
|
144
|
+
recording.capture()
|
|
145
|
+
```
|
|
146
|
+
|
|
147
|
+
## Hashes
|
|
148
|
+
|
|
149
|
+
Every result has one hash, recorded in its manifest. Two results have the same hash exactly when everything in them is identical.
|
|
150
|
+
|
|
151
|
+
```python
|
|
152
|
+
bfplot.hash("results/fit.bfplot") # 'sha256:769fe097...'
|
|
153
|
+
bfplot.hash(fig) # the same figure, hashed without writing
|
|
154
|
+
bfplot.same("old/fit.bfplot", "new/fit.bfplot")
|
|
155
|
+
bfplot.verify("results/fit.bfplot") # check every object, return the hash
|
|
156
|
+
```
|
|
157
|
+
|
|
158
|
+
```console
|
|
159
|
+
$ bfplot hash results/fit.bfplot
|
|
160
|
+
sha256:769fe0976cfeecf73414d7b467013c6cde561405bce6c5af5828836e03016e37
|
|
161
|
+
$ bfplot compare old/fit.bfplot new/fit.bfplot
|
|
162
|
+
different
|
|
163
|
+
sha256:769fe097... old/fit.bfplot
|
|
164
|
+
sha256:45a78207... new/fit.bfplot
|
|
165
|
+
figures[0].axes[0].title: "Tent" -> "Tall tent"
|
|
166
|
+
```
|
|
167
|
+
|
|
168
|
+
## Serving
|
|
169
|
+
|
|
170
|
+
`bfplot view` serves a result and opens it in your browser. `bfplot serve` does the same without opening a browser. By default the server listens on `127.0.0.1:8080`; use `--port` to change the port.
|
|
171
|
+
|
|
172
|
+
To serve remotely, bind to another address explicitly:
|
|
173
|
+
|
|
174
|
+
```console
|
|
175
|
+
$ bfplot serve my_plot.bfplot --bind 0.0.0.0 --port 9000
|
|
176
|
+
```
|
|
177
|
+
|
|
178
|
+
### Example: Using BFPlot with psana (SLAC S3DF)
|
|
179
|
+
|
|
180
|
+
On S3DF (`ssh <username>@s3df.slac.stanford.edu`, then to your psana node), start the server without a browser:
|
|
181
|
+
|
|
182
|
+
```console
|
|
183
|
+
$ bfplot serve /path/to/my_plot.bfplot --port 9000
|
|
184
|
+
```
|
|
185
|
+
|
|
186
|
+
On your own machine, forward the port through S3DF to the node running the server:
|
|
187
|
+
|
|
188
|
+
```console
|
|
189
|
+
$ ssh -L 9000:<psana-node>:9000 <username>@s3df.slac.stanford.edu
|
|
190
|
+
```
|
|
191
|
+
|
|
192
|
+
Then open <http://127.0.0.1:9000> in your local browser. If you run the server on the login node itself, use `localhost` in place of `<psana-node>`.
|
|
193
|
+
|
|
194
|
+
## Supported plots
|
|
195
|
+
|
|
196
|
+
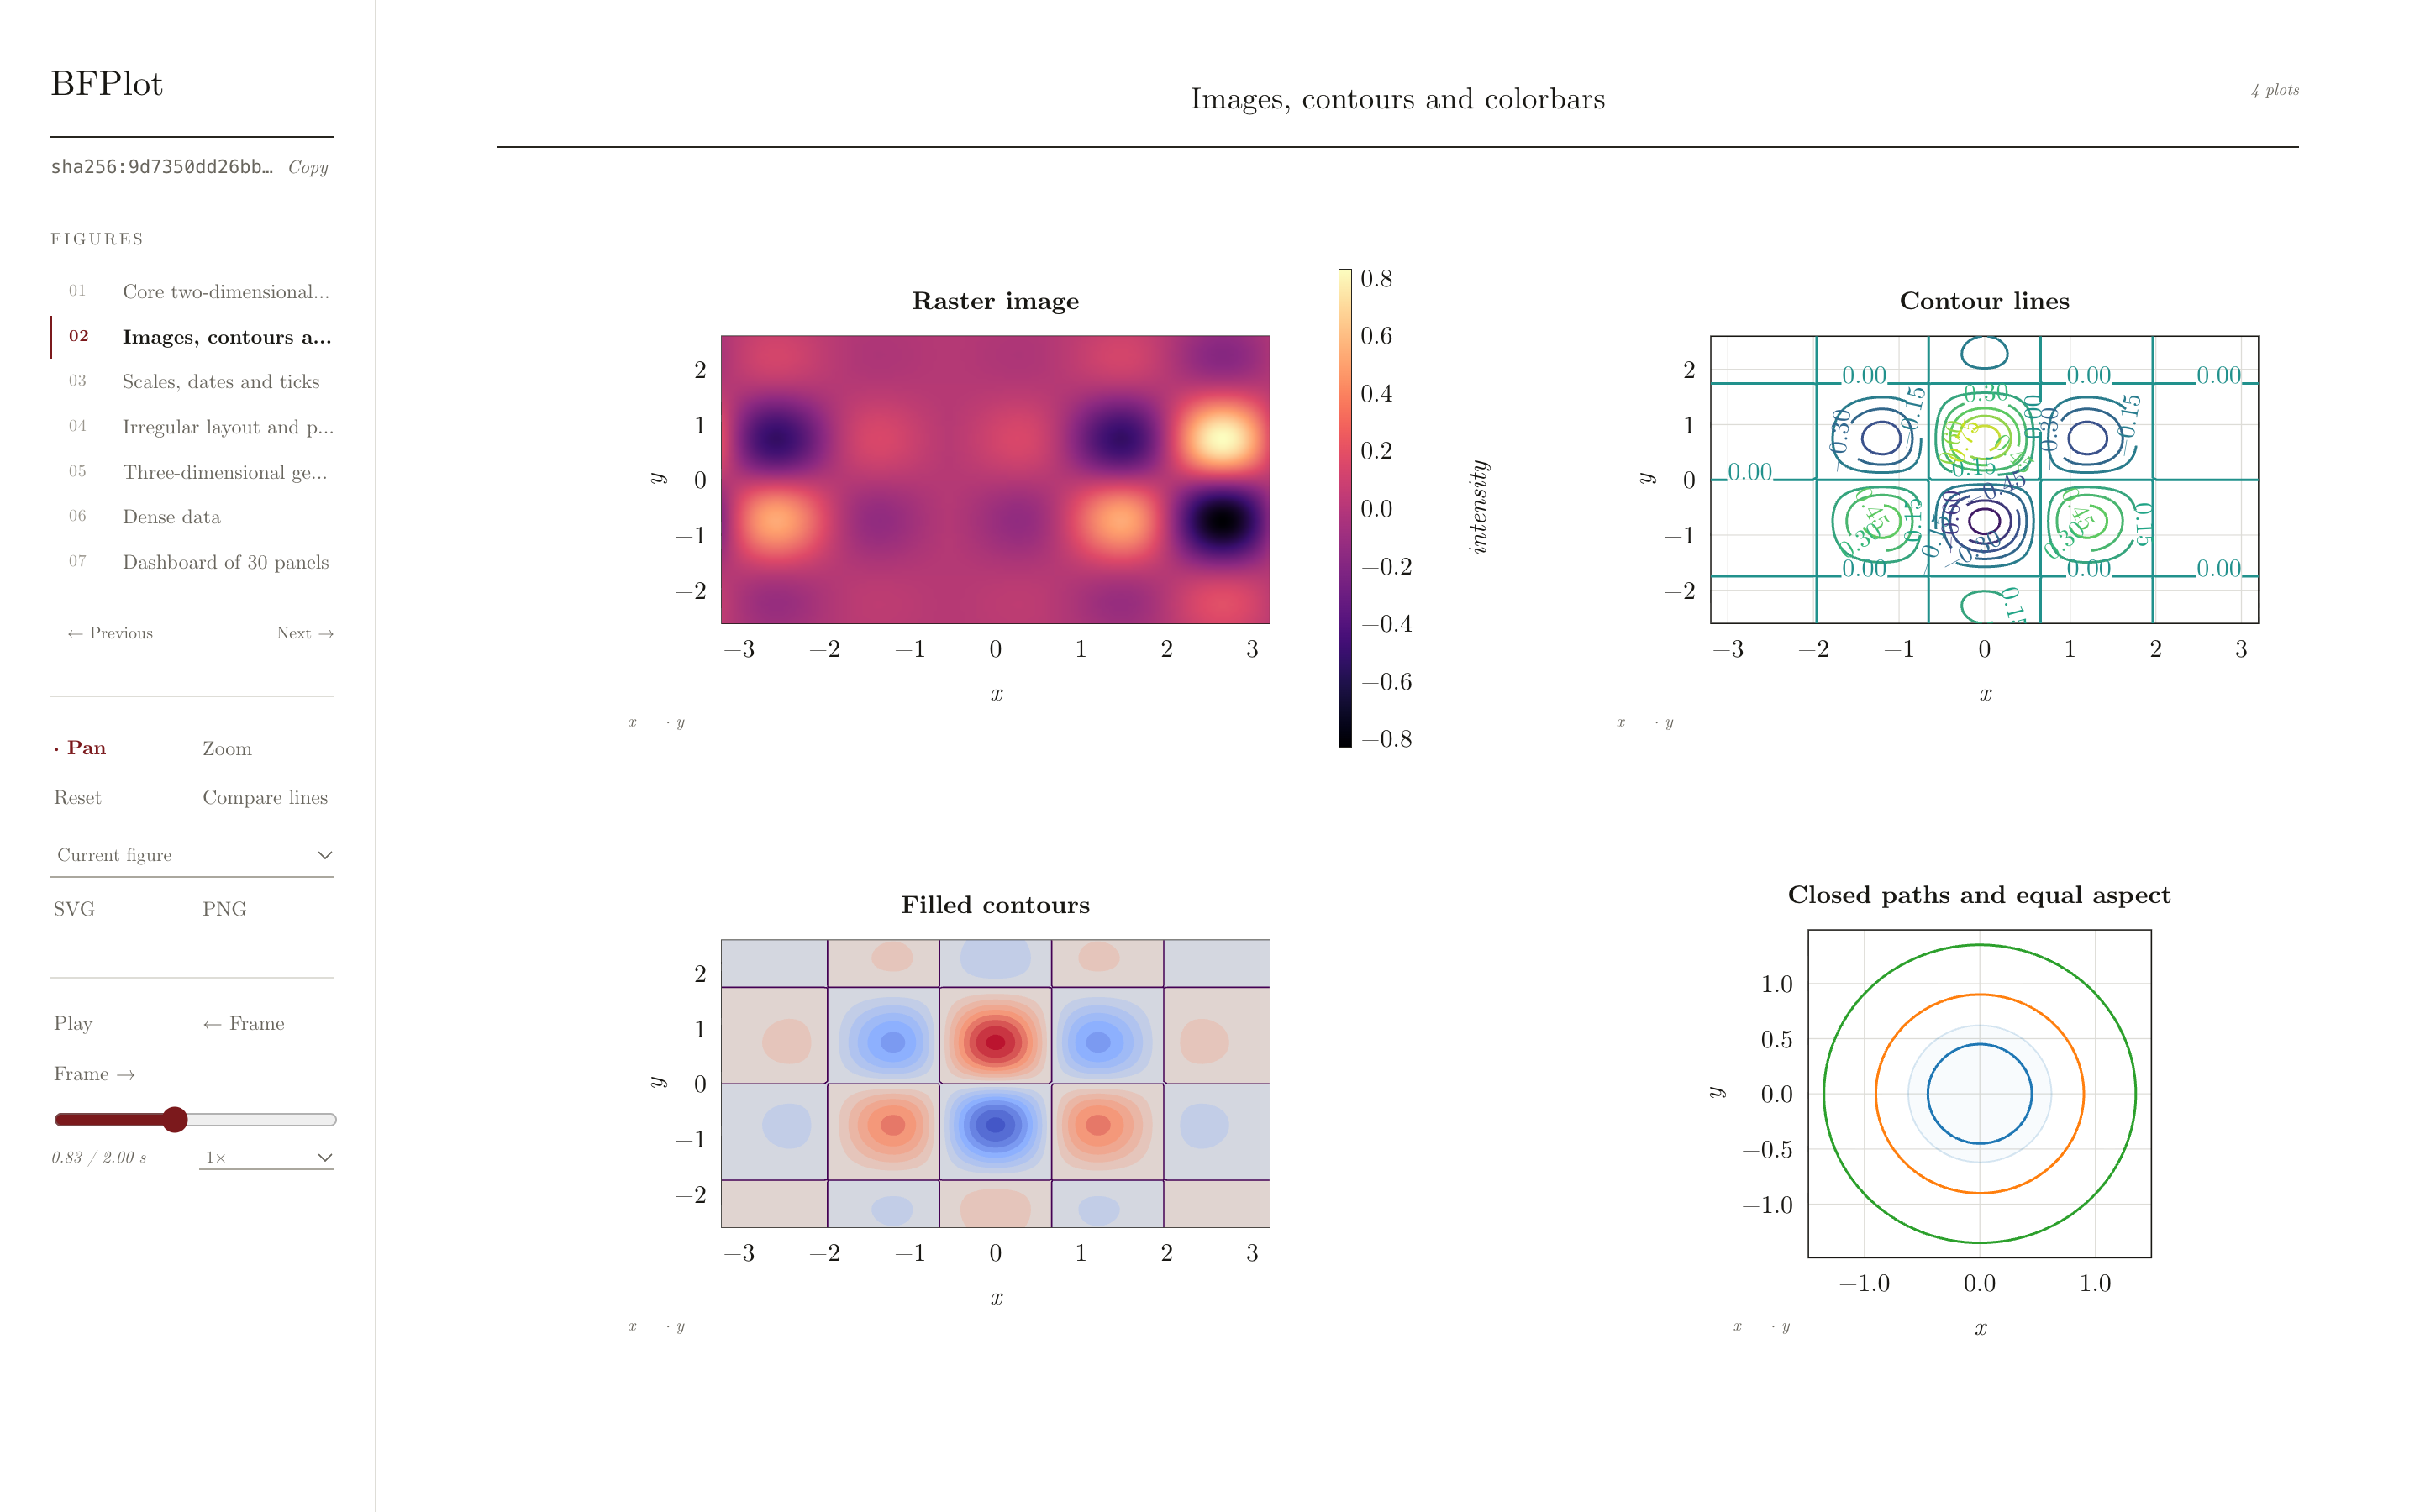
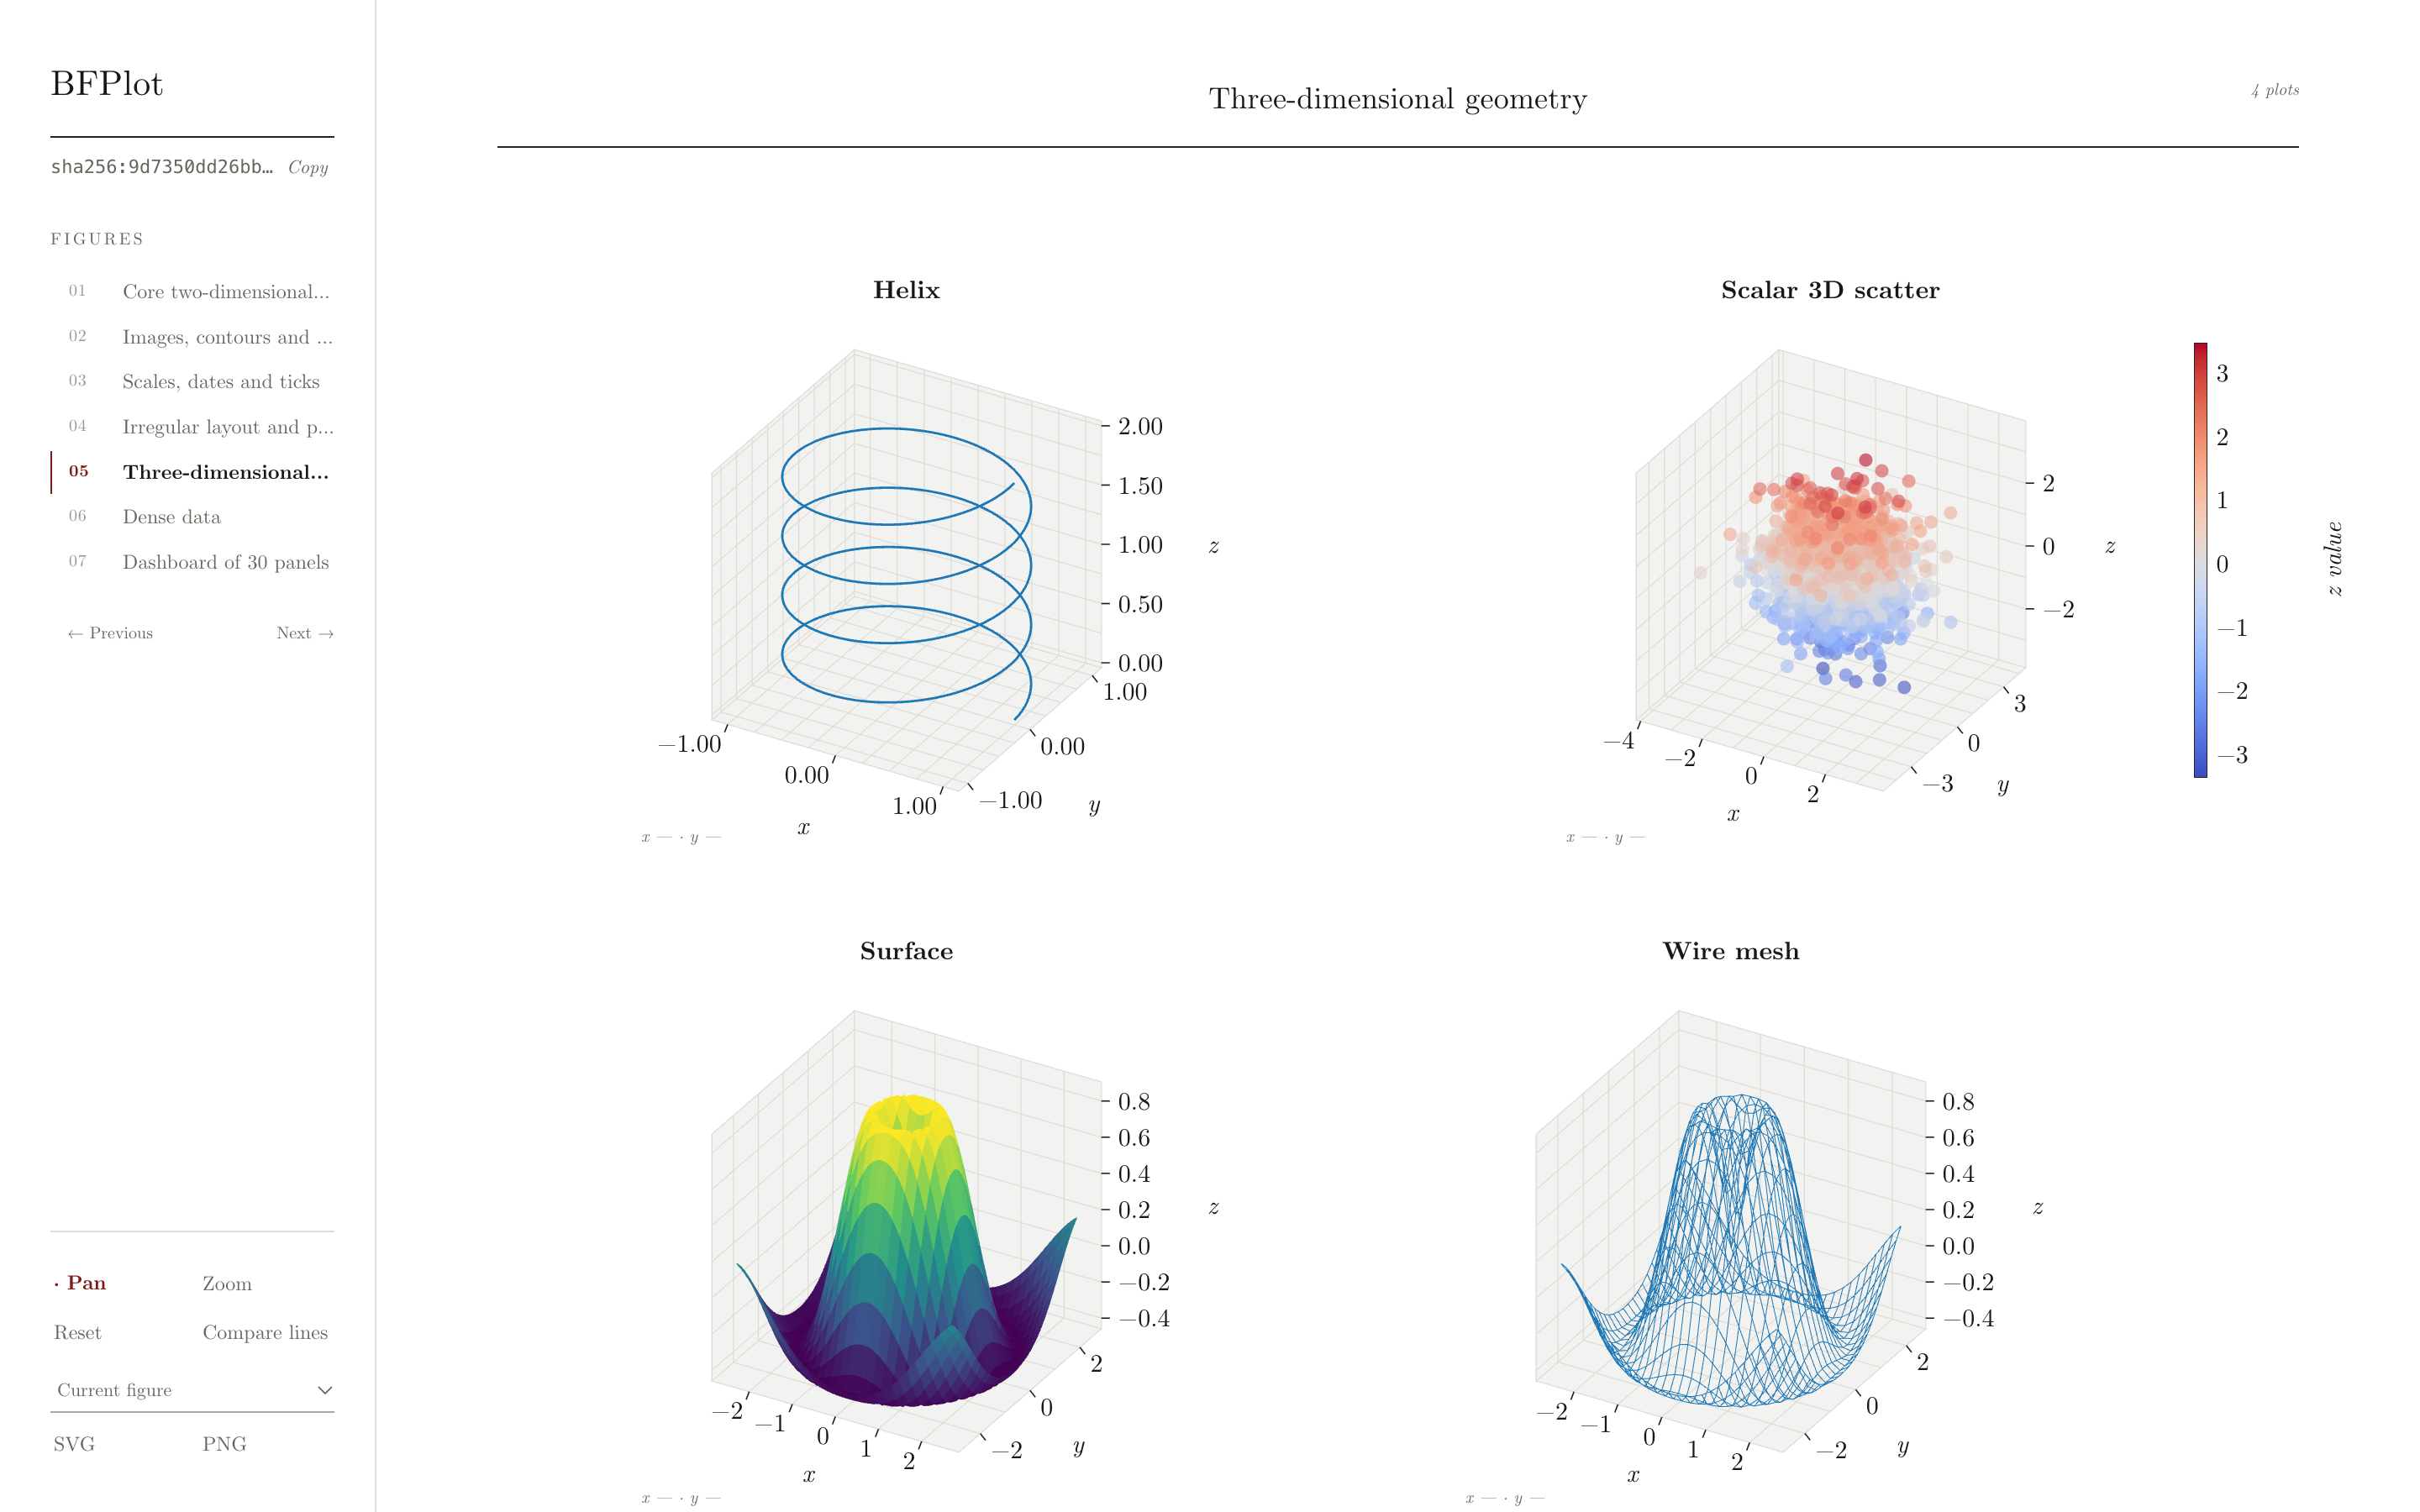
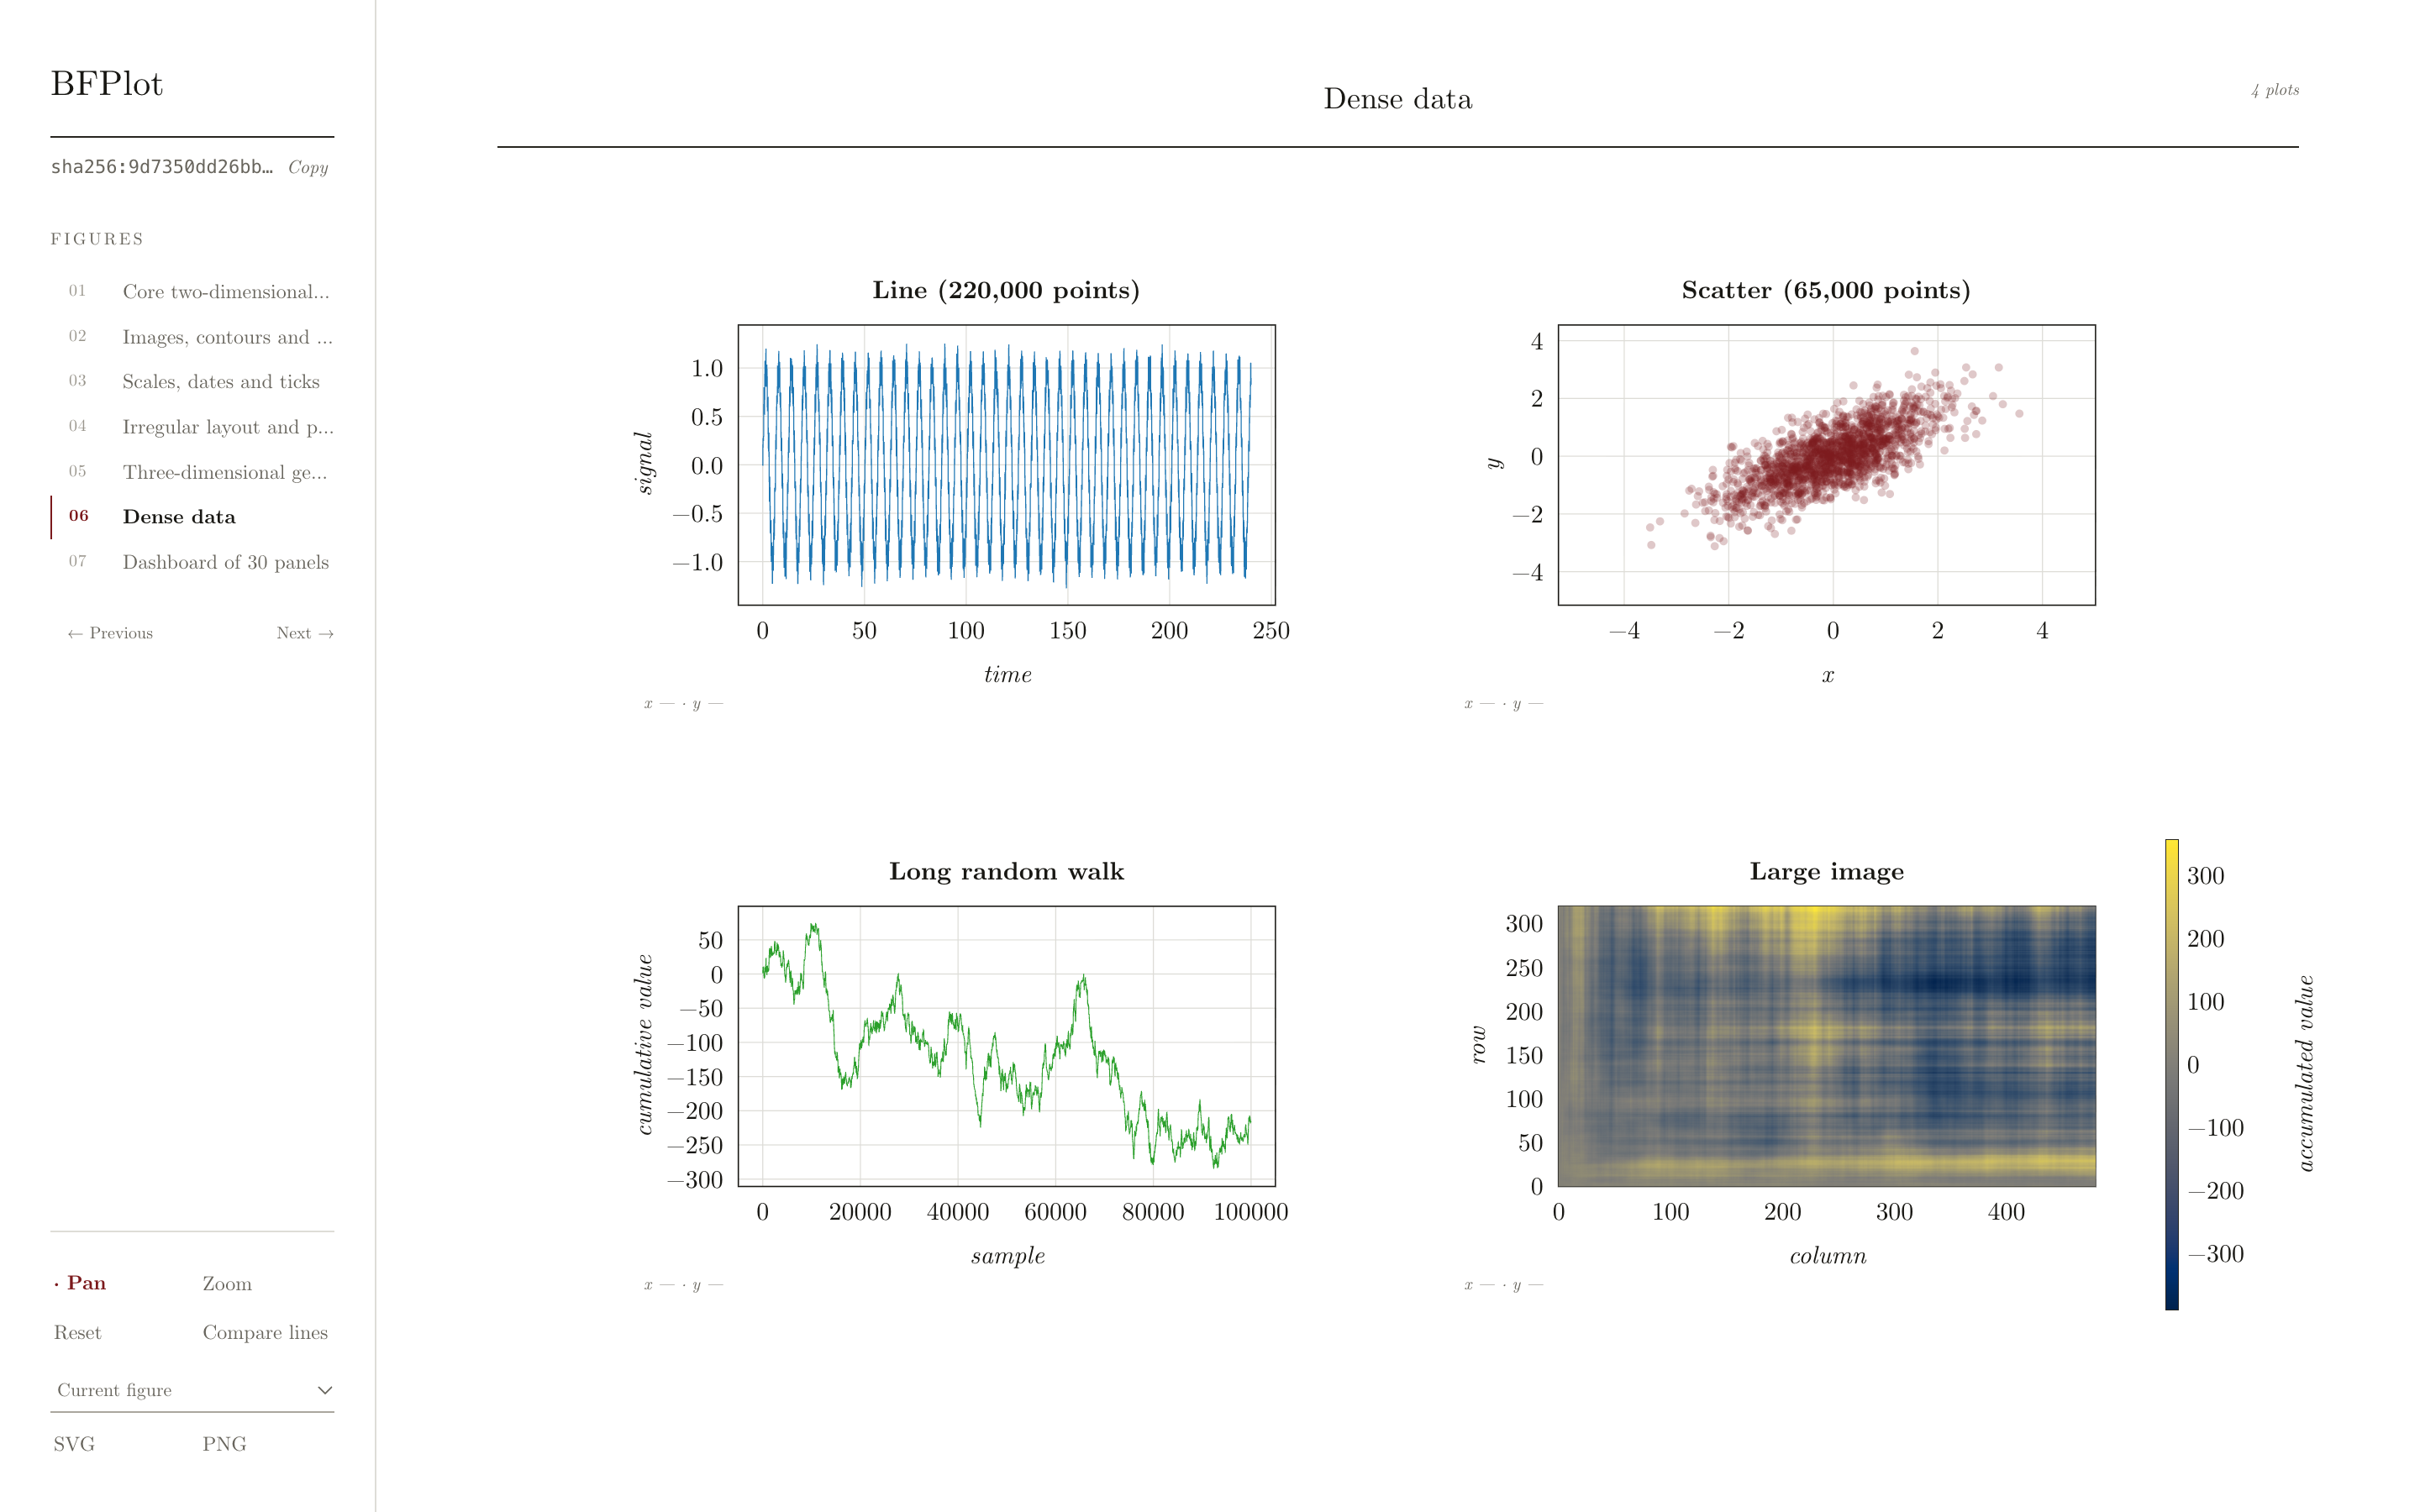
Lines, scatter plots, images, error bars, filled regions, histograms, contours, text, patches and common 3D plots. Anything else is shown as a visible placeholder, never silently dropped.
|
|
197
|
+
|
|
198
|
+
To see them all, run the [example gallery](https://github.com/bfichera/bfplot/blob/main/examples/gallery.py): `python examples/gallery.py`, then `bfplot view gallery.bfplot`.
|
|
199
|
+
|
|
200
|
+
| Images, contours and colorbars | Three-dimensional geometry |
|
|
201
|
+
| --- | --- |
|
|
202
|
+
|  |  |
|
|
203
|
+
|
|
204
|
+
| Dense data |
|
|
205
|
+
| --- |
|
|
206
|
+
|  |
|
|
207
|
+
|
|
208
|
+
The first two gallery figures are independent animations: each has its own play button, timeline slider and frame rate, shown in the left rail while that figure is on screen.
|
|
209
|
+
|
|
210
|
+
## Security
|
|
211
|
+
|
|
212
|
+
Only open bfplot results from sources you trust.
|
|
213
|
+
|
|
214
|
+
## More
|
|
215
|
+
|
|
216
|
+
- [Contributing](https://github.com/bfichera/bfplot/blob/main/CONTRIBUTING.md)
|
|
217
|
+
|
|
218
|
+
## License
|
|
219
|
+
|
|
220
|
+
MIT License: [LICENSE](https://github.com/bfichera/bfplot/blob/main/LICENSE).
|
bfplot-1.0.0/README.md
ADDED
|
@@ -0,0 +1,194 @@
|
|
|
1
|
+
# BFPlot
|
|
2
|
+
|
|
3
|
+
> **[Read the documentation →](https://bfichera.github.io/bfplot/)**
|
|
4
|
+
|
|
5
|
+
Basically I was tired of saving `matplotlib` outputs as non-interactive static files. I also [hate jupyter notebooks](https://www.youtube.com/watch?v=7jiPeIFXb6U)! `bfplot` lets you save `matplotlib` figures:
|
|
6
|
+
|
|
7
|
+
```python
|
|
8
|
+
import matplotlib.pyplot as plt
|
|
9
|
+
import bfplot
|
|
10
|
+
|
|
11
|
+
fig, ax = plt.subplots()
|
|
12
|
+
ax.plot([1, 2, 3, 4], [1, 4, 9, 16], marker="o")
|
|
13
|
+
|
|
14
|
+
bfplot.savefig("my_plot.bfplot", fig)
|
|
15
|
+
```
|
|
16
|
+
|
|
17
|
+
in a format that you can open up and interact with later using an integrated viewer app:
|
|
18
|
+
|
|
19
|
+
```console
|
|
20
|
+
$ bfplot view my_plot.bfplot
|
|
21
|
+
```
|
|
22
|
+
|
|
23
|
+
Here's what the viewer looks like:
|
|
24
|
+
|
|
25
|
+

|
|
26
|
+
|
|
27
|
+
## Installation
|
|
28
|
+
|
|
29
|
+
Install the `bfplot` app, which has the viewer built in, on macOS or Linux:
|
|
30
|
+
|
|
31
|
+
```console
|
|
32
|
+
$ curl -LsSf https://github.com/bfichera/bfplot/releases/latest/download/install.sh | sh
|
|
33
|
+
```
|
|
34
|
+
|
|
35
|
+
Then install the Python interface (Python 3.10+):
|
|
36
|
+
|
|
37
|
+
```console
|
|
38
|
+
$ python -m pip install bfplot
|
|
39
|
+
```
|
|
40
|
+
|
|
41
|
+
See [Installation](https://bfichera.github.io/bfplot/getting-started/installation/) for uninstalling and other options.
|
|
42
|
+
|
|
43
|
+
## Building from source
|
|
44
|
+
|
|
45
|
+
On other platforms, or to build everything yourself, you need:
|
|
46
|
+
|
|
47
|
+
- Python 3.10+ (pip 25.1+ if you want the development dependency groups)
|
|
48
|
+
- Rust 1.88+ (install with [rustup](https://rustup.rs))
|
|
49
|
+
- Node.js, only if you change the viewer
|
|
50
|
+
|
|
51
|
+
Clone the repository and install both parts into a virtual environment:
|
|
52
|
+
|
|
53
|
+
```console
|
|
54
|
+
$ git clone https://github.com/bfichera/bfplot.git
|
|
55
|
+
$ cd bfplot
|
|
56
|
+
$ python -m venv .venv
|
|
57
|
+
$ . .venv/bin/activate
|
|
58
|
+
$ python -m pip install --upgrade pip
|
|
59
|
+
$ python -m pip install ./crates/bfplot-cli -e .
|
|
60
|
+
```
|
|
61
|
+
|
|
62
|
+
`./crates/bfplot-cli` compiles the `bfplot` app with Cargo (through maturin) and installs it into the same environment as the Python library, where `bfplot.show()` finds it even if the environment is not activated. `-e .` installs the Python library in editable mode. Check both parts:
|
|
63
|
+
|
|
64
|
+
```console
|
|
65
|
+
$ python -c "import bfplot; print(bfplot.__version__)"
|
|
66
|
+
$ bfplot --version
|
|
67
|
+
```
|
|
68
|
+
|
|
69
|
+
To build only the app, without Python:
|
|
70
|
+
|
|
71
|
+
```console
|
|
72
|
+
$ cargo build --release --locked -p bfplot-cli
|
|
73
|
+
```
|
|
74
|
+
|
|
75
|
+
The binary is written to `target/release/bfplot`; copy it anywhere on your `PATH`.
|
|
76
|
+
|
|
77
|
+
For the development setup, tests and linters, see [Contributing](https://github.com/bfichera/bfplot/blob/main/CONTRIBUTING.md).
|
|
78
|
+
|
|
79
|
+
## Results
|
|
80
|
+
|
|
81
|
+
The code here:
|
|
82
|
+
|
|
83
|
+
```python
|
|
84
|
+
with bfplot.result("results/fit.bfplot") as result:
|
|
85
|
+
result.add(fig_spectrum, name="spectrum")
|
|
86
|
+
result.add(fig_residuals, name="residuals")
|
|
87
|
+
```
|
|
88
|
+
produces a directory called `results/fit.bfplot` with the following structure:
|
|
89
|
+
```text
|
|
90
|
+
results/fit.bfplot/
|
|
91
|
+
├── manifest.toml
|
|
92
|
+
├── .gitignore
|
|
93
|
+
└── objects/
|
|
94
|
+
```
|
|
95
|
+
|
|
96
|
+
The `.gitignore` file keeps the data (in `objects/`) out of version control.
|
|
97
|
+
|
|
98
|
+
By default, `manifest.toml` ends with a rough ASCII/Braille drawing of each figure, written as `#` comments. It lets you see the plot in a diff or commit without opening the viewer. Pass `preview=False` to leave it out.
|
|
99
|
+
|
|
100
|
+
```toml
|
|
101
|
+
# Preview (approximate; regenerated on every save)
|
|
102
|
+
#
|
|
103
|
+
# ── calibration · Detector calibration ──────────────────────────────────
|
|
104
|
+
# 1.1┌──────────────── Response ─────────────────┐
|
|
105
|
+
# s │⠐⠲⣄⡴⠒⠲⡄ ⣠⠖⠂ │
|
|
106
|
+
# i │ ⢠⠟⣆ ⠙⣆ ⣰⠃ │
|
|
107
|
+
# g │⢀⠏ ⠘⣆ ⠘⡆ ⣰⠃ │
|
|
108
|
+
# -1.1└───────────────────────────────────────────┘
|
|
109
|
+
# 0 6.3
|
|
110
|
+
```
|
|
111
|
+
|
|
112
|
+
## Animations
|
|
113
|
+
|
|
114
|
+
```python
|
|
115
|
+
with bfplot.animation("wave.bfplot", fig, fps=30) as recording:
|
|
116
|
+
for phase in np.linspace(0, 2 * np.pi, 180, endpoint=False):
|
|
117
|
+
line.set_ydata(np.sin(x + phase))
|
|
118
|
+
recording.capture()
|
|
119
|
+
```
|
|
120
|
+
|
|
121
|
+
## Hashes
|
|
122
|
+
|
|
123
|
+
Every result has one hash, recorded in its manifest. Two results have the same hash exactly when everything in them is identical.
|
|
124
|
+
|
|
125
|
+
```python
|
|
126
|
+
bfplot.hash("results/fit.bfplot") # 'sha256:769fe097...'
|
|
127
|
+
bfplot.hash(fig) # the same figure, hashed without writing
|
|
128
|
+
bfplot.same("old/fit.bfplot", "new/fit.bfplot")
|
|
129
|
+
bfplot.verify("results/fit.bfplot") # check every object, return the hash
|
|
130
|
+
```
|
|
131
|
+
|
|
132
|
+
```console
|
|
133
|
+
$ bfplot hash results/fit.bfplot
|
|
134
|
+
sha256:769fe0976cfeecf73414d7b467013c6cde561405bce6c5af5828836e03016e37
|
|
135
|
+
$ bfplot compare old/fit.bfplot new/fit.bfplot
|
|
136
|
+
different
|
|
137
|
+
sha256:769fe097... old/fit.bfplot
|
|
138
|
+
sha256:45a78207... new/fit.bfplot
|
|
139
|
+
figures[0].axes[0].title: "Tent" -> "Tall tent"
|
|
140
|
+
```
|
|
141
|
+
|
|
142
|
+
## Serving
|
|
143
|
+
|
|
144
|
+
`bfplot view` serves a result and opens it in your browser. `bfplot serve` does the same without opening a browser. By default the server listens on `127.0.0.1:8080`; use `--port` to change the port.
|
|
145
|
+
|
|
146
|
+
To serve remotely, bind to another address explicitly:
|
|
147
|
+
|
|
148
|
+
```console
|
|
149
|
+
$ bfplot serve my_plot.bfplot --bind 0.0.0.0 --port 9000
|
|
150
|
+
```
|
|
151
|
+
|
|
152
|
+
### Example: Using BFPlot with psana (SLAC S3DF)
|
|
153
|
+
|
|
154
|
+
On S3DF (`ssh <username>@s3df.slac.stanford.edu`, then to your psana node), start the server without a browser:
|
|
155
|
+
|
|
156
|
+
```console
|
|
157
|
+
$ bfplot serve /path/to/my_plot.bfplot --port 9000
|
|
158
|
+
```
|
|
159
|
+
|
|
160
|
+
On your own machine, forward the port through S3DF to the node running the server:
|
|
161
|
+
|
|
162
|
+
```console
|
|
163
|
+
$ ssh -L 9000:<psana-node>:9000 <username>@s3df.slac.stanford.edu
|
|
164
|
+
```
|
|
165
|
+
|
|
166
|
+
Then open <http://127.0.0.1:9000> in your local browser. If you run the server on the login node itself, use `localhost` in place of `<psana-node>`.
|
|
167
|
+
|
|
168
|
+
## Supported plots
|
|
169
|
+
|
|
170
|
+
Lines, scatter plots, images, error bars, filled regions, histograms, contours, text, patches and common 3D plots. Anything else is shown as a visible placeholder, never silently dropped.
|
|
171
|
+
|
|
172
|
+
To see them all, run the [example gallery](https://github.com/bfichera/bfplot/blob/main/examples/gallery.py): `python examples/gallery.py`, then `bfplot view gallery.bfplot`.
|
|
173
|
+
|
|
174
|
+
| Images, contours and colorbars | Three-dimensional geometry |
|
|
175
|
+
| --- | --- |
|
|
176
|
+
|  |  |
|
|
177
|
+
|
|
178
|
+
| Dense data |
|
|
179
|
+
| --- |
|
|
180
|
+
|  |
|
|
181
|
+
|
|
182
|
+
The first two gallery figures are independent animations: each has its own play button, timeline slider and frame rate, shown in the left rail while that figure is on screen.
|
|
183
|
+
|
|
184
|
+
## Security
|
|
185
|
+
|
|
186
|
+
Only open bfplot results from sources you trust.
|
|
187
|
+
|
|
188
|
+
## More
|
|
189
|
+
|
|
190
|
+
- [Contributing](https://github.com/bfichera/bfplot/blob/main/CONTRIBUTING.md)
|
|
191
|
+
|
|
192
|
+
## License
|
|
193
|
+
|
|
194
|
+
MIT License: [LICENSE](https://github.com/bfichera/bfplot/blob/main/LICENSE).
|
|
@@ -0,0 +1,5 @@
|
|
|
1
|
+
# Examples
|
|
2
|
+
|
|
3
|
+
- [`gallery.py`](gallery.py): seven figures covering every plot type BFPlot can save, written as one result with an animation. Run `python examples/gallery.py`, then `bfplot view gallery.bfplot`. See the [gallery guide](https://bfichera.github.io/bfplot/guides/gallery/).
|
|
4
|
+
|
|
5
|
+
The tests run every example, so they stay working.
|