bezel-charts 0.1.0__tar.gz
This diff represents the content of publicly available package versions that have been released to one of the supported registries. The information contained in this diff is provided for informational purposes only and reflects changes between package versions as they appear in their respective public registries.
- bezel_charts-0.1.0/.gitignore +7 -0
- bezel_charts-0.1.0/CHANGELOG.md +10 -0
- bezel_charts-0.1.0/LICENSE +21 -0
- bezel_charts-0.1.0/PKG-INFO +160 -0
- bezel_charts-0.1.0/README.md +126 -0
- bezel_charts-0.1.0/pyproject.toml +54 -0
- bezel_charts-0.1.0/src/bezel_charts/__init__.py +120 -0
- bezel_charts-0.1.0/src/bezel_charts/_data.py +163 -0
- bezel_charts-0.1.0/src/bezel_charts/_js.py +285 -0
- bezel_charts-0.1.0/src/bezel_charts/_render.py +49 -0
- bezel_charts-0.1.0/src/bezel_charts/_tile.py +90 -0
- bezel_charts-0.1.0/src/bezel_charts/_util.py +338 -0
- bezel_charts-0.1.0/src/bezel_charts/charts/__init__.py +8 -0
- bezel_charts-0.1.0/src/bezel_charts/charts/line.py +125 -0
- bezel_charts-0.1.0/src/bezel_charts/charts/spark.py +84 -0
- bezel_charts-0.1.0/src/bezel_charts/py.typed +0 -0
- bezel_charts-0.1.0/tests/fixtures/line.json +436 -0
- bezel_charts-0.1.0/tests/fixtures/numbers.json +5420 -0
- bezel_charts-0.1.0/tests/fixtures/spark.json +281 -0
- bezel_charts-0.1.0/tests/test_api.py +121 -0
- bezel_charts-0.1.0/tests/test_parity.py +67 -0
|
@@ -0,0 +1,10 @@
|
|
|
1
|
+
# Changelog (Python package)
|
|
2
|
+
|
|
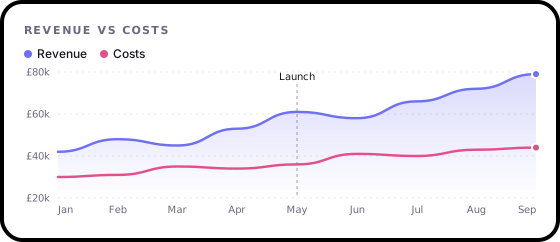
3
|
+
## 0.1.0 (unreleased)
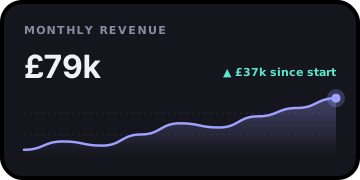
|
|
4
|
+
|
|
5
|
+
First release of the Python companion to Bezel Charts.
|
|
6
|
+
|
|
7
|
+
- `bc.spark()` and `bc.line()` take a pandas DataFrame or Series, a NumPy array, a dict or a plain list, and return a `Chart` that shows up in Jupyter, saves as an `.svg` file and converts to an SVG string.
|
|
8
|
+
- `bc.to_svg()` and `bc.render()` mirror the JavaScript functions of the same names and take the same options, in snake_case, kebab-case or camelCase.
|
|
9
|
+
- The output matches the web components byte for byte, checked against fixtures generated from the JavaScript on every pull request.
|
|
10
|
+
- Zero dependencies. Python 3.10 or newer.
|
|
@@ -0,0 +1,21 @@
|
|
|
1
|
+
MIT License
|
|
2
|
+
|
|
3
|
+
Copyright (c) 2026 Shaz Moghaddam, https://shazmoghaddam.github.io, https://linkedin.com/in/shazmoghaddam, London.
|
|
4
|
+
|
|
5
|
+
Permission is hereby granted, free of charge, to any person obtaining a copy
|
|
6
|
+
of this software and associated documentation files (the "Software"), to deal
|
|
7
|
+
in the Software without restriction, including without limitation the rights
|
|
8
|
+
to use, copy, modify, merge, publish, distribute, sublicense, and/or sell
|
|
9
|
+
copies of the Software, and to permit persons to whom the Software is
|
|
10
|
+
furnished to do so, subject to the following conditions:
|
|
11
|
+
|
|
12
|
+
The above copyright notice and this permission notice shall be included in all
|
|
13
|
+
copies or substantial portions of the Software.
|
|
14
|
+
|
|
15
|
+
THE SOFTWARE IS PROVIDED "AS IS", WITHOUT WARRANTY OF ANY KIND, EXPRESS OR
|
|
16
|
+
IMPLIED, INCLUDING BUT NOT LIMITED TO THE WARRANTIES OF MERCHANTABILITY,
|
|
17
|
+
FITNESS FOR A PARTICULAR PURPOSE AND NONINFRINGEMENT. IN NO EVENT SHALL THE
|
|
18
|
+
AUTHORS OR COPYRIGHT HOLDERS BE LIABLE FOR ANY CLAIM, DAMAGES OR OTHER
|
|
19
|
+
LIABILITY, WHETHER IN AN ACTION OF CONTRACT, TORT OR OTHERWISE, ARISING FROM,
|
|
20
|
+
OUT OF OR IN CONNECTION WITH THE SOFTWARE OR THE USE OR OTHER DEALINGS IN THE
|
|
21
|
+
SOFTWARE.
|
|
@@ -0,0 +1,160 @@
|
|
|
1
|
+
Metadata-Version: 2.5
|
|
2
|
+
Name: bezel-charts
|
|
3
|
+
Version: 0.1.0
|
|
4
|
+
Summary: Polished SVG charts from pandas DataFrames and Python lists, drawn exactly like the Bezel Charts web components. Zero dependencies.
|
|
5
|
+
Project-URL: Homepage, https://shazmoghaddam.github.io/bezel-charts/site/
|
|
6
|
+
Project-URL: Documentation, https://github.com/ShazMoghaddam/bezel-charts/tree/main/python#readme
|
|
7
|
+
Project-URL: Repository, https://github.com/ShazMoghaddam/bezel-charts
|
|
8
|
+
Project-URL: Issues, https://github.com/ShazMoghaddam/bezel-charts/issues
|
|
9
|
+
Project-URL: Changelog, https://github.com/ShazMoghaddam/bezel-charts/blob/main/python/CHANGELOG.md
|
|
10
|
+
Author: Shaz Moghaddam
|
|
11
|
+
License-Expression: MIT
|
|
12
|
+
License-File: LICENSE
|
|
13
|
+
Keywords: charts,data-visualization,jupyter,line-chart,pandas,readme,sparkline,svg
|
|
14
|
+
Classifier: Development Status :: 4 - Beta
|
|
15
|
+
Classifier: Framework :: Jupyter
|
|
16
|
+
Classifier: Intended Audience :: Developers
|
|
17
|
+
Classifier: Intended Audience :: Science/Research
|
|
18
|
+
Classifier: Operating System :: OS Independent
|
|
19
|
+
Classifier: Programming Language :: Python :: 3
|
|
20
|
+
Classifier: Programming Language :: Python :: 3 :: Only
|
|
21
|
+
Classifier: Programming Language :: Python :: 3.10
|
|
22
|
+
Classifier: Programming Language :: Python :: 3.11
|
|
23
|
+
Classifier: Programming Language :: Python :: 3.12
|
|
24
|
+
Classifier: Programming Language :: Python :: 3.13
|
|
25
|
+
Classifier: Programming Language :: Python :: 3.14
|
|
26
|
+
Classifier: Topic :: Scientific/Engineering :: Visualization
|
|
27
|
+
Classifier: Typing :: Typed
|
|
28
|
+
Requires-Python: >=3.10
|
|
29
|
+
Provides-Extra: test
|
|
30
|
+
Requires-Dist: numpy>=1.26; extra == 'test'
|
|
31
|
+
Requires-Dist: pandas>=2; extra == 'test'
|
|
32
|
+
Requires-Dist: pytest>=8; extra == 'test'
|
|
33
|
+
Description-Content-Type: text/markdown
|
|
34
|
+
|
|
35
|
+
# Bezel Charts for Python
|
|
36
|
+
|
|
37
|
+
**Polished SVG charts straight from a pandas DataFrame.**
|
|
38
|
+
|
|
39
|
+
The Python companion to [Bezel Charts](https://github.com/ShazMoghaddam/bezel-charts). Pass in a DataFrame, a Series, a NumPy array or a plain list and get back a finished chart tile that shows up in Jupyter, saves as an `.svg` for a README, and drops into reports and slides. Zero dependencies.
|
|
40
|
+
|
|
41
|
+
|
|
42
|
+
|
|
43
|
+
|
|
44
|
+
|
|
45
|
+
- **Identical to the web components.** The renderers are a line-by-line port of the JavaScript ones, and the test suite checks they draw the same SVG, byte for byte.
|
|
46
|
+
- **pandas friendly.** Pick columns with `x=` and `y=`. Dates, indexes and column names become labels and legends.
|
|
47
|
+
- **Made for READMEs.** Every chart is a self-contained SVG with no scripts and no fonts to load, so GitHub shows it.
|
|
48
|
+
- **No dependencies.** pandas and NumPy work when you have them, and are never required.
|
|
49
|
+
|
|
50
|
+
## Install
|
|
51
|
+
|
|
52
|
+
```sh
|
|
53
|
+
pip install bezel-charts
|
|
54
|
+
```
|
|
55
|
+
|
|
56
|
+
Python 3.10 or newer.
|
|
57
|
+
|
|
58
|
+
## Quick start
|
|
59
|
+
|
|
60
|
+
```python
|
|
61
|
+
import pandas as pd
|
|
62
|
+
import bezel_charts as bc
|
|
63
|
+
|
|
64
|
+
df = pd.DataFrame({
|
|
65
|
+
"month": pd.date_range("2026-01-01", periods=9, freq="MS"),
|
|
66
|
+
"Revenue": [42, 48, 45, 53, 61, 58, 66, 72, 79],
|
|
67
|
+
"Costs": [30, 31, 35, 34, 36, 41, 40, 43, 44],
|
|
68
|
+
})
|
|
69
|
+
|
|
70
|
+
bc.line(df, x="month", x_format="%b", heading="Revenue vs costs",
|
|
71
|
+
prefix="£", suffix="k", notes={"May": "Launch"}, theme="light")
|
|
72
|
+
```
|
|
73
|
+
|
|
74
|
+
In a notebook the chart appears as the cell's output. Anywhere else:
|
|
75
|
+
|
|
76
|
+
```python
|
|
77
|
+
chart = bc.spark(df["Revenue"], heading="Monthly revenue", prefix="£", suffix="k")
|
|
78
|
+
chart.save("docs/revenue.svg") # write an .svg file
|
|
79
|
+
svg = str(chart) # or use the SVG string directly
|
|
80
|
+
```
|
|
81
|
+
|
|
82
|
+
Then in your README:
|
|
83
|
+
|
|
84
|
+
```md
|
|
85
|
+

|
|
86
|
+
```
|
|
87
|
+
|
|
88
|
+
## Charts in this release
|
|
89
|
+
|
|
90
|
+
| Function | What it draws |
|
|
91
|
+
| --- | --- |
|
|
92
|
+
| `bc.spark(data)` | A sparkline with the latest value and the change since the start. |
|
|
93
|
+
| `bc.line(data)` | A line chart with one or more series, a value axis, labels and a legend. |
|
|
94
|
+
|
|
95
|
+
The other eight (bars and grouped bars, scatter with a trend line, rings, donut, gauge, progress and heatmap) are coming in the next releases. `bc.types` lists what's available.
|
|
96
|
+
|
|
97
|
+
## Your data
|
|
98
|
+
|
|
99
|
+
| You pass | You get |
|
|
100
|
+
| --- | --- |
|
|
101
|
+
| A list, tuple or NumPy array | One series. |
|
|
102
|
+
| A pandas Series | One series, with the index as labels unless it's the default 0, 1, 2. |
|
|
103
|
+
| A DataFrame | `y="col"` or `y=["a", "b"]` picks the series (by default every numeric column), `x="col"` the labels (by default the index). |
|
|
104
|
+
| A dict like `{"Team A": [...], "Team B": [...]}` | One series per key, named in the legend. |
|
|
105
|
+
| A list of lists | One series per inner list. |
|
|
106
|
+
|
|
107
|
+
Dates become `2026-03-01`, or anything you like with `x_format="%b %Y"`. Missing values are drawn as 0, like the browser version, with a warning so they never go unnoticed. Call `.dropna()` or `.fillna()` first if you'd rather handle them yourself.
|
|
108
|
+
|
|
109
|
+
## Options
|
|
110
|
+
|
|
111
|
+
Every option from the [web components](https://github.com/ShazMoghaddam/bezel-charts#options-for-every-chart) works as a keyword argument. Use snake_case: `show-values` becomes `show_values=True`.
|
|
112
|
+
|
|
113
|
+
| Option | Example | What it does |
|
|
114
|
+
| --- | --- | --- |
|
|
115
|
+
| `heading` | `heading="Sales"` | Small title at the top. |
|
|
116
|
+
| `prefix`, `suffix` | `prefix="£"`, `suffix=" kWh"` | Around every number. |
|
|
117
|
+
| `decimals` | `decimals=1` | Fixed decimal places. |
|
|
118
|
+
| `compact` | `compact=True` | 15,500 becomes 15.5k. |
|
|
119
|
+
| `stat` | `stat="average"` | Headline number: `last`, `total`, `average`, `max`, `min` or `none`. |
|
|
120
|
+
| `delta`, `delta_label` | `delta="inverse"` | Change since the start. `inverse` makes a fall the good direction. |
|
|
121
|
+
| `goal`, `goal_label` | `goal=50, goal_label="Target"` | A dashed target line. |
|
|
122
|
+
| `notes` | `notes={"May": "Launch"}` | Notes on points, keyed by label or position. |
|
|
123
|
+
| `show_values` | `show_values=True` | A label on every point. |
|
|
124
|
+
| `straight` | `straight=True` | Straight segments instead of curves. |
|
|
125
|
+
| `zero` | `zero=True` | Start the axis at zero (line). |
|
|
126
|
+
| `labels`, `series` | `labels=["Q1", "Q2"]` | Set labels and series names by hand. |
|
|
127
|
+
| `color` | `color=["#ff6600", "#0066ff"]` | Series colours. |
|
|
128
|
+
| `theme` | `theme="light"` | `dark` (the default) or `light`. |
|
|
129
|
+
| `width`, `height` | `width=560` | Size in pixels. The tile grows to fit its heading and headline. |
|
|
130
|
+
| `frame`, `corners`, `background` | `frame="none"` | Drop the bezel, change the corner radius or the tile colour. |
|
|
131
|
+
|
|
132
|
+
Numbers are formatted for `en-GB` by default (`1.5m`, `2bn`), or `lang="en-US"` for `1.5M`, `2B`. Other locales fall back to `en-GB` for now, with a warning.
|
|
133
|
+
|
|
134
|
+
## Lower level
|
|
135
|
+
|
|
136
|
+
`bc.to_svg(type, **options)` returns the static SVG string and `bc.render(type, **options)` returns it with the hover targets the browser uses. Both take the same options as the JavaScript functions of the same names, and accept a dict too:
|
|
137
|
+
|
|
138
|
+
```python
|
|
139
|
+
bc.to_svg("line", {"values": "1,2,3|3,2,1", "series": "A,B", "show-values": ""})
|
|
140
|
+
```
|
|
141
|
+
|
|
142
|
+
## How it stays in step with the JavaScript
|
|
143
|
+
|
|
144
|
+
`scripts/py-fixtures.mjs` in the main repository runs the real JavaScript charts over a wide set of inputs (empty data, single values, negatives, huge and tiny numbers, notes, goals, both themes) and saves the SVG they draw. The Python tests render the same inputs and check the output is identical. CI regenerates the fixtures on every pull request, so a change to one version that isn't made to the other fails the build.
|
|
145
|
+
|
|
146
|
+
## Development
|
|
147
|
+
|
|
148
|
+
```sh
|
|
149
|
+
git clone https://github.com/ShazMoghaddam/bezel-charts.git
|
|
150
|
+
cd bezel-charts/python
|
|
151
|
+
python3 -m venv .venv && source .venv/bin/activate
|
|
152
|
+
pip install -e ".[test]"
|
|
153
|
+
pytest
|
|
154
|
+
```
|
|
155
|
+
|
|
156
|
+
After changing a JavaScript chart, run `npm run fixtures` from the repository root and commit `python/tests/fixtures`.
|
|
157
|
+
|
|
158
|
+
## Licence
|
|
159
|
+
|
|
160
|
+
[MIT](https://github.com/ShazMoghaddam/bezel-charts/blob/main/LICENSE). Designed and built by [Shaz Moghaddam](https://shazmoghaddam.github.io), London.
|
|
@@ -0,0 +1,126 @@
|
|
|
1
|
+
# Bezel Charts for Python
|
|
2
|
+
|
|
3
|
+
**Polished SVG charts straight from a pandas DataFrame.**
|
|
4
|
+
|
|
5
|
+
The Python companion to [Bezel Charts](https://github.com/ShazMoghaddam/bezel-charts). Pass in a DataFrame, a Series, a NumPy array or a plain list and get back a finished chart tile that shows up in Jupyter, saves as an `.svg` for a README, and drops into reports and slides. Zero dependencies.
|
|
6
|
+
|
|
7
|
+

|
|
8
|
+
|
|
9
|
+

|
|
10
|
+
|
|
11
|
+
- **Identical to the web components.** The renderers are a line-by-line port of the JavaScript ones, and the test suite checks they draw the same SVG, byte for byte.
|
|
12
|
+
- **pandas friendly.** Pick columns with `x=` and `y=`. Dates, indexes and column names become labels and legends.
|
|
13
|
+
- **Made for READMEs.** Every chart is a self-contained SVG with no scripts and no fonts to load, so GitHub shows it.
|
|
14
|
+
- **No dependencies.** pandas and NumPy work when you have them, and are never required.
|
|
15
|
+
|
|
16
|
+
## Install
|
|
17
|
+
|
|
18
|
+
```sh
|
|
19
|
+
pip install bezel-charts
|
|
20
|
+
```
|
|
21
|
+
|
|
22
|
+
Python 3.10 or newer.
|
|
23
|
+
|
|
24
|
+
## Quick start
|
|
25
|
+
|
|
26
|
+
```python
|
|
27
|
+
import pandas as pd
|
|
28
|
+
import bezel_charts as bc
|
|
29
|
+
|
|
30
|
+
df = pd.DataFrame({
|
|
31
|
+
"month": pd.date_range("2026-01-01", periods=9, freq="MS"),
|
|
32
|
+
"Revenue": [42, 48, 45, 53, 61, 58, 66, 72, 79],
|
|
33
|
+
"Costs": [30, 31, 35, 34, 36, 41, 40, 43, 44],
|
|
34
|
+
})
|
|
35
|
+
|
|
36
|
+
bc.line(df, x="month", x_format="%b", heading="Revenue vs costs",
|
|
37
|
+
prefix="£", suffix="k", notes={"May": "Launch"}, theme="light")
|
|
38
|
+
```
|
|
39
|
+
|
|
40
|
+
In a notebook the chart appears as the cell's output. Anywhere else:
|
|
41
|
+
|
|
42
|
+
```python
|
|
43
|
+
chart = bc.spark(df["Revenue"], heading="Monthly revenue", prefix="£", suffix="k")
|
|
44
|
+
chart.save("docs/revenue.svg") # write an .svg file
|
|
45
|
+
svg = str(chart) # or use the SVG string directly
|
|
46
|
+
```
|
|
47
|
+
|
|
48
|
+
Then in your README:
|
|
49
|
+
|
|
50
|
+
```md
|
|
51
|
+

|
|
52
|
+
```
|
|
53
|
+
|
|
54
|
+
## Charts in this release
|
|
55
|
+
|
|
56
|
+
| Function | What it draws |
|
|
57
|
+
| --- | --- |
|
|
58
|
+
| `bc.spark(data)` | A sparkline with the latest value and the change since the start. |
|
|
59
|
+
| `bc.line(data)` | A line chart with one or more series, a value axis, labels and a legend. |
|
|
60
|
+
|
|
61
|
+
The other eight (bars and grouped bars, scatter with a trend line, rings, donut, gauge, progress and heatmap) are coming in the next releases. `bc.types` lists what's available.
|
|
62
|
+
|
|
63
|
+
## Your data
|
|
64
|
+
|
|
65
|
+
| You pass | You get |
|
|
66
|
+
| --- | --- |
|
|
67
|
+
| A list, tuple or NumPy array | One series. |
|
|
68
|
+
| A pandas Series | One series, with the index as labels unless it's the default 0, 1, 2. |
|
|
69
|
+
| A DataFrame | `y="col"` or `y=["a", "b"]` picks the series (by default every numeric column), `x="col"` the labels (by default the index). |
|
|
70
|
+
| A dict like `{"Team A": [...], "Team B": [...]}` | One series per key, named in the legend. |
|
|
71
|
+
| A list of lists | One series per inner list. |
|
|
72
|
+
|
|
73
|
+
Dates become `2026-03-01`, or anything you like with `x_format="%b %Y"`. Missing values are drawn as 0, like the browser version, with a warning so they never go unnoticed. Call `.dropna()` or `.fillna()` first if you'd rather handle them yourself.
|
|
74
|
+
|
|
75
|
+
## Options
|
|
76
|
+
|
|
77
|
+
Every option from the [web components](https://github.com/ShazMoghaddam/bezel-charts#options-for-every-chart) works as a keyword argument. Use snake_case: `show-values` becomes `show_values=True`.
|
|
78
|
+
|
|
79
|
+
| Option | Example | What it does |
|
|
80
|
+
| --- | --- | --- |
|
|
81
|
+
| `heading` | `heading="Sales"` | Small title at the top. |
|
|
82
|
+
| `prefix`, `suffix` | `prefix="£"`, `suffix=" kWh"` | Around every number. |
|
|
83
|
+
| `decimals` | `decimals=1` | Fixed decimal places. |
|
|
84
|
+
| `compact` | `compact=True` | 15,500 becomes 15.5k. |
|
|
85
|
+
| `stat` | `stat="average"` | Headline number: `last`, `total`, `average`, `max`, `min` or `none`. |
|
|
86
|
+
| `delta`, `delta_label` | `delta="inverse"` | Change since the start. `inverse` makes a fall the good direction. |
|
|
87
|
+
| `goal`, `goal_label` | `goal=50, goal_label="Target"` | A dashed target line. |
|
|
88
|
+
| `notes` | `notes={"May": "Launch"}` | Notes on points, keyed by label or position. |
|
|
89
|
+
| `show_values` | `show_values=True` | A label on every point. |
|
|
90
|
+
| `straight` | `straight=True` | Straight segments instead of curves. |
|
|
91
|
+
| `zero` | `zero=True` | Start the axis at zero (line). |
|
|
92
|
+
| `labels`, `series` | `labels=["Q1", "Q2"]` | Set labels and series names by hand. |
|
|
93
|
+
| `color` | `color=["#ff6600", "#0066ff"]` | Series colours. |
|
|
94
|
+
| `theme` | `theme="light"` | `dark` (the default) or `light`. |
|
|
95
|
+
| `width`, `height` | `width=560` | Size in pixels. The tile grows to fit its heading and headline. |
|
|
96
|
+
| `frame`, `corners`, `background` | `frame="none"` | Drop the bezel, change the corner radius or the tile colour. |
|
|
97
|
+
|
|
98
|
+
Numbers are formatted for `en-GB` by default (`1.5m`, `2bn`), or `lang="en-US"` for `1.5M`, `2B`. Other locales fall back to `en-GB` for now, with a warning.
|
|
99
|
+
|
|
100
|
+
## Lower level
|
|
101
|
+
|
|
102
|
+
`bc.to_svg(type, **options)` returns the static SVG string and `bc.render(type, **options)` returns it with the hover targets the browser uses. Both take the same options as the JavaScript functions of the same names, and accept a dict too:
|
|
103
|
+
|
|
104
|
+
```python
|
|
105
|
+
bc.to_svg("line", {"values": "1,2,3|3,2,1", "series": "A,B", "show-values": ""})
|
|
106
|
+
```
|
|
107
|
+
|
|
108
|
+
## How it stays in step with the JavaScript
|
|
109
|
+
|
|
110
|
+
`scripts/py-fixtures.mjs` in the main repository runs the real JavaScript charts over a wide set of inputs (empty data, single values, negatives, huge and tiny numbers, notes, goals, both themes) and saves the SVG they draw. The Python tests render the same inputs and check the output is identical. CI regenerates the fixtures on every pull request, so a change to one version that isn't made to the other fails the build.
|
|
111
|
+
|
|
112
|
+
## Development
|
|
113
|
+
|
|
114
|
+
```sh
|
|
115
|
+
git clone https://github.com/ShazMoghaddam/bezel-charts.git
|
|
116
|
+
cd bezel-charts/python
|
|
117
|
+
python3 -m venv .venv && source .venv/bin/activate
|
|
118
|
+
pip install -e ".[test]"
|
|
119
|
+
pytest
|
|
120
|
+
```
|
|
121
|
+
|
|
122
|
+
After changing a JavaScript chart, run `npm run fixtures` from the repository root and commit `python/tests/fixtures`.
|
|
123
|
+
|
|
124
|
+
## Licence
|
|
125
|
+
|
|
126
|
+
[MIT](https://github.com/ShazMoghaddam/bezel-charts/blob/main/LICENSE). Designed and built by [Shaz Moghaddam](https://shazmoghaddam.github.io), London.
|
|
@@ -0,0 +1,54 @@
|
|
|
1
|
+
[build-system]
|
|
2
|
+
requires = ["hatchling>=1.27"]
|
|
3
|
+
build-backend = "hatchling.build"
|
|
4
|
+
|
|
5
|
+
[project]
|
|
6
|
+
name = "bezel-charts"
|
|
7
|
+
dynamic = ["version"]
|
|
8
|
+
description = "Polished SVG charts from pandas DataFrames and Python lists, drawn exactly like the Bezel Charts web components. Zero dependencies."
|
|
9
|
+
readme = "README.md"
|
|
10
|
+
license = "MIT"
|
|
11
|
+
license-files = ["LICENSE"]
|
|
12
|
+
requires-python = ">=3.10"
|
|
13
|
+
authors = [{ name = "Shaz Moghaddam" }]
|
|
14
|
+
keywords = ["charts", "svg", "sparkline", "pandas", "jupyter", "data-visualization", "readme", "line-chart"]
|
|
15
|
+
classifiers = [
|
|
16
|
+
"Development Status :: 4 - Beta",
|
|
17
|
+
"Framework :: Jupyter",
|
|
18
|
+
"Intended Audience :: Developers",
|
|
19
|
+
"Intended Audience :: Science/Research",
|
|
20
|
+
"Operating System :: OS Independent",
|
|
21
|
+
"Programming Language :: Python :: 3",
|
|
22
|
+
"Programming Language :: Python :: 3 :: Only",
|
|
23
|
+
"Programming Language :: Python :: 3.10",
|
|
24
|
+
"Programming Language :: Python :: 3.11",
|
|
25
|
+
"Programming Language :: Python :: 3.12",
|
|
26
|
+
"Programming Language :: Python :: 3.13",
|
|
27
|
+
"Programming Language :: Python :: 3.14",
|
|
28
|
+
"Topic :: Scientific/Engineering :: Visualization",
|
|
29
|
+
"Typing :: Typed",
|
|
30
|
+
]
|
|
31
|
+
dependencies = []
|
|
32
|
+
|
|
33
|
+
[project.optional-dependencies]
|
|
34
|
+
test = ["pytest>=8", "pandas>=2", "numpy>=1.26"]
|
|
35
|
+
|
|
36
|
+
[project.urls]
|
|
37
|
+
Homepage = "https://shazmoghaddam.github.io/bezel-charts/site/"
|
|
38
|
+
Documentation = "https://github.com/ShazMoghaddam/bezel-charts/tree/main/python#readme"
|
|
39
|
+
Repository = "https://github.com/ShazMoghaddam/bezel-charts"
|
|
40
|
+
Issues = "https://github.com/ShazMoghaddam/bezel-charts/issues"
|
|
41
|
+
Changelog = "https://github.com/ShazMoghaddam/bezel-charts/blob/main/python/CHANGELOG.md"
|
|
42
|
+
|
|
43
|
+
[tool.hatch.version]
|
|
44
|
+
path = "src/bezel_charts/__init__.py"
|
|
45
|
+
|
|
46
|
+
[tool.hatch.build.targets.sdist]
|
|
47
|
+
include = ["src", "tests", "README.md", "CHANGELOG.md", "LICENSE"]
|
|
48
|
+
|
|
49
|
+
[tool.hatch.build.targets.wheel]
|
|
50
|
+
packages = ["src/bezel_charts"]
|
|
51
|
+
|
|
52
|
+
[tool.pytest.ini_options]
|
|
53
|
+
testpaths = ["tests"]
|
|
54
|
+
addopts = "-q"
|
|
@@ -0,0 +1,120 @@
|
|
|
1
|
+
"""Bezel Charts for Python.
|
|
2
|
+
|
|
3
|
+
Polished SVG charts from pandas DataFrames, NumPy arrays and plain lists, drawn
|
|
4
|
+
exactly like the Bezel Charts web components. Zero dependencies.
|
|
5
|
+
|
|
6
|
+
import bezel_charts as bc
|
|
7
|
+
|
|
8
|
+
bc.line(df, x="month", y=["sales", "costs"], heading="Sales", prefix="£")
|
|
9
|
+
bc.spark([4, 6, 5, 8, 9], heading="Signups").save("signups.svg")
|
|
10
|
+
|
|
11
|
+
Created by Shaz Moghaddam, London. https://shazmoghaddam.github.io
|
|
12
|
+
"""
|
|
13
|
+
|
|
14
|
+
from __future__ import annotations
|
|
15
|
+
|
|
16
|
+
import re
|
|
17
|
+
from os import PathLike
|
|
18
|
+
from pathlib import Path
|
|
19
|
+
from typing import Any
|
|
20
|
+
|
|
21
|
+
from . import _data
|
|
22
|
+
from ._render import ALL_TYPES
|
|
23
|
+
from ._render import render as _render
|
|
24
|
+
from ._render import to_svg as _to_svg
|
|
25
|
+
from ._tile import THEMES as themes
|
|
26
|
+
from .charts import TYPES
|
|
27
|
+
|
|
28
|
+
__version__ = "0.1.0"
|
|
29
|
+
__all__ = ["Chart", "line", "render", "spark", "themes", "to_svg", "types", "__version__"]
|
|
30
|
+
|
|
31
|
+
#: Chart types available in this release. The rest of the ten follow in later releases.
|
|
32
|
+
types = list(TYPES)
|
|
33
|
+
|
|
34
|
+
|
|
35
|
+
def render(type: str, options: dict | None = None, **kwargs: Any) -> str:
|
|
36
|
+
"""Renders a chart to an SVG string with hover targets, the same as render() in JavaScript.
|
|
37
|
+
|
|
38
|
+
Options use the HTML attribute names in snake_case, kebab-case or camelCase:
|
|
39
|
+
``show_values``, ``show-values`` and ``showValues`` all work.
|
|
40
|
+
"""
|
|
41
|
+
return _render(type, {**(options or {}), **kwargs})
|
|
42
|
+
|
|
43
|
+
|
|
44
|
+
def to_svg(type: str, options: dict | None = None, **kwargs: Any) -> str:
|
|
45
|
+
"""Renders a clean static SVG, the same as toSVG() in JavaScript."""
|
|
46
|
+
return _to_svg(type, {**(options or {}), **kwargs})
|
|
47
|
+
|
|
48
|
+
|
|
49
|
+
class Chart:
|
|
50
|
+
"""A rendered chart. Shows itself in Jupyter, and converts to an SVG string with str()."""
|
|
51
|
+
|
|
52
|
+
def __init__(self, type: str, options: dict):
|
|
53
|
+
self.type = type
|
|
54
|
+
self.options = dict(options)
|
|
55
|
+
self.svg = _to_svg(type, self.options)
|
|
56
|
+
m = re.search(r'width="(\d+)" height="(\d+)"', self.svg)
|
|
57
|
+
self.width, self.height = (int(m.group(1)), int(m.group(2))) if m else (0, 0)
|
|
58
|
+
|
|
59
|
+
def __str__(self) -> str:
|
|
60
|
+
return self.svg
|
|
61
|
+
|
|
62
|
+
def __repr__(self) -> str:
|
|
63
|
+
return f"<bezel_charts.Chart {self.type} {self.width}x{self.height}>"
|
|
64
|
+
|
|
65
|
+
def _repr_svg_(self) -> str:
|
|
66
|
+
return self.svg
|
|
67
|
+
|
|
68
|
+
def save(self, path: str | PathLike) -> Path:
|
|
69
|
+
"""Writes the chart as an .svg file and returns its path."""
|
|
70
|
+
p = Path(path)
|
|
71
|
+
if p.suffix.lower() != ".svg":
|
|
72
|
+
p = p.with_suffix(".svg") if p.suffix else p.with_name(p.name + ".svg")
|
|
73
|
+
p.write_text(self.svg, encoding="utf-8")
|
|
74
|
+
return p
|
|
75
|
+
|
|
76
|
+
|
|
77
|
+
def _options(options: dict, values, names, lbls) -> dict:
|
|
78
|
+
out = dict(options)
|
|
79
|
+
if values is not None:
|
|
80
|
+
out["values"] = values
|
|
81
|
+
if names and "series" not in out:
|
|
82
|
+
out["series"] = names
|
|
83
|
+
if lbls and "labels" not in out:
|
|
84
|
+
out["labels"] = lbls
|
|
85
|
+
if "notes" in out:
|
|
86
|
+
out["notes"] = _data.notes(out["notes"])
|
|
87
|
+
return out
|
|
88
|
+
|
|
89
|
+
|
|
90
|
+
def spark(data: Any = None, *, x: Any = None, y: Any = None, x_format: str | None = None, **options: Any) -> Chart:
|
|
91
|
+
"""A sparkline: one series, its latest value and the change since the start.
|
|
92
|
+
|
|
93
|
+
``data`` can be a list, a NumPy array, a pandas Series, or a DataFrame with ``y=`` naming the column.
|
|
94
|
+
Labels come from ``x=`` (a column), a non-default index, or ``labels=``. They show up in notes.
|
|
95
|
+
"""
|
|
96
|
+
if data is None:
|
|
97
|
+
return Chart("spark", _options(options, None, None, None))
|
|
98
|
+
values, _, lbls = _data.prepare(data, x, y, x_format, single=True)
|
|
99
|
+
return Chart("spark", _options(options, values[0], None, lbls))
|
|
100
|
+
|
|
101
|
+
|
|
102
|
+
def line(data: Any = None, *, x: Any = None, y: Any = None, x_format: str | None = None, **options: Any) -> Chart:
|
|
103
|
+
"""A line chart with one or more series, a value axis and labels along the bottom.
|
|
104
|
+
|
|
105
|
+
``data`` can be a DataFrame (``x=`` for labels, ``y=`` for one column or a list of them; by default
|
|
106
|
+
every numeric column), a Series, a dict of name to values, a list of lists, or a single list.
|
|
107
|
+
Dates are written as YYYY-MM-DD unless you pass ``x_format`` (for example ``"%b %Y"``).
|
|
108
|
+
"""
|
|
109
|
+
if data is None:
|
|
110
|
+
return Chart("line", _options(options, None, None, None))
|
|
111
|
+
values, names, lbls = _data.prepare(data, x, y, x_format)
|
|
112
|
+
return Chart("line", _options(options, values, names, lbls))
|
|
113
|
+
|
|
114
|
+
|
|
115
|
+
def __getattr__(name: str):
|
|
116
|
+
if name in ALL_TYPES:
|
|
117
|
+
raise AttributeError(
|
|
118
|
+
f"bezel_charts.{name}() is coming in a later release. Available now: {', '.join(types)}."
|
|
119
|
+
)
|
|
120
|
+
raise AttributeError(f"module 'bezel_charts' has no attribute {name!r}")
|
|
@@ -0,0 +1,163 @@
|
|
|
1
|
+
"""Turns pandas, NumPy and plain Python data into the options the renderers read.
|
|
2
|
+
|
|
3
|
+
pandas and NumPy are never imported. Objects are recognised by what they can do
|
|
4
|
+
(a .columns attribute, a .tolist() method), so the package stays dependency free.
|
|
5
|
+
"""
|
|
6
|
+
|
|
7
|
+
from __future__ import annotations
|
|
8
|
+
|
|
9
|
+
import math
|
|
10
|
+
import warnings
|
|
11
|
+
from collections.abc import Mapping
|
|
12
|
+
|
|
13
|
+
from ._js import is_num, js_str, to_string
|
|
14
|
+
|
|
15
|
+
|
|
16
|
+
def _is_frame(obj) -> bool:
|
|
17
|
+
return hasattr(obj, "columns") and hasattr(obj, "dtypes") and hasattr(obj, "__getitem__")
|
|
18
|
+
|
|
19
|
+
|
|
20
|
+
def _is_series(obj) -> bool:
|
|
21
|
+
return hasattr(obj, "index") and hasattr(obj, "tolist") and not _is_frame(obj) and hasattr(obj, "name")
|
|
22
|
+
|
|
23
|
+
|
|
24
|
+
def _to_list(obj) -> list:
|
|
25
|
+
if hasattr(obj, "tolist") and not isinstance(obj, str):
|
|
26
|
+
out = obj.tolist()
|
|
27
|
+
return out if isinstance(out, list) else [out]
|
|
28
|
+
if isinstance(obj, (str, bytes)):
|
|
29
|
+
raise TypeError("bezel_charts: pass numbers as a list, Series or array, not a string.")
|
|
30
|
+
return list(obj)
|
|
31
|
+
|
|
32
|
+
|
|
33
|
+
def _is_default_index(index) -> bool:
|
|
34
|
+
return type(index).__name__ == "RangeIndex"
|
|
35
|
+
|
|
36
|
+
|
|
37
|
+
def _number(v) -> float:
|
|
38
|
+
if hasattr(v, "item") and not isinstance(v, (list, tuple)):
|
|
39
|
+
try:
|
|
40
|
+
v = v.item()
|
|
41
|
+
except (TypeError, ValueError):
|
|
42
|
+
pass
|
|
43
|
+
if v is None or isinstance(v, bool):
|
|
44
|
+
return float("nan") if v is None else float(v)
|
|
45
|
+
try:
|
|
46
|
+
return float(v)
|
|
47
|
+
except (TypeError, ValueError):
|
|
48
|
+
return float("nan")
|
|
49
|
+
|
|
50
|
+
|
|
51
|
+
def numbers(seq, what: str = "values") -> list:
|
|
52
|
+
"""Floats, with missing values drawn as 0 like the browser version, plus a warning."""
|
|
53
|
+
out, missing = [], 0
|
|
54
|
+
for v in _to_list(seq):
|
|
55
|
+
n = _number(v)
|
|
56
|
+
if not math.isfinite(n):
|
|
57
|
+
missing += 1
|
|
58
|
+
n = 0.0
|
|
59
|
+
out.append(n)
|
|
60
|
+
if missing:
|
|
61
|
+
warnings.warn(
|
|
62
|
+
f"bezel_charts: {missing} missing or non-numeric {what} drawn as 0. "
|
|
63
|
+
"Use .dropna() or .fillna() first if that is not what you want.",
|
|
64
|
+
stacklevel=4,
|
|
65
|
+
)
|
|
66
|
+
return out
|
|
67
|
+
|
|
68
|
+
|
|
69
|
+
def label(v, x_format: str | None = None) -> str:
|
|
70
|
+
"""A tidy text label: dates without midnight times, 2026.0 as 2026, missing as blank."""
|
|
71
|
+
if hasattr(v, "item") and not hasattr(v, "strftime"):
|
|
72
|
+
try:
|
|
73
|
+
v = v.item()
|
|
74
|
+
except (TypeError, ValueError):
|
|
75
|
+
pass
|
|
76
|
+
if v is None or (isinstance(v, float) and v != v):
|
|
77
|
+
return ""
|
|
78
|
+
if hasattr(v, "strftime"):
|
|
79
|
+
if type(v).__name__ == "NaTType":
|
|
80
|
+
return ""
|
|
81
|
+
if x_format:
|
|
82
|
+
return v.strftime(x_format)
|
|
83
|
+
if any(getattr(v, part, 0) for part in ("hour", "minute", "second")):
|
|
84
|
+
return v.strftime("%Y-%m-%d %H:%M")
|
|
85
|
+
return v.strftime("%Y-%m-%d") if hasattr(v, "day") else str(v)
|
|
86
|
+
if is_num(v):
|
|
87
|
+
return js_str(v)
|
|
88
|
+
return to_string(v)
|
|
89
|
+
|
|
90
|
+
|
|
91
|
+
def labels(seq, x_format: str | None = None) -> list:
|
|
92
|
+
return [label(v, x_format) for v in _to_list(seq)]
|
|
93
|
+
|
|
94
|
+
|
|
95
|
+
def notes(value):
|
|
96
|
+
"""Accepts {"Mar": "Launch", 4: "Peak"} or [(key, text), ...] as well as the "key:text;..." string."""
|
|
97
|
+
if value is None or isinstance(value, str):
|
|
98
|
+
return value
|
|
99
|
+
items = value.items() if isinstance(value, Mapping) else value
|
|
100
|
+
parts = []
|
|
101
|
+
for key, text in items:
|
|
102
|
+
key_s, text_s = label(key), to_string(text)
|
|
103
|
+
if ":" in key_s or ";" in key_s or ";" in text_s:
|
|
104
|
+
raise ValueError(
|
|
105
|
+
f"bezel_charts: note {key_s!r}: {text_s!r} cannot contain ';', and its key cannot contain ':'."
|
|
106
|
+
)
|
|
107
|
+
parts.append(f"{key_s}:{text_s}")
|
|
108
|
+
return ";".join(parts)
|
|
109
|
+
|
|
110
|
+
|
|
111
|
+
def _numeric_columns(df, exclude) -> list:
|
|
112
|
+
cols = []
|
|
113
|
+
for col, dtype in zip(df.columns, df.dtypes):
|
|
114
|
+
if col != exclude and getattr(dtype, "kind", "") in "iuf":
|
|
115
|
+
cols.append(col)
|
|
116
|
+
return cols
|
|
117
|
+
|
|
118
|
+
|
|
119
|
+
def prepare(data, x=None, y=None, x_format=None, single=False):
|
|
120
|
+
"""Returns (series values, series names or None, labels or None) for any supported input."""
|
|
121
|
+
if _is_frame(data):
|
|
122
|
+
if x is not None and x not in data.columns:
|
|
123
|
+
raise KeyError(f"bezel_charts: column {x!r} not found. Columns: {list(data.columns)}")
|
|
124
|
+
if y is None:
|
|
125
|
+
ys = _numeric_columns(data, x)
|
|
126
|
+
if not ys:
|
|
127
|
+
raise ValueError("bezel_charts: no numeric columns to plot. Pick one with y='column'.")
|
|
128
|
+
else:
|
|
129
|
+
ys = [y] if isinstance(y, (str, int)) or not hasattr(y, "__iter__") else list(y)
|
|
130
|
+
for col in ys:
|
|
131
|
+
if col not in data.columns:
|
|
132
|
+
raise KeyError(f"bezel_charts: column {col!r} not found. Columns: {list(data.columns)}")
|
|
133
|
+
if single and len(ys) > 1:
|
|
134
|
+
raise ValueError(f"bezel_charts: a sparkline draws one column. Choose one with y=, from {ys}.")
|
|
135
|
+
values = [numbers(data[col], f"values in {col!r}") for col in ys]
|
|
136
|
+
if x is not None:
|
|
137
|
+
lbls = labels(data[x], x_format)
|
|
138
|
+
elif not _is_default_index(data.index):
|
|
139
|
+
lbls = labels(data.index, x_format)
|
|
140
|
+
else:
|
|
141
|
+
lbls = None
|
|
142
|
+
names = [label(c) for c in ys] if len(ys) > 1 else None
|
|
143
|
+
return values, names, lbls
|
|
144
|
+
|
|
145
|
+
if x is not None or y is not None:
|
|
146
|
+
raise TypeError("bezel_charts: x= and y= pick DataFrame columns. For lists, pass labels= instead.")
|
|
147
|
+
|
|
148
|
+
if _is_series(data):
|
|
149
|
+
lbls = None if _is_default_index(data.index) else labels(data.index, x_format)
|
|
150
|
+
return [numbers(data)], None, lbls
|
|
151
|
+
|
|
152
|
+
if isinstance(data, Mapping):
|
|
153
|
+
if single and len(data) > 1:
|
|
154
|
+
raise ValueError("bezel_charts: a sparkline draws one series. Pass a single list.")
|
|
155
|
+
names = [label(k) for k in data]
|
|
156
|
+
return [numbers(v, f"values in {k!r}") for k, v in data.items()], names, None
|
|
157
|
+
|
|
158
|
+
rows = _to_list(data)
|
|
159
|
+
if rows and all(hasattr(r, "__iter__") and not isinstance(r, str) for r in rows):
|
|
160
|
+
if single and len(rows) > 1:
|
|
161
|
+
raise ValueError("bezel_charts: a sparkline draws one series. Pass a single list.")
|
|
162
|
+
return [numbers(r) for r in rows], None, None
|
|
163
|
+
return [numbers(rows)], None, None
|