better-git-of-theseus 0.4.0__tar.gz → 0.4.5__tar.gz
This diff represents the content of publicly available package versions that have been released to one of the supported registries. The information contained in this diff is provided for informational purposes only and reflects changes between package versions as they appear in their respective public registries.
- better_git_of_theseus-0.4.5/PKG-INFO +96 -0
- better_git_of_theseus-0.4.5/README.md +69 -0
- better_git_of_theseus-0.4.5/better_git_of_theseus.egg-info/PKG-INFO +96 -0
- better_git_of_theseus-0.4.5/better_git_of_theseus.egg-info/entry_points.txt +2 -0
- {better_git_of_theseus-0.4.0 → better_git_of_theseus-0.4.5}/git_of_theseus/app.py +91 -11
- {better_git_of_theseus-0.4.0 → better_git_of_theseus-0.4.5}/git_of_theseus/cmd.py +2 -3
- {better_git_of_theseus-0.4.0 → better_git_of_theseus-0.4.5}/git_of_theseus/plotly_plots.py +33 -0
- {better_git_of_theseus-0.4.0 → better_git_of_theseus-0.4.5}/setup.py +2 -6
- better_git_of_theseus-0.4.0/PKG-INFO +0 -122
- better_git_of_theseus-0.4.0/README.md +0 -95
- better_git_of_theseus-0.4.0/better_git_of_theseus.egg-info/PKG-INFO +0 -122
- better_git_of_theseus-0.4.0/better_git_of_theseus.egg-info/entry_points.txt +0 -6
- {better_git_of_theseus-0.4.0 → better_git_of_theseus-0.4.5}/LICENSE +0 -0
- {better_git_of_theseus-0.4.0 → better_git_of_theseus-0.4.5}/better_git_of_theseus.egg-info/SOURCES.txt +0 -0
- {better_git_of_theseus-0.4.0 → better_git_of_theseus-0.4.5}/better_git_of_theseus.egg-info/dependency_links.txt +0 -0
- {better_git_of_theseus-0.4.0 → better_git_of_theseus-0.4.5}/better_git_of_theseus.egg-info/requires.txt +0 -0
- {better_git_of_theseus-0.4.0 → better_git_of_theseus-0.4.5}/better_git_of_theseus.egg-info/top_level.txt +0 -0
- {better_git_of_theseus-0.4.0 → better_git_of_theseus-0.4.5}/git_of_theseus/__init__.py +0 -0
- {better_git_of_theseus-0.4.0 → better_git_of_theseus-0.4.5}/git_of_theseus/analyze.py +0 -0
- {better_git_of_theseus-0.4.0 → better_git_of_theseus-0.4.5}/git_of_theseus/line_plot.py +0 -0
- {better_git_of_theseus-0.4.0 → better_git_of_theseus-0.4.5}/git_of_theseus/stack_plot.py +0 -0
- {better_git_of_theseus-0.4.0 → better_git_of_theseus-0.4.5}/git_of_theseus/survival_plot.py +0 -0
- {better_git_of_theseus-0.4.0 → better_git_of_theseus-0.4.5}/git_of_theseus/utils.py +0 -0
- {better_git_of_theseus-0.4.0 → better_git_of_theseus-0.4.5}/setup.cfg +0 -0
|
@@ -0,0 +1,96 @@
|
|
|
1
|
+
Metadata-Version: 2.4
|
|
2
|
+
Name: better-git-of-theseus
|
|
3
|
+
Version: 0.4.5
|
|
4
|
+
Summary: Plot stats on Git repositories with interactive Plotly charts
|
|
5
|
+
Home-page: https://github.com/onewesong/better-git-of-theseus
|
|
6
|
+
Author: Erik Bernhardsson
|
|
7
|
+
Author-email: mail@erikbern.com
|
|
8
|
+
Description-Content-Type: text/markdown
|
|
9
|
+
License-File: LICENSE
|
|
10
|
+
Requires-Dist: gitpython
|
|
11
|
+
Requires-Dist: numpy
|
|
12
|
+
Requires-Dist: tqdm
|
|
13
|
+
Requires-Dist: wcmatch
|
|
14
|
+
Requires-Dist: pygments
|
|
15
|
+
Requires-Dist: plotly
|
|
16
|
+
Requires-Dist: streamlit
|
|
17
|
+
Requires-Dist: python-dateutil
|
|
18
|
+
Requires-Dist: scipy
|
|
19
|
+
Dynamic: author
|
|
20
|
+
Dynamic: author-email
|
|
21
|
+
Dynamic: description
|
|
22
|
+
Dynamic: description-content-type
|
|
23
|
+
Dynamic: home-page
|
|
24
|
+
Dynamic: license-file
|
|
25
|
+
Dynamic: requires-dist
|
|
26
|
+
Dynamic: summary
|
|
27
|
+
|
|
28
|
+
<div align="center">
|
|
29
|
+
|
|
30
|
+
# Better Git of Theseus
|
|
31
|
+
|
|
32
|
+
[](https://pypi.python.org/pypi/better-git-of-theseus)
|
|
33
|
+
[](https://pypi.org/project/better-git-of-theseus/)
|
|
34
|
+
[](https://pypi.org/project/better-git-of-theseus/)
|
|
35
|
+
[](https://github.com/onewesong/better-git-of-theseus/blob/master/LICENSE)
|
|
36
|
+
[](https://deepwiki.com/onewesong/better-git-of-theseus)
|
|
37
|
+
|
|
38
|
+
[中文版](README_zh.md)
|
|
39
|
+
|
|
40
|
+
</div>
|
|
41
|
+
|
|
42
|
+
**Better Git of Theseus** is a modern refactor of the original [git-of-theseus](https://github.com/erikbern/git-of-theseus). It provides a fully interactive Web Dashboard powered by **Streamlit** and **Plotly**, making it easier than ever to visualize how your code evolves over time.
|
|
43
|
+
|
|
44
|
+
 *(Note: Charts are now fully interactive!)*
|
|
45
|
+
|
|
46
|
+
## Key Enhancements
|
|
47
|
+
|
|
48
|
+
- 🚀 **One-Click Visualization**: New `better-git-of-theseus` command automatically scans your project and launches a Web UI.
|
|
49
|
+
- 📊 **Interactive Charts**: Replaced static Matplotlib plots with Plotly. Support for zooming, panning, and detailed data hovers.
|
|
50
|
+
- 🧠 **In-Memory Processing**: Data flows directly in memory. No more mandatory intermediate `.json` files cluttering your repo.
|
|
51
|
+
- ⚡ **Smart Caching**: Leverages Streamlit's caching to make repeat analysis of large repos nearly instantaneous.
|
|
52
|
+
- 🎨 **Modern UI**: Adjust parameters (Cohort format, ignore rules, normalization, etc.) in real-time via the sidebar.
|
|
53
|
+
|
|
54
|
+
## Installation
|
|
55
|
+
|
|
56
|
+
Install via pip:
|
|
57
|
+
|
|
58
|
+
```bash
|
|
59
|
+
pip install better-git-of-theseus
|
|
60
|
+
```
|
|
61
|
+
|
|
62
|
+
## Quick Start
|
|
63
|
+
|
|
64
|
+
Run the following in any Git repository:
|
|
65
|
+
|
|
66
|
+
```bash
|
|
67
|
+
better-git-of-theseus
|
|
68
|
+
```
|
|
69
|
+
|
|
70
|
+
It will automatically open your browser to the interactive dashboard.
|
|
71
|
+
|
|
72
|
+
## Feature Highlights
|
|
73
|
+
|
|
74
|
+
### Cohort Formatting
|
|
75
|
+
|
|
76
|
+
Customize how commits are grouped by year, month, or week (based on Python strftime):
|
|
77
|
+
- `%Y`: Group by **Year** (Default)
|
|
78
|
+
- `%Y-%m`: Group by **Month**
|
|
79
|
+
- `%Y-W%W`: Group by **Week**
|
|
80
|
+
|
|
81
|
+
### Real-time Parameters
|
|
82
|
+
|
|
83
|
+
Adjust parameters like "Max Series", "Normalization", and "Exponential Fit" directly in the Web UI without re-running any commands.
|
|
84
|
+
|
|
85
|
+
## FAQ
|
|
86
|
+
|
|
87
|
+
- **Duplicate Authors?** Configure a [.mailmap](https://git-scm.com/docs/gitmailmap) file in your repo root to merge identities.
|
|
88
|
+
- **Performance?** First-time analysis of very large repos (like the Linux Kernel) may take time, but subsequent views are extremely fast due to caching.
|
|
89
|
+
|
|
90
|
+
## Credits
|
|
91
|
+
|
|
92
|
+
Special thanks to [Erik Bernhardsson](https://github.com/erikbern) for creating the original `git-of-theseus`.
|
|
93
|
+
|
|
94
|
+
## License
|
|
95
|
+
|
|
96
|
+
MIT
|
|
@@ -0,0 +1,69 @@
|
|
|
1
|
+
<div align="center">
|
|
2
|
+
|
|
3
|
+
# Better Git of Theseus
|
|
4
|
+
|
|
5
|
+
[](https://pypi.python.org/pypi/better-git-of-theseus)
|
|
6
|
+
[](https://pypi.org/project/better-git-of-theseus/)
|
|
7
|
+
[](https://pypi.org/project/better-git-of-theseus/)
|
|
8
|
+
[](https://github.com/onewesong/better-git-of-theseus/blob/master/LICENSE)
|
|
9
|
+
[](https://deepwiki.com/onewesong/better-git-of-theseus)
|
|
10
|
+
|
|
11
|
+
[中文版](README_zh.md)
|
|
12
|
+
|
|
13
|
+
</div>
|
|
14
|
+
|
|
15
|
+
**Better Git of Theseus** is a modern refactor of the original [git-of-theseus](https://github.com/erikbern/git-of-theseus). It provides a fully interactive Web Dashboard powered by **Streamlit** and **Plotly**, making it easier than ever to visualize how your code evolves over time.
|
|
16
|
+
|
|
17
|
+
 *(Note: Charts are now fully interactive!)*
|
|
18
|
+
|
|
19
|
+
## Key Enhancements
|
|
20
|
+
|
|
21
|
+
- 🚀 **One-Click Visualization**: New `better-git-of-theseus` command automatically scans your project and launches a Web UI.
|
|
22
|
+
- 📊 **Interactive Charts**: Replaced static Matplotlib plots with Plotly. Support for zooming, panning, and detailed data hovers.
|
|
23
|
+
- 🧠 **In-Memory Processing**: Data flows directly in memory. No more mandatory intermediate `.json` files cluttering your repo.
|
|
24
|
+
- ⚡ **Smart Caching**: Leverages Streamlit's caching to make repeat analysis of large repos nearly instantaneous.
|
|
25
|
+
- 🎨 **Modern UI**: Adjust parameters (Cohort format, ignore rules, normalization, etc.) in real-time via the sidebar.
|
|
26
|
+
|
|
27
|
+
## Installation
|
|
28
|
+
|
|
29
|
+
Install via pip:
|
|
30
|
+
|
|
31
|
+
```bash
|
|
32
|
+
pip install better-git-of-theseus
|
|
33
|
+
```
|
|
34
|
+
|
|
35
|
+
## Quick Start
|
|
36
|
+
|
|
37
|
+
Run the following in any Git repository:
|
|
38
|
+
|
|
39
|
+
```bash
|
|
40
|
+
better-git-of-theseus
|
|
41
|
+
```
|
|
42
|
+
|
|
43
|
+
It will automatically open your browser to the interactive dashboard.
|
|
44
|
+
|
|
45
|
+
## Feature Highlights
|
|
46
|
+
|
|
47
|
+
### Cohort Formatting
|
|
48
|
+
|
|
49
|
+
Customize how commits are grouped by year, month, or week (based on Python strftime):
|
|
50
|
+
- `%Y`: Group by **Year** (Default)
|
|
51
|
+
- `%Y-%m`: Group by **Month**
|
|
52
|
+
- `%Y-W%W`: Group by **Week**
|
|
53
|
+
|
|
54
|
+
### Real-time Parameters
|
|
55
|
+
|
|
56
|
+
Adjust parameters like "Max Series", "Normalization", and "Exponential Fit" directly in the Web UI without re-running any commands.
|
|
57
|
+
|
|
58
|
+
## FAQ
|
|
59
|
+
|
|
60
|
+
- **Duplicate Authors?** Configure a [.mailmap](https://git-scm.com/docs/gitmailmap) file in your repo root to merge identities.
|
|
61
|
+
- **Performance?** First-time analysis of very large repos (like the Linux Kernel) may take time, but subsequent views are extremely fast due to caching.
|
|
62
|
+
|
|
63
|
+
## Credits
|
|
64
|
+
|
|
65
|
+
Special thanks to [Erik Bernhardsson](https://github.com/erikbern) for creating the original `git-of-theseus`.
|
|
66
|
+
|
|
67
|
+
## License
|
|
68
|
+
|
|
69
|
+
MIT
|
|
@@ -0,0 +1,96 @@
|
|
|
1
|
+
Metadata-Version: 2.4
|
|
2
|
+
Name: better-git-of-theseus
|
|
3
|
+
Version: 0.4.5
|
|
4
|
+
Summary: Plot stats on Git repositories with interactive Plotly charts
|
|
5
|
+
Home-page: https://github.com/onewesong/better-git-of-theseus
|
|
6
|
+
Author: Erik Bernhardsson
|
|
7
|
+
Author-email: mail@erikbern.com
|
|
8
|
+
Description-Content-Type: text/markdown
|
|
9
|
+
License-File: LICENSE
|
|
10
|
+
Requires-Dist: gitpython
|
|
11
|
+
Requires-Dist: numpy
|
|
12
|
+
Requires-Dist: tqdm
|
|
13
|
+
Requires-Dist: wcmatch
|
|
14
|
+
Requires-Dist: pygments
|
|
15
|
+
Requires-Dist: plotly
|
|
16
|
+
Requires-Dist: streamlit
|
|
17
|
+
Requires-Dist: python-dateutil
|
|
18
|
+
Requires-Dist: scipy
|
|
19
|
+
Dynamic: author
|
|
20
|
+
Dynamic: author-email
|
|
21
|
+
Dynamic: description
|
|
22
|
+
Dynamic: description-content-type
|
|
23
|
+
Dynamic: home-page
|
|
24
|
+
Dynamic: license-file
|
|
25
|
+
Dynamic: requires-dist
|
|
26
|
+
Dynamic: summary
|
|
27
|
+
|
|
28
|
+
<div align="center">
|
|
29
|
+
|
|
30
|
+
# Better Git of Theseus
|
|
31
|
+
|
|
32
|
+
[](https://pypi.python.org/pypi/better-git-of-theseus)
|
|
33
|
+
[](https://pypi.org/project/better-git-of-theseus/)
|
|
34
|
+
[](https://pypi.org/project/better-git-of-theseus/)
|
|
35
|
+
[](https://github.com/onewesong/better-git-of-theseus/blob/master/LICENSE)
|
|
36
|
+
[](https://deepwiki.com/onewesong/better-git-of-theseus)
|
|
37
|
+
|
|
38
|
+
[中文版](README_zh.md)
|
|
39
|
+
|
|
40
|
+
</div>
|
|
41
|
+
|
|
42
|
+
**Better Git of Theseus** is a modern refactor of the original [git-of-theseus](https://github.com/erikbern/git-of-theseus). It provides a fully interactive Web Dashboard powered by **Streamlit** and **Plotly**, making it easier than ever to visualize how your code evolves over time.
|
|
43
|
+
|
|
44
|
+
 *(Note: Charts are now fully interactive!)*
|
|
45
|
+
|
|
46
|
+
## Key Enhancements
|
|
47
|
+
|
|
48
|
+
- 🚀 **One-Click Visualization**: New `better-git-of-theseus` command automatically scans your project and launches a Web UI.
|
|
49
|
+
- 📊 **Interactive Charts**: Replaced static Matplotlib plots with Plotly. Support for zooming, panning, and detailed data hovers.
|
|
50
|
+
- 🧠 **In-Memory Processing**: Data flows directly in memory. No more mandatory intermediate `.json` files cluttering your repo.
|
|
51
|
+
- ⚡ **Smart Caching**: Leverages Streamlit's caching to make repeat analysis of large repos nearly instantaneous.
|
|
52
|
+
- 🎨 **Modern UI**: Adjust parameters (Cohort format, ignore rules, normalization, etc.) in real-time via the sidebar.
|
|
53
|
+
|
|
54
|
+
## Installation
|
|
55
|
+
|
|
56
|
+
Install via pip:
|
|
57
|
+
|
|
58
|
+
```bash
|
|
59
|
+
pip install better-git-of-theseus
|
|
60
|
+
```
|
|
61
|
+
|
|
62
|
+
## Quick Start
|
|
63
|
+
|
|
64
|
+
Run the following in any Git repository:
|
|
65
|
+
|
|
66
|
+
```bash
|
|
67
|
+
better-git-of-theseus
|
|
68
|
+
```
|
|
69
|
+
|
|
70
|
+
It will automatically open your browser to the interactive dashboard.
|
|
71
|
+
|
|
72
|
+
## Feature Highlights
|
|
73
|
+
|
|
74
|
+
### Cohort Formatting
|
|
75
|
+
|
|
76
|
+
Customize how commits are grouped by year, month, or week (based on Python strftime):
|
|
77
|
+
- `%Y`: Group by **Year** (Default)
|
|
78
|
+
- `%Y-%m`: Group by **Month**
|
|
79
|
+
- `%Y-W%W`: Group by **Week**
|
|
80
|
+
|
|
81
|
+
### Real-time Parameters
|
|
82
|
+
|
|
83
|
+
Adjust parameters like "Max Series", "Normalization", and "Exponential Fit" directly in the Web UI without re-running any commands.
|
|
84
|
+
|
|
85
|
+
## FAQ
|
|
86
|
+
|
|
87
|
+
- **Duplicate Authors?** Configure a [.mailmap](https://git-scm.com/docs/gitmailmap) file in your repo root to merge identities.
|
|
88
|
+
- **Performance?** First-time analysis of very large repos (like the Linux Kernel) may take time, but subsequent views are extremely fast due to caching.
|
|
89
|
+
|
|
90
|
+
## Credits
|
|
91
|
+
|
|
92
|
+
Special thanks to [Erik Bernhardsson](https://github.com/erikbern) for creating the original `git-of-theseus`.
|
|
93
|
+
|
|
94
|
+
## License
|
|
95
|
+
|
|
96
|
+
MIT
|
|
@@ -4,13 +4,26 @@ import tempfile
|
|
|
4
4
|
import shutil
|
|
5
5
|
try:
|
|
6
6
|
from git_of_theseus.analyze import analyze
|
|
7
|
-
from git_of_theseus.plotly_plots import plotly_stack_plot, plotly_line_plot, plotly_survival_plot
|
|
7
|
+
from git_of_theseus.plotly_plots import plotly_stack_plot, plotly_line_plot, plotly_survival_plot, plotly_bar_plot
|
|
8
8
|
except ImportError:
|
|
9
9
|
from analyze import analyze
|
|
10
|
-
from plotly_plots import plotly_stack_plot, plotly_line_plot, plotly_survival_plot
|
|
10
|
+
from plotly_plots import plotly_stack_plot, plotly_line_plot, plotly_survival_plot, plotly_bar_plot
|
|
11
11
|
|
|
12
12
|
st.set_page_config(page_title="Git of Theseus Dash", layout="wide")
|
|
13
13
|
|
|
14
|
+
# GitHub Link in Sidebar
|
|
15
|
+
st.sidebar.markdown(
|
|
16
|
+
"""
|
|
17
|
+
<div style="display: flex; align-items: center; margin-bottom: 20px;">
|
|
18
|
+
<img src="https://github.githubassets.com/images/modules/logos_page/GitHub-Mark.png" width="30" style="margin-right: 10px;">
|
|
19
|
+
<a href="https://github.com/onewesong/better-git-of-theseus" target="_blank" style="text-decoration: none; color: inherit; font-weight: bold;">
|
|
20
|
+
better-git-of-theseus
|
|
21
|
+
</a>
|
|
22
|
+
</div>
|
|
23
|
+
""",
|
|
24
|
+
unsafe_allow_html=True
|
|
25
|
+
)
|
|
26
|
+
|
|
14
27
|
st.title("📊 Git of Theseus - Repository Analysis")
|
|
15
28
|
|
|
16
29
|
import sys
|
|
@@ -18,12 +31,49 @@ import sys
|
|
|
18
31
|
# Sidebar Configuration
|
|
19
32
|
st.sidebar.header("Configuration")
|
|
20
33
|
|
|
34
|
+
with st.sidebar.expander("📖 How to use", expanded=False):
|
|
35
|
+
st.markdown("""
|
|
36
|
+
**Better Git of Theseus** is a tool to analyze the evolution of Git repositories.
|
|
37
|
+
|
|
38
|
+
### Plots Explained:
|
|
39
|
+
- **Stack Plot**: Shows code growth over time, broken down by cohort (when code was added).
|
|
40
|
+
- **Line Plot**: Shows trends across different dimensions (Author, Extension, etc.).
|
|
41
|
+
- **Distribution**: Shows the **current** distribution (Who contributed most, which file types are dominant).
|
|
42
|
+
- **Survival Plot**: Estimates how long a line of code typically lasts before being modified or deleted.
|
|
43
|
+
|
|
44
|
+
### Tips:
|
|
45
|
+
- **Cohort Format**: `%Y` (Yearly) and `%Y-%m` (Monthly) are recommended.
|
|
46
|
+
- **Mailmap**: Use a `.mailmap` file in the repo root to resolve duplicate author names.
|
|
47
|
+
""")
|
|
48
|
+
|
|
21
49
|
default_repo = "."
|
|
22
50
|
if len(sys.argv) > 1:
|
|
23
51
|
default_repo = sys.argv[1]
|
|
24
52
|
|
|
25
|
-
repo_path =
|
|
26
|
-
|
|
53
|
+
repo_path = default_repo
|
|
54
|
+
# Path display removed as per user request
|
|
55
|
+
|
|
56
|
+
# Fetch branches for the selectbox
|
|
57
|
+
try:
|
|
58
|
+
import git
|
|
59
|
+
repo = git.Repo(repo_path)
|
|
60
|
+
# Get local branches
|
|
61
|
+
branches = [h.name for h in repo.heads]
|
|
62
|
+
|
|
63
|
+
# Try to determine the best default branch (active one, or master/main)
|
|
64
|
+
try:
|
|
65
|
+
current_active = repo.active_branch.name
|
|
66
|
+
except:
|
|
67
|
+
current_active = "master"
|
|
68
|
+
|
|
69
|
+
if current_active in branches:
|
|
70
|
+
branches.remove(current_active)
|
|
71
|
+
|
|
72
|
+
options = [current_active] + sorted(branches)
|
|
73
|
+
branch = st.sidebar.selectbox("Branch", options=options)
|
|
74
|
+
except Exception as e:
|
|
75
|
+
# Fallback if git repo access fails
|
|
76
|
+
branch = st.sidebar.text_input("Branch", value="master")
|
|
27
77
|
|
|
28
78
|
with st.sidebar.expander("Analysis Parameters"):
|
|
29
79
|
cohortfm = st.text_input(
|
|
@@ -35,9 +85,23 @@ with st.sidebar.expander("Analysis Parameters"):
|
|
|
35
85
|
"- `%Y-W%W`: Week (e.g., 2023-W01)\n"
|
|
36
86
|
"- `%Y-%m-%d`: Day"
|
|
37
87
|
)
|
|
38
|
-
interval = st.number_input(
|
|
39
|
-
|
|
40
|
-
|
|
88
|
+
interval = st.number_input(
|
|
89
|
+
"Analysis Interval (seconds)",
|
|
90
|
+
value=7 * 24 * 60 * 60,
|
|
91
|
+
help="The time step between data points. Default is 604800s (7 days). Larger values are faster; smaller values result in smoother curves."
|
|
92
|
+
)
|
|
93
|
+
st.caption(f"Current resolution: {interval / 86400:.1f} days")
|
|
94
|
+
|
|
95
|
+
procs = st.number_input(
|
|
96
|
+
"Parallel Processes",
|
|
97
|
+
value=2,
|
|
98
|
+
min_value=1,
|
|
99
|
+
help="Number of concurrent processes. Increase to speed up analysis on multi-core CPUs, but note it increases RAM usage."
|
|
100
|
+
)
|
|
101
|
+
ignore = st.text_area(
|
|
102
|
+
"Ignore Patterns",
|
|
103
|
+
help="Glob patterns to ignore (comma separated), e.g.: 'tests/**, *.md'"
|
|
104
|
+
).split(",")
|
|
41
105
|
ignore = [i.strip() for i in ignore if i.strip()]
|
|
42
106
|
|
|
43
107
|
@st.cache_data(show_spinner=False)
|
|
@@ -71,7 +135,7 @@ if st.sidebar.button("🚀 Run Analysis") or (len(sys.argv) > 1 and st.session_s
|
|
|
71
135
|
# Main View
|
|
72
136
|
if st.session_state.analysis_results:
|
|
73
137
|
results = st.session_state.analysis_results
|
|
74
|
-
tab1, tab2, tab3 = st.tabs(["Stack Plot", "Line Plot", "Survival Plot"])
|
|
138
|
+
tab1, tab2, tab3, tab4 = st.tabs(["Stack Plot", "Line Plot", "Distribution", "Survival Plot"])
|
|
75
139
|
|
|
76
140
|
with tab1:
|
|
77
141
|
st.header("Stack Plot")
|
|
@@ -93,7 +157,7 @@ if st.session_state.analysis_results:
|
|
|
93
157
|
data = results.get(data_key)
|
|
94
158
|
if data:
|
|
95
159
|
fig = plotly_stack_plot(data, normalize=normalize, max_n=max_n, title=project_name)
|
|
96
|
-
st.plotly_chart(fig,
|
|
160
|
+
st.plotly_chart(fig, width="stretch")
|
|
97
161
|
else:
|
|
98
162
|
st.warning(f"Data for {data_source_label} not found.")
|
|
99
163
|
|
|
@@ -110,11 +174,27 @@ if st.session_state.analysis_results:
|
|
|
110
174
|
data_line = results.get(data_key_line)
|
|
111
175
|
if data_line:
|
|
112
176
|
fig = plotly_line_plot(data_line, normalize=normalize_line, max_n=max_n_line, title=project_name)
|
|
113
|
-
st.plotly_chart(fig,
|
|
177
|
+
st.plotly_chart(fig, width="stretch")
|
|
114
178
|
else:
|
|
115
179
|
st.warning(f"Data for {data_source_label_line} not found.")
|
|
116
180
|
|
|
117
181
|
with tab3:
|
|
182
|
+
st.header("Latest Distribution")
|
|
183
|
+
col1, col2 = st.columns([1, 3])
|
|
184
|
+
with col1:
|
|
185
|
+
data_source_label_bar = st.selectbox("Data Source", list(source_map.keys()), key="bar_source")
|
|
186
|
+
data_key_bar = source_map[data_source_label_bar]
|
|
187
|
+
max_n_bar = st.slider("Max Series", 5, 100, 30, key="bar_max_n")
|
|
188
|
+
with col2:
|
|
189
|
+
project_name = os.path.basename(os.path.abspath(repo_path))
|
|
190
|
+
data_bar = results.get(data_key_bar)
|
|
191
|
+
if data_bar:
|
|
192
|
+
fig = plotly_bar_plot(data_bar, max_n=max_n_bar, title=f"{project_name} - {data_source_label_bar}")
|
|
193
|
+
st.plotly_chart(fig, width="stretch")
|
|
194
|
+
else:
|
|
195
|
+
st.warning(f"Data for {data_source_label_bar} not found.")
|
|
196
|
+
|
|
197
|
+
with tab4:
|
|
118
198
|
st.header("Survival Plot")
|
|
119
199
|
col1, col2 = st.columns([1, 3])
|
|
120
200
|
with col1:
|
|
@@ -125,7 +205,7 @@ if st.session_state.analysis_results:
|
|
|
125
205
|
survival_data = results.get("survival")
|
|
126
206
|
if survival_data:
|
|
127
207
|
fig = plotly_survival_plot(survival_data, exp_fit=exp_fit, years=years, title=project_name)
|
|
128
|
-
st.plotly_chart(fig,
|
|
208
|
+
st.plotly_chart(fig, width="stretch")
|
|
129
209
|
else:
|
|
130
210
|
st.warning("Survival data not found.")
|
|
131
211
|
|
|
@@ -7,9 +7,8 @@ def main():
|
|
|
7
7
|
cmd_dir = os.path.dirname(os.path.abspath(__file__))
|
|
8
8
|
app_path = os.path.join(cmd_dir, "app.py")
|
|
9
9
|
|
|
10
|
-
#
|
|
11
|
-
repo_path =
|
|
12
|
-
repo_path = os.path.abspath(repo_path)
|
|
10
|
+
# Always use the current working directory
|
|
11
|
+
repo_path = os.path.abspath(os.getcwd())
|
|
13
12
|
|
|
14
13
|
# Run streamlit
|
|
15
14
|
# We pass the repo_path as an argument to the streamlit script
|
|
@@ -240,4 +240,37 @@ def plotly_survival_plot(commit_history, exp_fit=False, years=5, title=None):
|
|
|
240
240
|
)
|
|
241
241
|
|
|
242
242
|
|
|
243
|
+
return fig
|
|
244
|
+
|
|
245
|
+
def plotly_bar_plot(data, max_n=20, title=None):
|
|
246
|
+
ts, y, labels = _process_stack_line_data(data, max_n, normalize=False)
|
|
247
|
+
|
|
248
|
+
# Get latest data point (current state)
|
|
249
|
+
latest_values = [row[-1] for row in y]
|
|
250
|
+
|
|
251
|
+
# Sort by value for better bar chart presentation
|
|
252
|
+
# (Though _process_stack_line_data already does some sorting, we want descending order)
|
|
253
|
+
indices = sorted(range(len(labels)), key=lambda i: latest_values[i], reverse=True)
|
|
254
|
+
|
|
255
|
+
sorted_labels = [labels[i] for i in indices]
|
|
256
|
+
sorted_values = [latest_values[i] for i in indices]
|
|
257
|
+
|
|
258
|
+
# Generate colors
|
|
259
|
+
colors = px.colors.qualitative.Plotly
|
|
260
|
+
if len(sorted_labels) > len(colors):
|
|
261
|
+
colors = px.colors.qualitative.Dark24
|
|
262
|
+
|
|
263
|
+
fig = go.Figure(go.Bar(
|
|
264
|
+
x=sorted_labels,
|
|
265
|
+
y=sorted_values,
|
|
266
|
+
marker_color=[colors[i % len(colors)] for i in range(len(sorted_labels))]
|
|
267
|
+
))
|
|
268
|
+
|
|
269
|
+
fig.update_layout(
|
|
270
|
+
title=dict(text=f"{title} (Current Distribution)" if title else "Current Distribution", x=0.5),
|
|
271
|
+
yaxis=dict(title="Lines of Code"),
|
|
272
|
+
xaxis=dict(title=""),
|
|
273
|
+
margin=dict(l=20, r=20, t=50, b=100),
|
|
274
|
+
)
|
|
275
|
+
|
|
243
276
|
return fig
|
|
@@ -5,7 +5,7 @@ with open("README.md", "r", encoding="utf-8") as fh:
|
|
|
5
5
|
|
|
6
6
|
setup(
|
|
7
7
|
name="better-git-of-theseus",
|
|
8
|
-
version="0.4.
|
|
8
|
+
version="0.4.5",
|
|
9
9
|
description="Plot stats on Git repositories with interactive Plotly charts",
|
|
10
10
|
long_description=long_description,
|
|
11
11
|
long_description_content_type="text/markdown",
|
|
@@ -27,11 +27,7 @@ setup(
|
|
|
27
27
|
],
|
|
28
28
|
entry_points={
|
|
29
29
|
"console_scripts": [
|
|
30
|
-
"git-of-theseus
|
|
31
|
-
"git-of-theseus-survival-plot=git_of_theseus:survival_plot_cmdline",
|
|
32
|
-
"git-of-theseus-stack-plot=git_of_theseus:stack_plot_cmdline",
|
|
33
|
-
"git-of-theseus-line-plot=git_of_theseus:line_plot_cmdline",
|
|
34
|
-
"git-of-theseus-visualize=git_of_theseus.cmd:main",
|
|
30
|
+
"better-git-of-theseus=git_of_theseus.cmd:main",
|
|
35
31
|
]
|
|
36
32
|
},
|
|
37
33
|
)
|
|
@@ -1,122 +0,0 @@
|
|
|
1
|
-
Metadata-Version: 2.4
|
|
2
|
-
Name: better-git-of-theseus
|
|
3
|
-
Version: 0.4.0
|
|
4
|
-
Summary: Plot stats on Git repositories with interactive Plotly charts
|
|
5
|
-
Home-page: https://github.com/onewesong/better-git-of-theseus
|
|
6
|
-
Author: Erik Bernhardsson
|
|
7
|
-
Author-email: mail@erikbern.com
|
|
8
|
-
Description-Content-Type: text/markdown
|
|
9
|
-
License-File: LICENSE
|
|
10
|
-
Requires-Dist: gitpython
|
|
11
|
-
Requires-Dist: numpy
|
|
12
|
-
Requires-Dist: tqdm
|
|
13
|
-
Requires-Dist: wcmatch
|
|
14
|
-
Requires-Dist: pygments
|
|
15
|
-
Requires-Dist: plotly
|
|
16
|
-
Requires-Dist: streamlit
|
|
17
|
-
Requires-Dist: python-dateutil
|
|
18
|
-
Requires-Dist: scipy
|
|
19
|
-
Dynamic: author
|
|
20
|
-
Dynamic: author-email
|
|
21
|
-
Dynamic: description
|
|
22
|
-
Dynamic: description-content-type
|
|
23
|
-
Dynamic: home-page
|
|
24
|
-
Dynamic: license-file
|
|
25
|
-
Dynamic: requires-dist
|
|
26
|
-
Dynamic: summary
|
|
27
|
-
|
|
28
|
-
[](https://pypi.python.org/pypi/git-of-theseus)
|
|
29
|
-
|
|
30
|
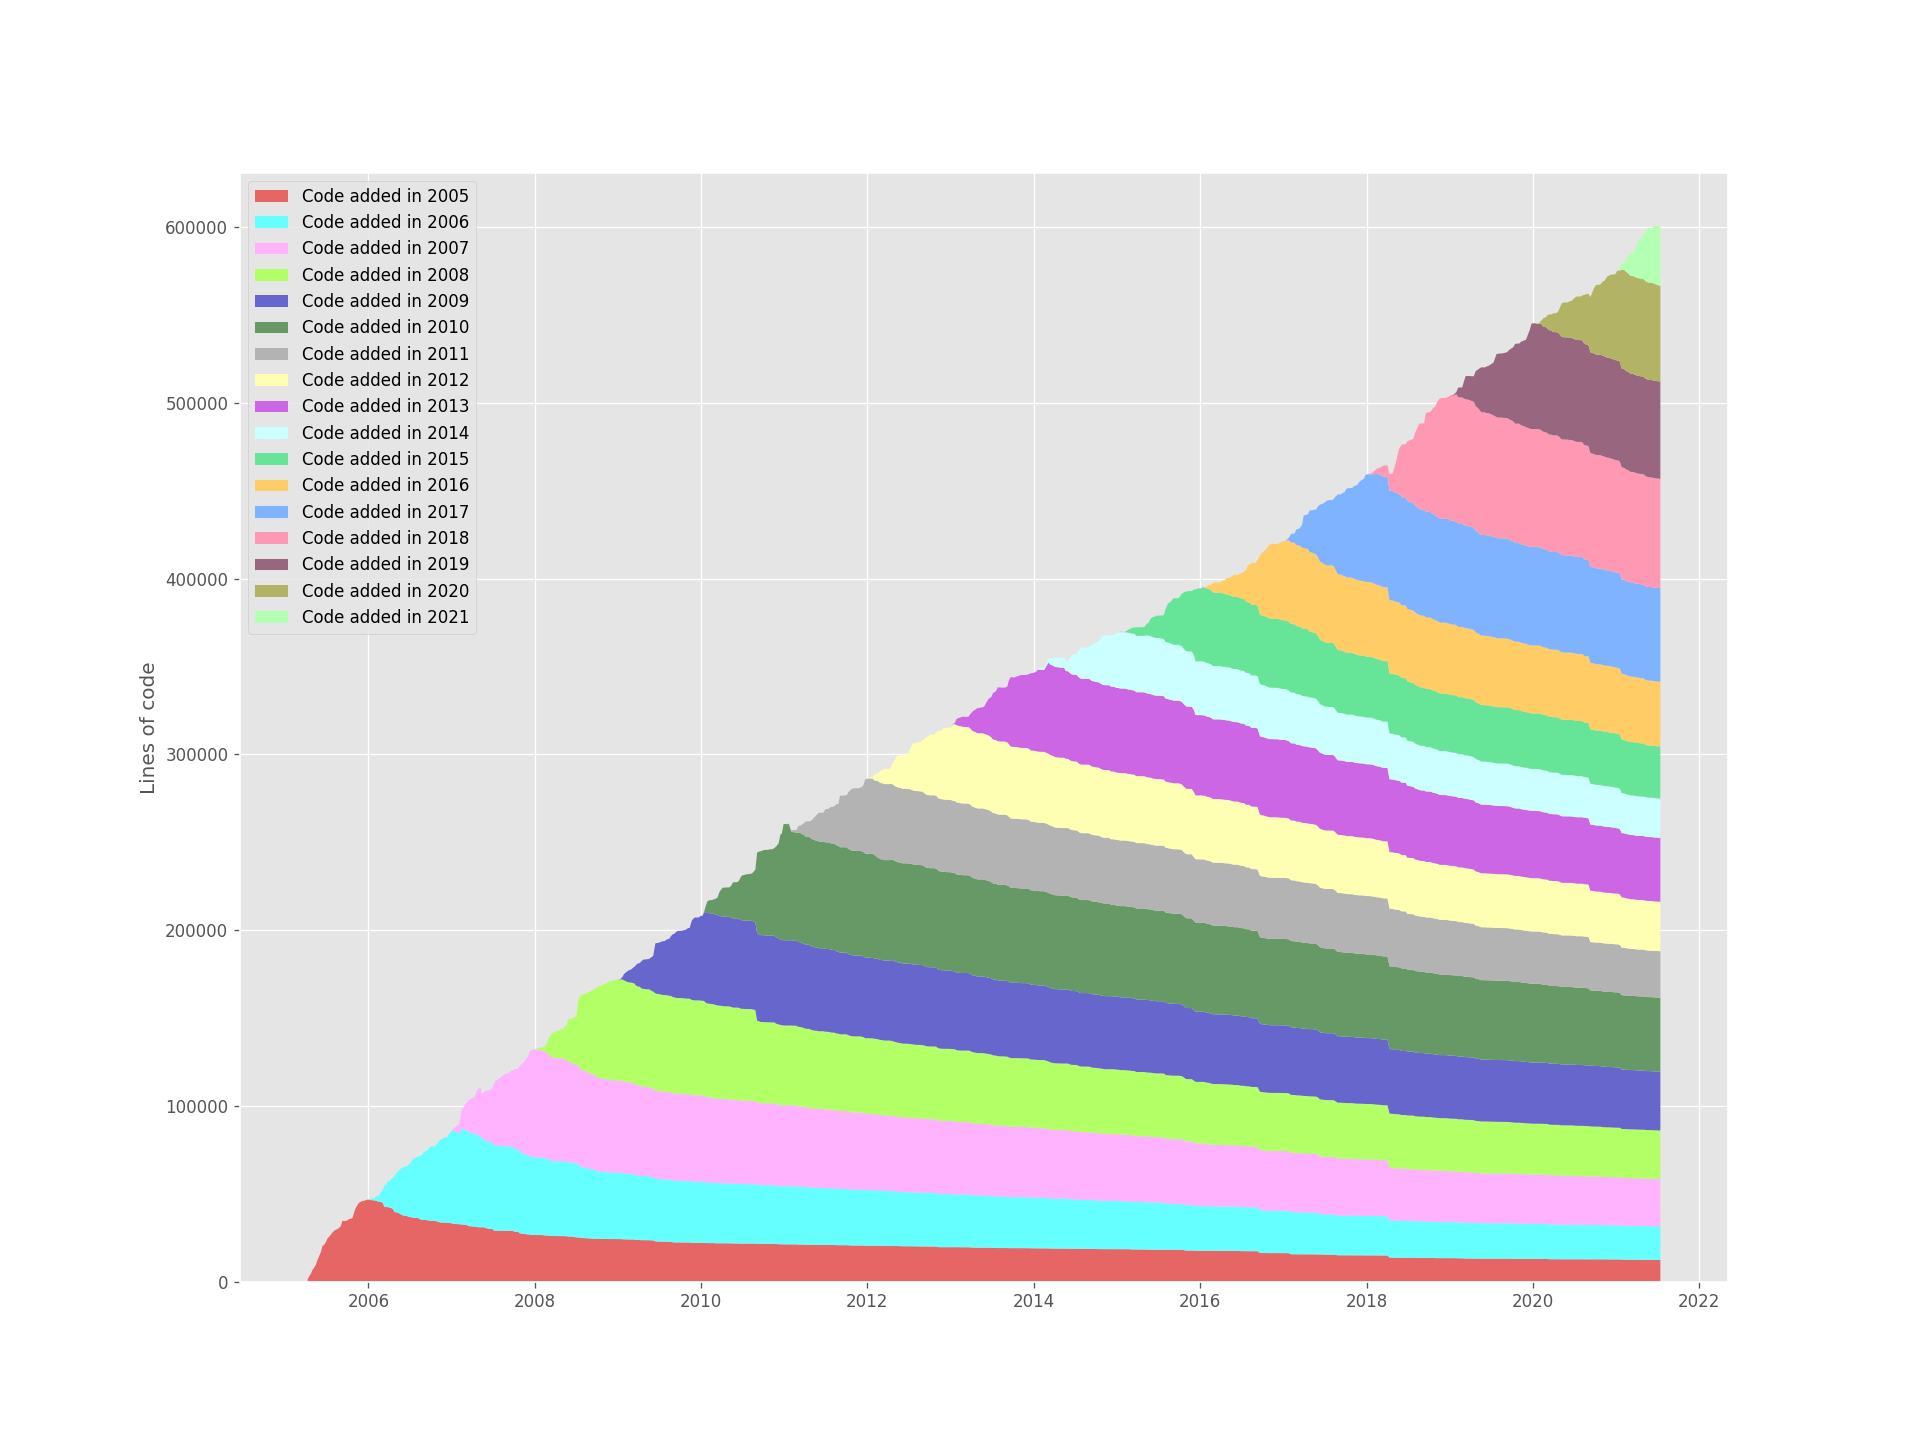
-
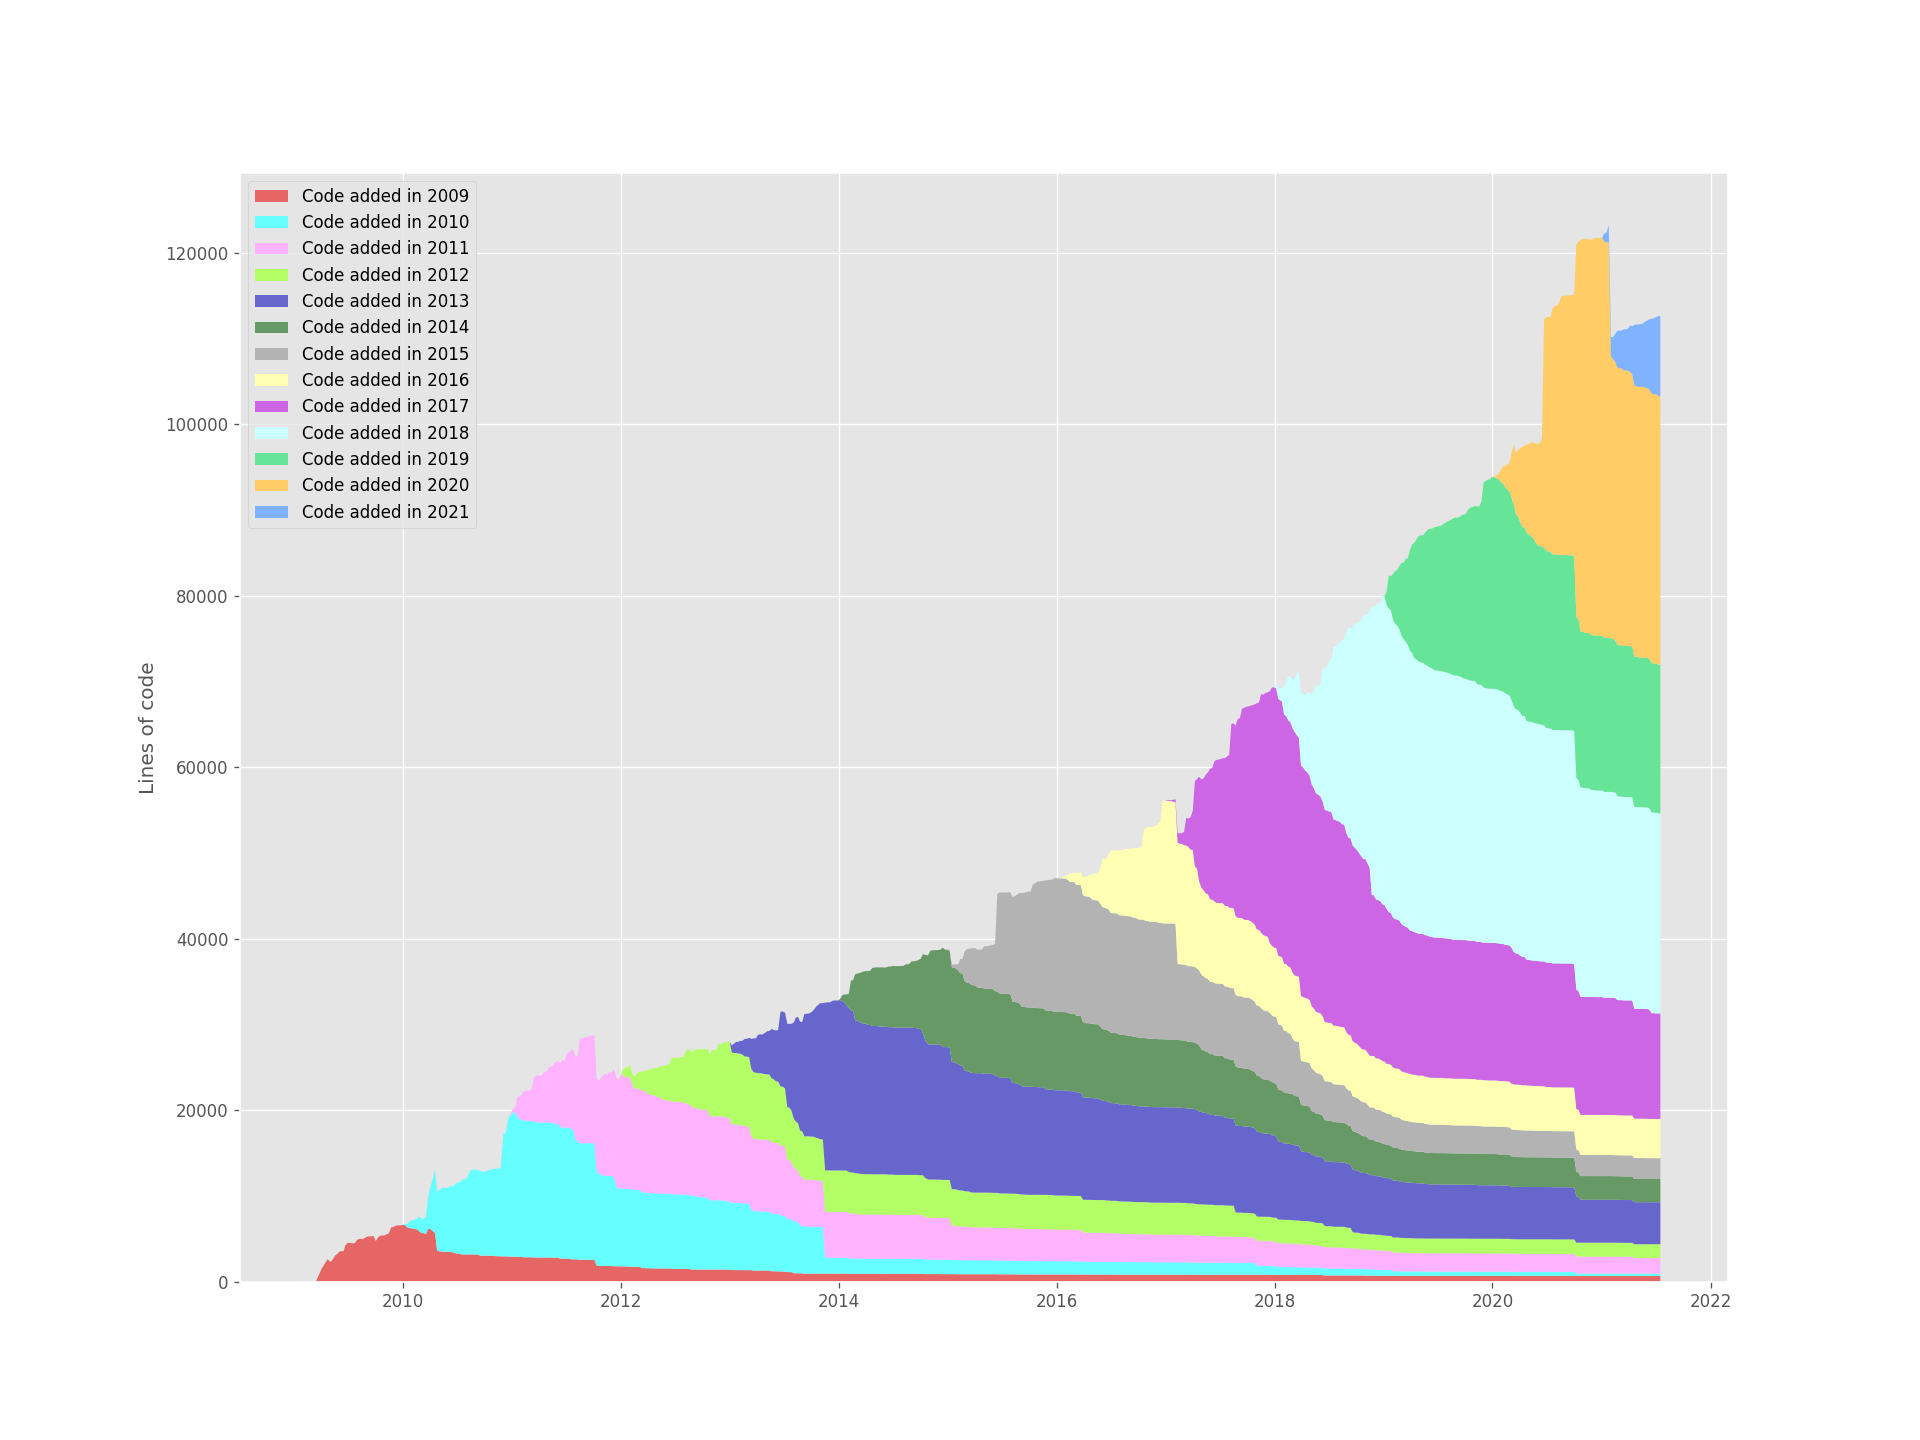
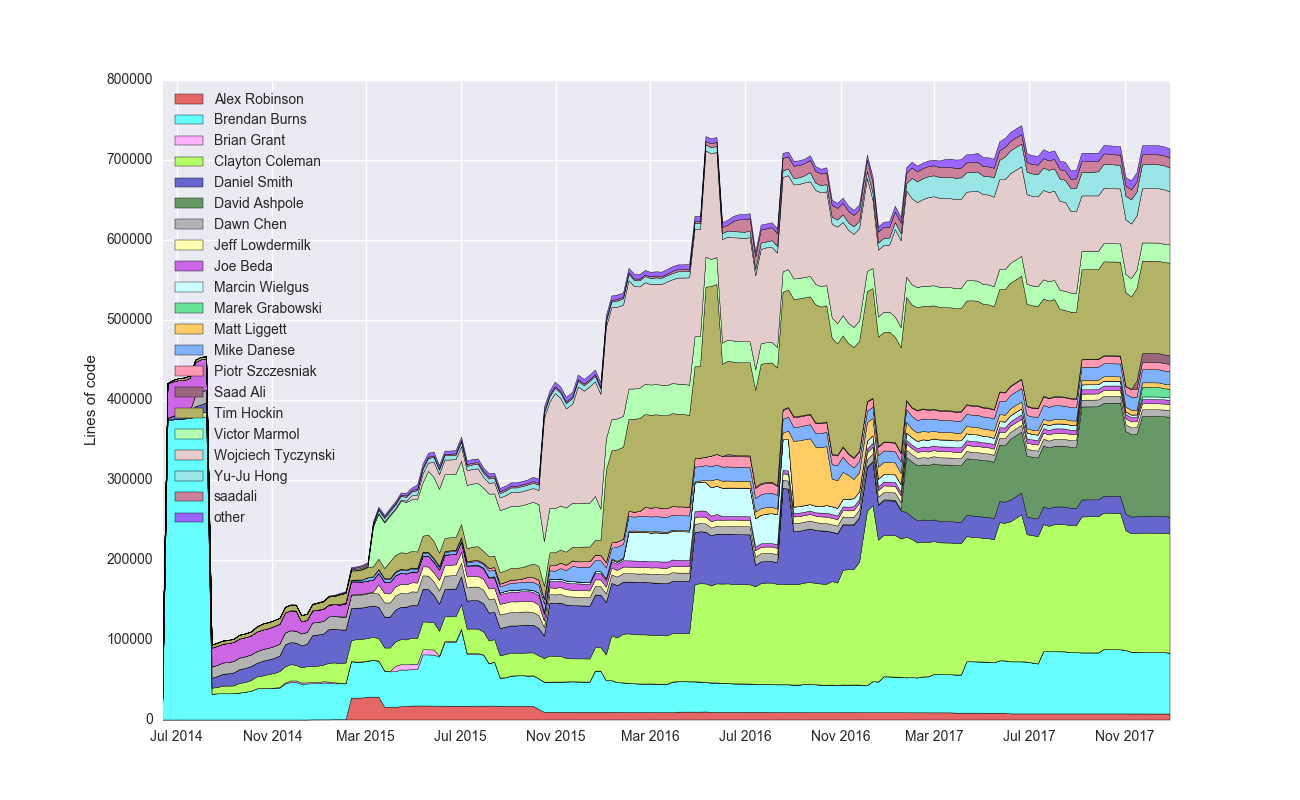
Some scripts to analyze Git repos. Produces cool looking graphs like this (running it on [git](https://github.com/git/git) itself):
|
|
31
|
-
|
|
32
|
-

|
|
33
|
-
|
|
34
|
-
Installing
|
|
35
|
-
----------
|
|
36
|
-
|
|
37
|
-
Run `pip install git-of-theseus`
|
|
38
|
-
|
|
39
|
-
Running
|
|
40
|
-
-------
|
|
41
|
-
|
|
42
|
-
First, you need to run `git-of-theseus-analyze <path to repo>` (see `git-of-theseus-analyze --help` for a bunch of config). This will analyze a repository and might take quite some time.
|
|
43
|
-
|
|
44
|
-
After that, you can generate plots! Some examples:
|
|
45
|
-
|
|
46
|
-
1. Run `git-of-theseus-stack-plot cohorts.json` will create a stack plot showing the total amount of code broken down into cohorts (what year the code was added)
|
|
47
|
-
1. Run `git-of-theseus-line-plot authors.json --normalize` will show a plot of the % of code contributed by the top 20 authors
|
|
48
|
-
1. Run `git-of-theseus-survival-plot survival.json`
|
|
49
|
-
|
|
50
|
-
You can run `--help` to see various options.
|
|
51
|
-
|
|
52
|
-
If you want to plot multiple repositories, have to run `git-of-theseus-analyze` separately for each project and store the data in separate directories using the `--outdir` flag. Then you can run `git-of-theseus-survival-plot <foo/survival.json> <bar/survival.json>` (optionally with the `--exp-fit` flag to fit an exponential decay)
|
|
53
|
-
|
|
54
|
-
Help
|
|
55
|
-
----
|
|
56
|
-
|
|
57
|
-
`AttributeError: Unknown property labels` – upgrade matplotlib if you are seeing this. `pip install matplotlib --upgrade`
|
|
58
|
-
|
|
59
|
-
Some pics
|
|
60
|
-
---------
|
|
61
|
-
|
|
62
|
-
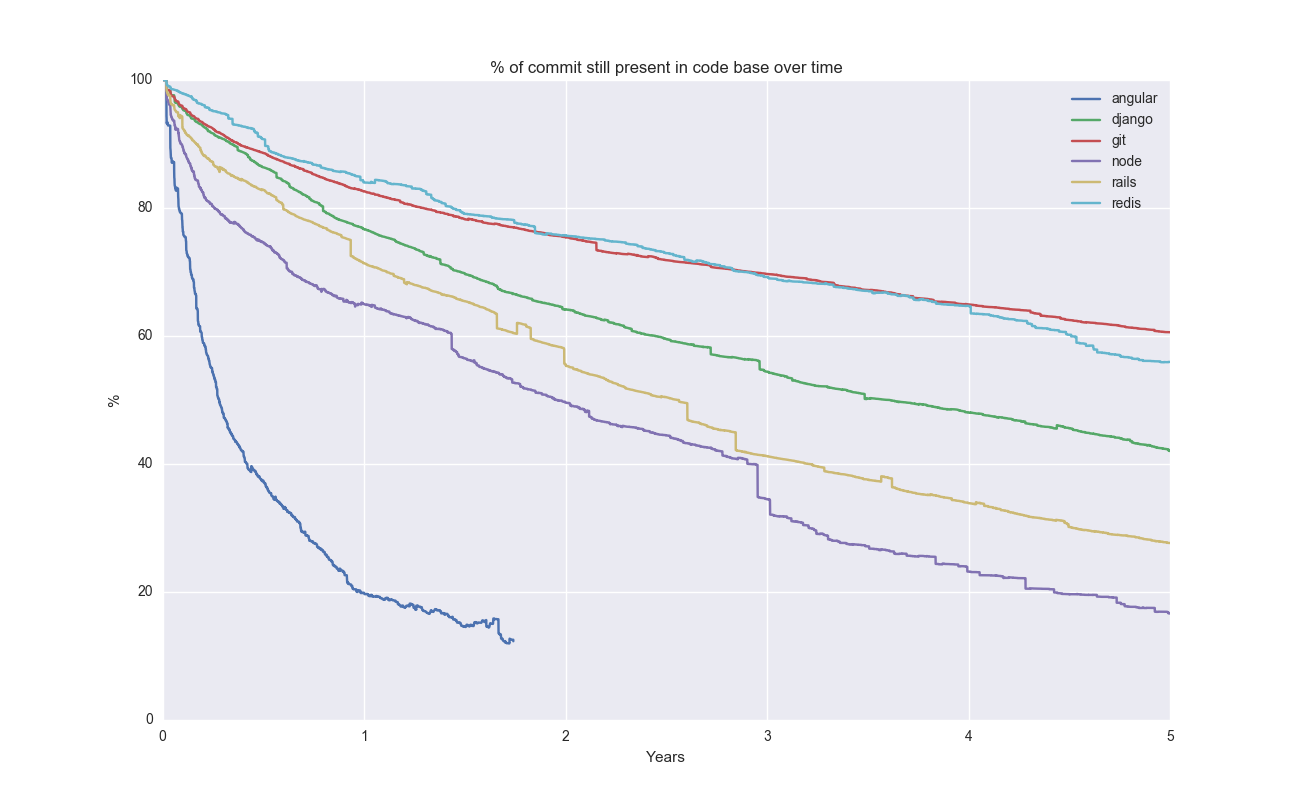
Survival of a line of code in a set of interesting repos:
|
|
63
|
-
|
|
64
|
-
|
|
65
|
-
|
|
66
|
-
This curve is produced by the `git-of-theseus-survival-plot` script and shows the *percentage of lines in a commit that are still present after x years*. It aggregates it over all commits, no matter what point in time they were made. So for *x=0* it includes all commits, whereas for *x>0* not all commits are counted (because we would have to look into the future for some of them). The survival curves are estimated using [Kaplan-Meier](https://en.wikipedia.org/wiki/Kaplan%E2%80%93Meier_estimator).
|
|
67
|
-
|
|
68
|
-
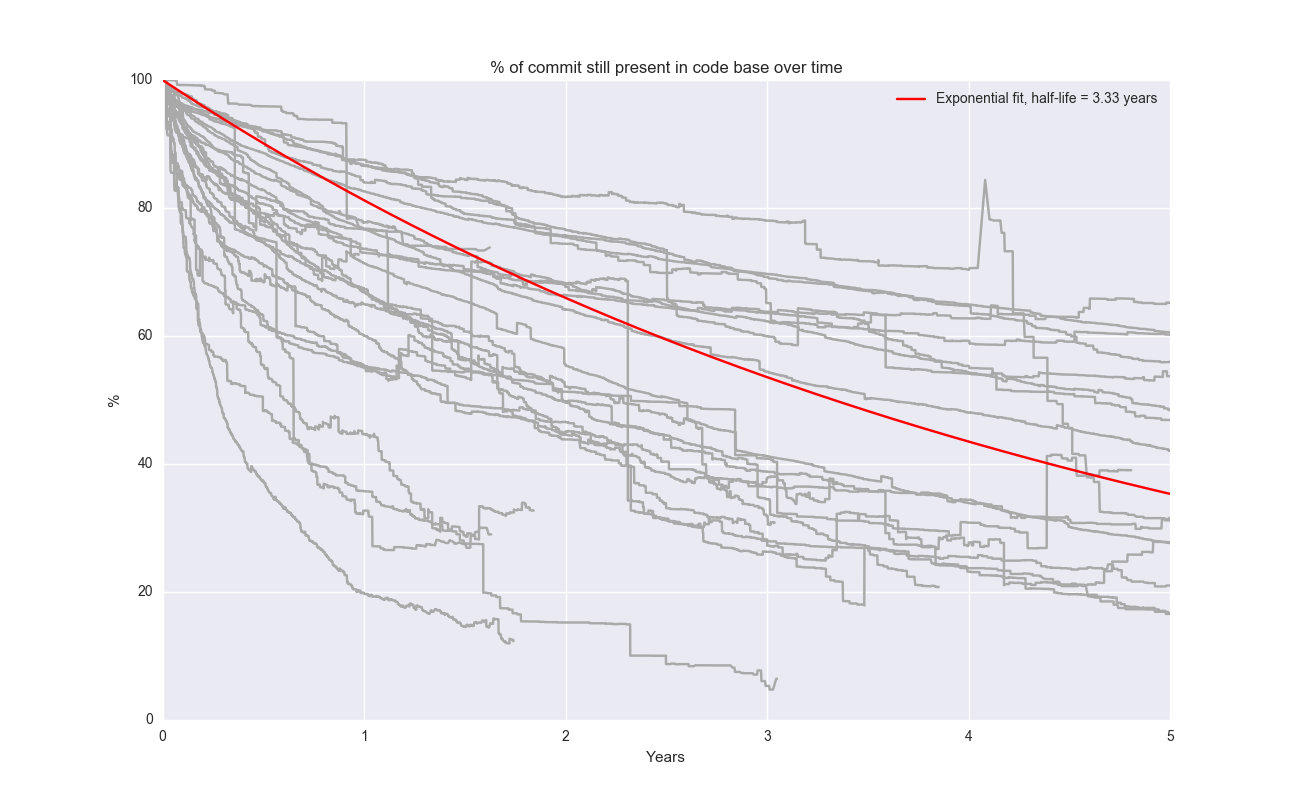
You can also add an exponential fit:
|
|
69
|
-
|
|
70
|
-
|
|
71
|
-
|
|
72
|
-
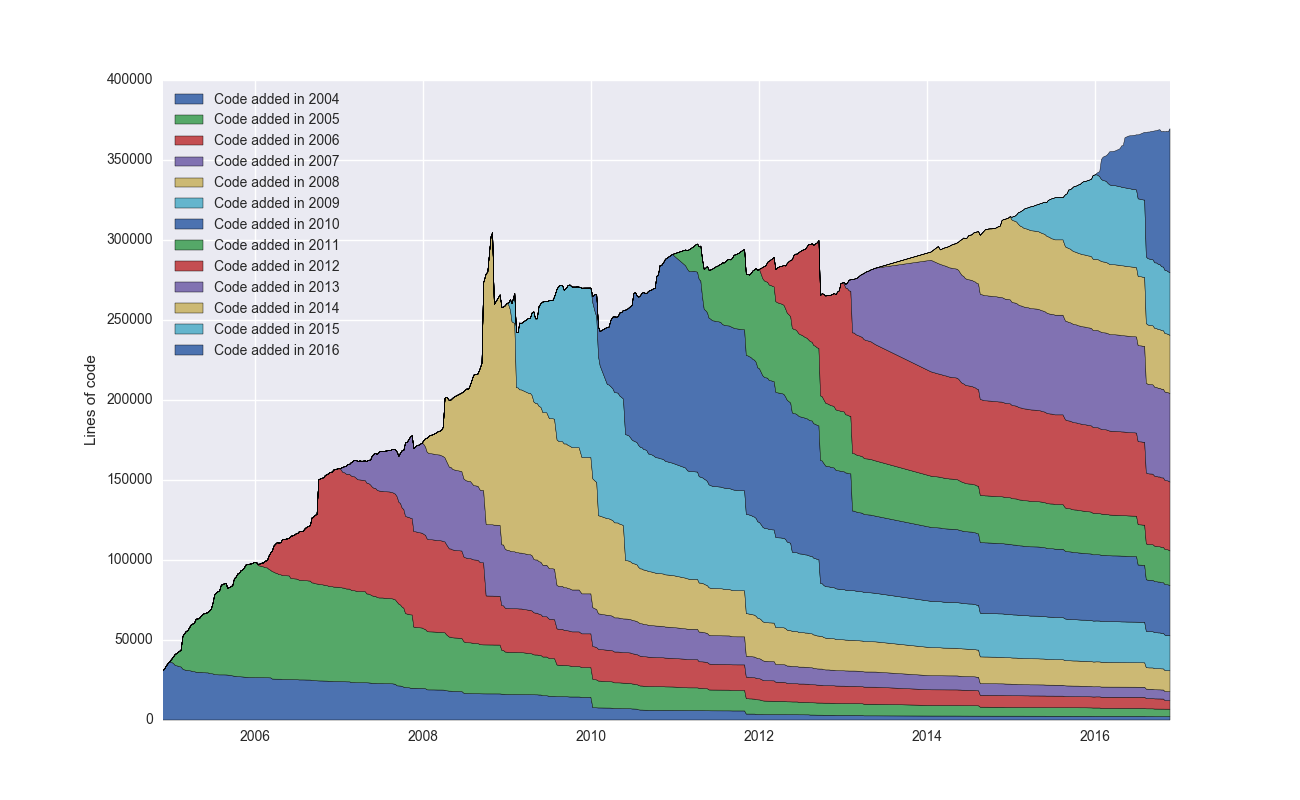
Linux – stack plot:
|
|
73
|
-
|
|
74
|
-
|
|
75
|
-
|
|
76
|
-
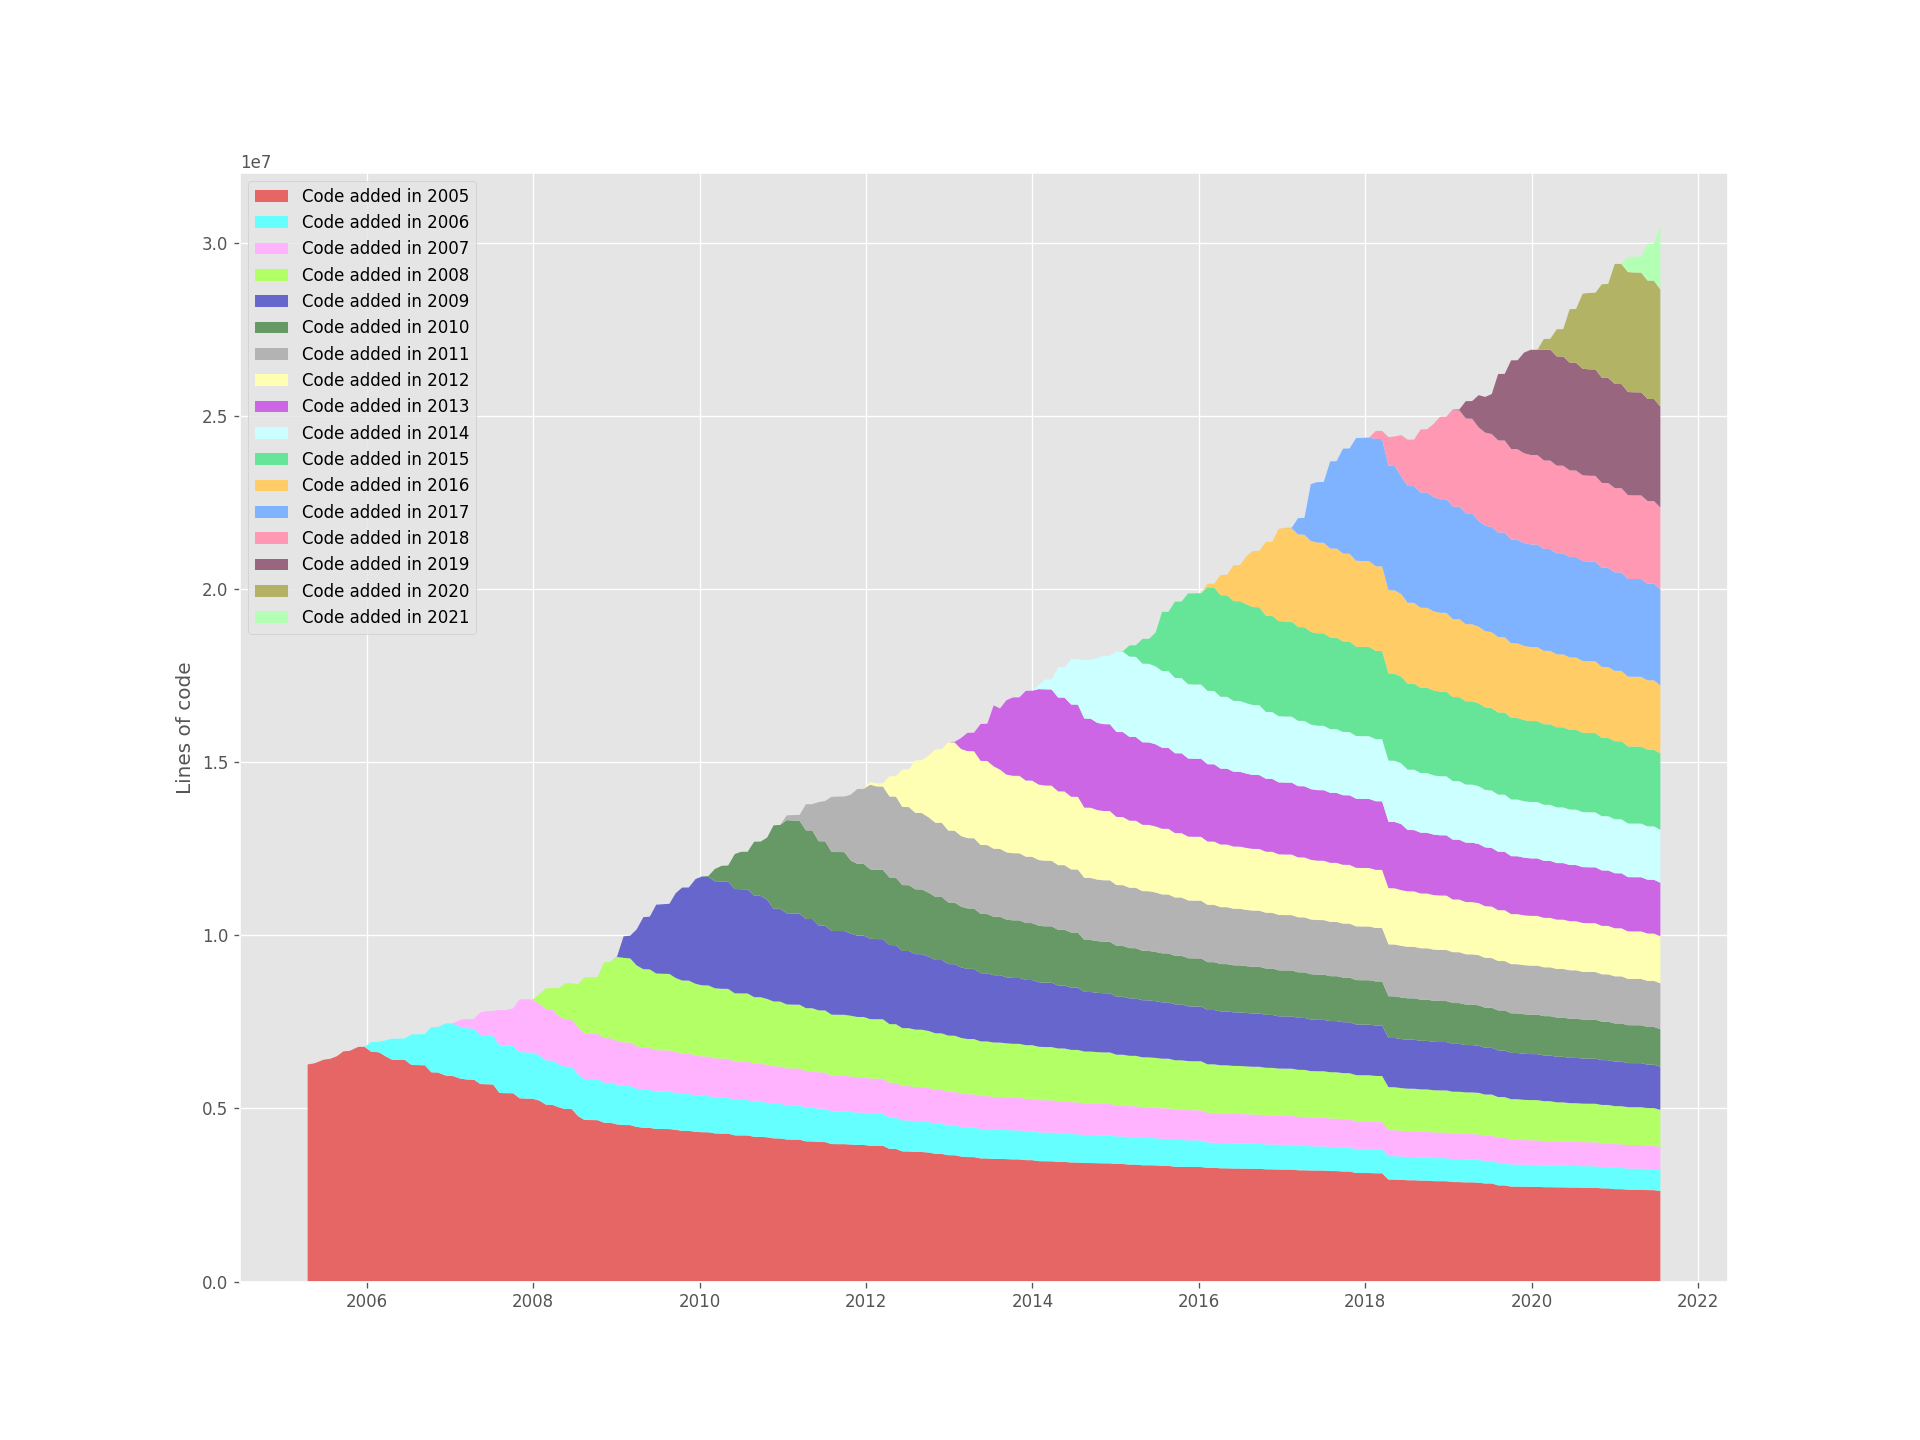
This curve is produced by the `git-of-theseus-stack-plot` script and shows the total number of lines in a repo broken down into cohorts by the year the code was added.
|
|
77
|
-
|
|
78
|
-
Node – stack plot:
|
|
79
|
-
|
|
80
|
-
|
|
81
|
-
|
|
82
|
-
Rails – stack plot:
|
|
83
|
-
|
|
84
|
-
|
|
85
|
-
|
|
86
|
-
Tensorflow – stack plot:
|
|
87
|
-
|
|
88
|
-
|
|
89
|
-
|
|
90
|
-
Rust – stack plot:
|
|
91
|
-
|
|
92
|
-
|
|
93
|
-
|
|
94
|
-
Plotting other stuff
|
|
95
|
-
--------------------
|
|
96
|
-
|
|
97
|
-
`git-of-theseus-analyze` will write `exts.json`, `cohorts.json` and `authors.json`. You can run `git-of-theseus-stack-plot authors.json` to plot author statistics as well, or `git-of-theseus-stack-plot exts.json` to plot file extension statistics. For author statistics, you might want to create a [.mailmap](https://git-scm.com/docs/gitmailmap) file in the root directory of the repository to deduplicate authors. If you need to create a .mailmap file the following command can list the distinct author-email combinations in a repository:
|
|
98
|
-
|
|
99
|
-
Mac / Linux
|
|
100
|
-
|
|
101
|
-
```shell
|
|
102
|
-
git log --pretty=format:"%an %ae" | sort | uniq
|
|
103
|
-
```
|
|
104
|
-
|
|
105
|
-
Windows Powershell
|
|
106
|
-
|
|
107
|
-
```powershell
|
|
108
|
-
git log --pretty=format:"%an %ae" | Sort-Object | Select-Object -Unique
|
|
109
|
-
```
|
|
110
|
-
|
|
111
|
-
For instance, here's the author statistics for [Kubernetes](https://github.com/kubernetes/kubernetes):
|
|
112
|
-
|
|
113
|
-
|
|
114
|
-
|
|
115
|
-
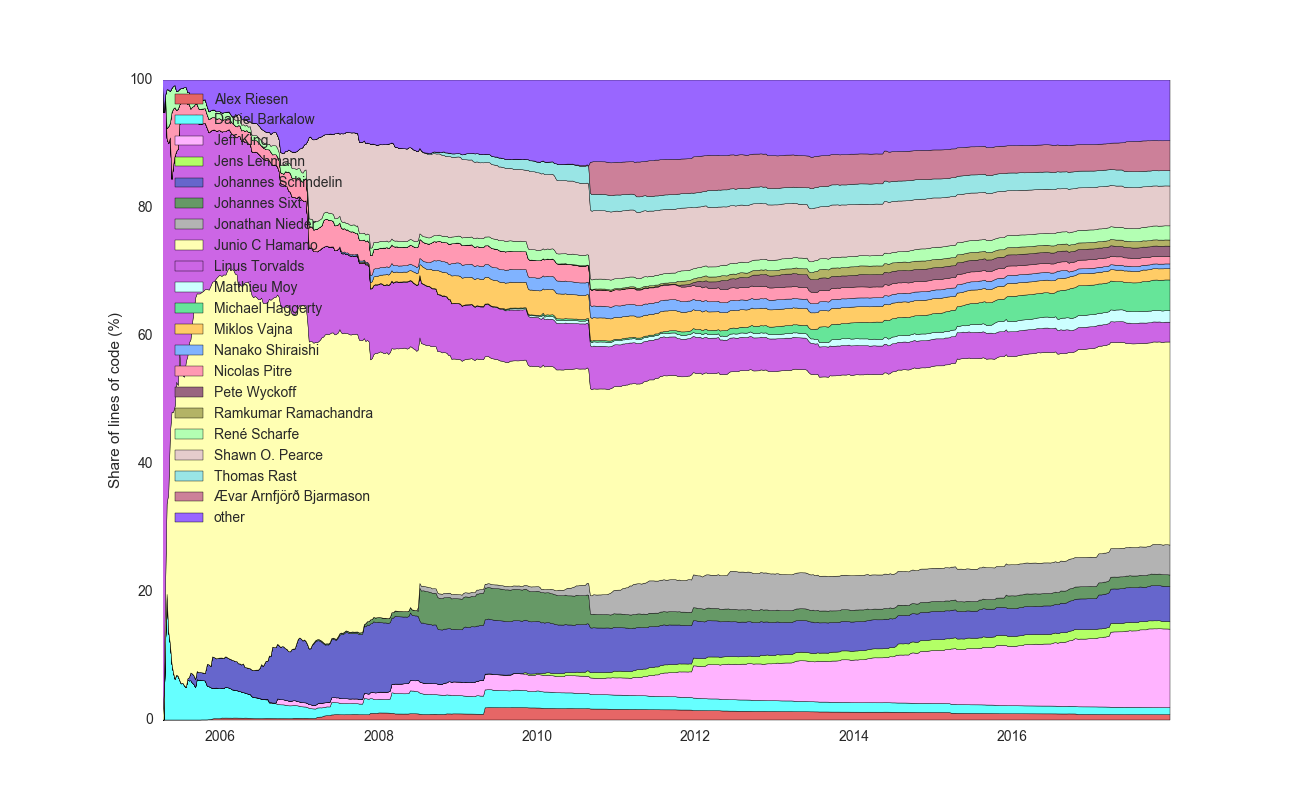
You can also normalize it to 100%. Here's author statistics for Git:
|
|
116
|
-
|
|
117
|
-
|
|
118
|
-
|
|
119
|
-
Other stuff
|
|
120
|
-
-----------
|
|
121
|
-
|
|
122
|
-
[Markovtsev Vadim](https://twitter.com/tmarkhor) implemented a very similar analysis that claims to be 20%-6x faster than Git of Theseus. It's named [Hercules](https://github.com/src-d/hercules) and there's a great [blog post](https://web.archive.org/web/20180918135417/https://blog.sourced.tech/post/hercules.v4/) about all the complexity going into the analysis of Git history.
|
|
@@ -1,95 +0,0 @@
|
|
|
1
|
-
[](https://pypi.python.org/pypi/git-of-theseus)
|
|
2
|
-
|
|
3
|
-
Some scripts to analyze Git repos. Produces cool looking graphs like this (running it on [git](https://github.com/git/git) itself):
|
|
4
|
-
|
|
5
|
-

|
|
6
|
-
|
|
7
|
-
Installing
|
|
8
|
-
----------
|
|
9
|
-
|
|
10
|
-
Run `pip install git-of-theseus`
|
|
11
|
-
|
|
12
|
-
Running
|
|
13
|
-
-------
|
|
14
|
-
|
|
15
|
-
First, you need to run `git-of-theseus-analyze <path to repo>` (see `git-of-theseus-analyze --help` for a bunch of config). This will analyze a repository and might take quite some time.
|
|
16
|
-
|
|
17
|
-
After that, you can generate plots! Some examples:
|
|
18
|
-
|
|
19
|
-
1. Run `git-of-theseus-stack-plot cohorts.json` will create a stack plot showing the total amount of code broken down into cohorts (what year the code was added)
|
|
20
|
-
1. Run `git-of-theseus-line-plot authors.json --normalize` will show a plot of the % of code contributed by the top 20 authors
|
|
21
|
-
1. Run `git-of-theseus-survival-plot survival.json`
|
|
22
|
-
|
|
23
|
-
You can run `--help` to see various options.
|
|
24
|
-
|
|
25
|
-
If you want to plot multiple repositories, have to run `git-of-theseus-analyze` separately for each project and store the data in separate directories using the `--outdir` flag. Then you can run `git-of-theseus-survival-plot <foo/survival.json> <bar/survival.json>` (optionally with the `--exp-fit` flag to fit an exponential decay)
|
|
26
|
-
|
|
27
|
-
Help
|
|
28
|
-
----
|
|
29
|
-
|
|
30
|
-
`AttributeError: Unknown property labels` – upgrade matplotlib if you are seeing this. `pip install matplotlib --upgrade`
|
|
31
|
-
|
|
32
|
-
Some pics
|
|
33
|
-
---------
|
|
34
|
-
|
|
35
|
-
Survival of a line of code in a set of interesting repos:
|
|
36
|
-
|
|
37
|
-

|
|
38
|
-
|
|
39
|
-
This curve is produced by the `git-of-theseus-survival-plot` script and shows the *percentage of lines in a commit that are still present after x years*. It aggregates it over all commits, no matter what point in time they were made. So for *x=0* it includes all commits, whereas for *x>0* not all commits are counted (because we would have to look into the future for some of them). The survival curves are estimated using [Kaplan-Meier](https://en.wikipedia.org/wiki/Kaplan%E2%80%93Meier_estimator).
|
|
40
|
-
|
|
41
|
-
You can also add an exponential fit:
|
|
42
|
-
|
|
43
|
-

|
|
44
|
-
|
|
45
|
-
Linux – stack plot:
|
|
46
|
-
|
|
47
|
-

|
|
48
|
-
|
|
49
|
-
This curve is produced by the `git-of-theseus-stack-plot` script and shows the total number of lines in a repo broken down into cohorts by the year the code was added.
|
|
50
|
-
|
|
51
|
-
Node – stack plot:
|
|
52
|
-
|
|
53
|
-

|
|
54
|
-
|
|
55
|
-
Rails – stack plot:
|
|
56
|
-
|
|
57
|
-

|
|
58
|
-
|
|
59
|
-
Tensorflow – stack plot:
|
|
60
|
-
|
|
61
|
-

|
|
62
|
-
|
|
63
|
-
Rust – stack plot:
|
|
64
|
-
|
|
65
|
-

|
|
66
|
-
|
|
67
|
-
Plotting other stuff
|
|
68
|
-
--------------------
|
|
69
|
-
|
|
70
|
-
`git-of-theseus-analyze` will write `exts.json`, `cohorts.json` and `authors.json`. You can run `git-of-theseus-stack-plot authors.json` to plot author statistics as well, or `git-of-theseus-stack-plot exts.json` to plot file extension statistics. For author statistics, you might want to create a [.mailmap](https://git-scm.com/docs/gitmailmap) file in the root directory of the repository to deduplicate authors. If you need to create a .mailmap file the following command can list the distinct author-email combinations in a repository:
|
|
71
|
-
|
|
72
|
-
Mac / Linux
|
|
73
|
-
|
|
74
|
-
```shell
|
|
75
|
-
git log --pretty=format:"%an %ae" | sort | uniq
|
|
76
|
-
```
|
|
77
|
-
|
|
78
|
-
Windows Powershell
|
|
79
|
-
|
|
80
|
-
```powershell
|
|
81
|
-
git log --pretty=format:"%an %ae" | Sort-Object | Select-Object -Unique
|
|
82
|
-
```
|
|
83
|
-
|
|
84
|
-
For instance, here's the author statistics for [Kubernetes](https://github.com/kubernetes/kubernetes):
|
|
85
|
-
|
|
86
|
-

|
|
87
|
-
|
|
88
|
-
You can also normalize it to 100%. Here's author statistics for Git:
|
|
89
|
-
|
|
90
|
-

|
|
91
|
-
|
|
92
|
-
Other stuff
|
|
93
|
-
-----------
|
|
94
|
-
|
|
95
|
-
[Markovtsev Vadim](https://twitter.com/tmarkhor) implemented a very similar analysis that claims to be 20%-6x faster than Git of Theseus. It's named [Hercules](https://github.com/src-d/hercules) and there's a great [blog post](https://web.archive.org/web/20180918135417/https://blog.sourced.tech/post/hercules.v4/) about all the complexity going into the analysis of Git history.
|
|
@@ -1,122 +0,0 @@
|
|
|
1
|
-
Metadata-Version: 2.4
|
|
2
|
-
Name: better-git-of-theseus
|
|
3
|
-
Version: 0.4.0
|
|
4
|
-
Summary: Plot stats on Git repositories with interactive Plotly charts
|
|
5
|
-
Home-page: https://github.com/onewesong/better-git-of-theseus
|
|
6
|
-
Author: Erik Bernhardsson
|
|
7
|
-
Author-email: mail@erikbern.com
|
|
8
|
-
Description-Content-Type: text/markdown
|
|
9
|
-
License-File: LICENSE
|
|
10
|
-
Requires-Dist: gitpython
|
|
11
|
-
Requires-Dist: numpy
|
|
12
|
-
Requires-Dist: tqdm
|
|
13
|
-
Requires-Dist: wcmatch
|
|
14
|
-
Requires-Dist: pygments
|
|
15
|
-
Requires-Dist: plotly
|
|
16
|
-
Requires-Dist: streamlit
|
|
17
|
-
Requires-Dist: python-dateutil
|
|
18
|
-
Requires-Dist: scipy
|
|
19
|
-
Dynamic: author
|
|
20
|
-
Dynamic: author-email
|
|
21
|
-
Dynamic: description
|
|
22
|
-
Dynamic: description-content-type
|
|
23
|
-
Dynamic: home-page
|
|
24
|
-
Dynamic: license-file
|
|
25
|
-
Dynamic: requires-dist
|
|
26
|
-
Dynamic: summary
|
|
27
|
-
|
|
28
|
-
[](https://pypi.python.org/pypi/git-of-theseus)
|
|
29
|
-
|
|
30
|
-
Some scripts to analyze Git repos. Produces cool looking graphs like this (running it on [git](https://github.com/git/git) itself):
|
|
31
|
-
|
|
32
|
-

|
|
33
|
-
|
|
34
|
-
Installing
|
|
35
|
-
----------
|
|
36
|
-
|
|
37
|
-
Run `pip install git-of-theseus`
|
|
38
|
-
|
|
39
|
-
Running
|
|
40
|
-
-------
|
|
41
|
-
|
|
42
|
-
First, you need to run `git-of-theseus-analyze <path to repo>` (see `git-of-theseus-analyze --help` for a bunch of config). This will analyze a repository and might take quite some time.
|
|
43
|
-
|
|
44
|
-
After that, you can generate plots! Some examples:
|
|
45
|
-
|
|
46
|
-
1. Run `git-of-theseus-stack-plot cohorts.json` will create a stack plot showing the total amount of code broken down into cohorts (what year the code was added)
|
|
47
|
-
1. Run `git-of-theseus-line-plot authors.json --normalize` will show a plot of the % of code contributed by the top 20 authors
|
|
48
|
-
1. Run `git-of-theseus-survival-plot survival.json`
|
|
49
|
-
|
|
50
|
-
You can run `--help` to see various options.
|
|
51
|
-
|
|
52
|
-
If you want to plot multiple repositories, have to run `git-of-theseus-analyze` separately for each project and store the data in separate directories using the `--outdir` flag. Then you can run `git-of-theseus-survival-plot <foo/survival.json> <bar/survival.json>` (optionally with the `--exp-fit` flag to fit an exponential decay)
|
|
53
|
-
|
|
54
|
-
Help
|
|
55
|
-
----
|
|
56
|
-
|
|
57
|
-
`AttributeError: Unknown property labels` – upgrade matplotlib if you are seeing this. `pip install matplotlib --upgrade`
|
|
58
|
-
|
|
59
|
-
Some pics
|
|
60
|
-
---------
|
|
61
|
-
|
|
62
|
-
Survival of a line of code in a set of interesting repos:
|
|
63
|
-
|
|
64
|
-

|
|
65
|
-
|
|
66
|
-
This curve is produced by the `git-of-theseus-survival-plot` script and shows the *percentage of lines in a commit that are still present after x years*. It aggregates it over all commits, no matter what point in time they were made. So for *x=0* it includes all commits, whereas for *x>0* not all commits are counted (because we would have to look into the future for some of them). The survival curves are estimated using [Kaplan-Meier](https://en.wikipedia.org/wiki/Kaplan%E2%80%93Meier_estimator).
|
|
67
|
-
|
|
68
|
-
You can also add an exponential fit:
|
|
69
|
-
|
|
70
|
-

|
|
71
|
-
|
|
72
|
-
Linux – stack plot:
|
|
73
|
-
|
|
74
|
-

|
|
75
|
-
|
|
76
|
-
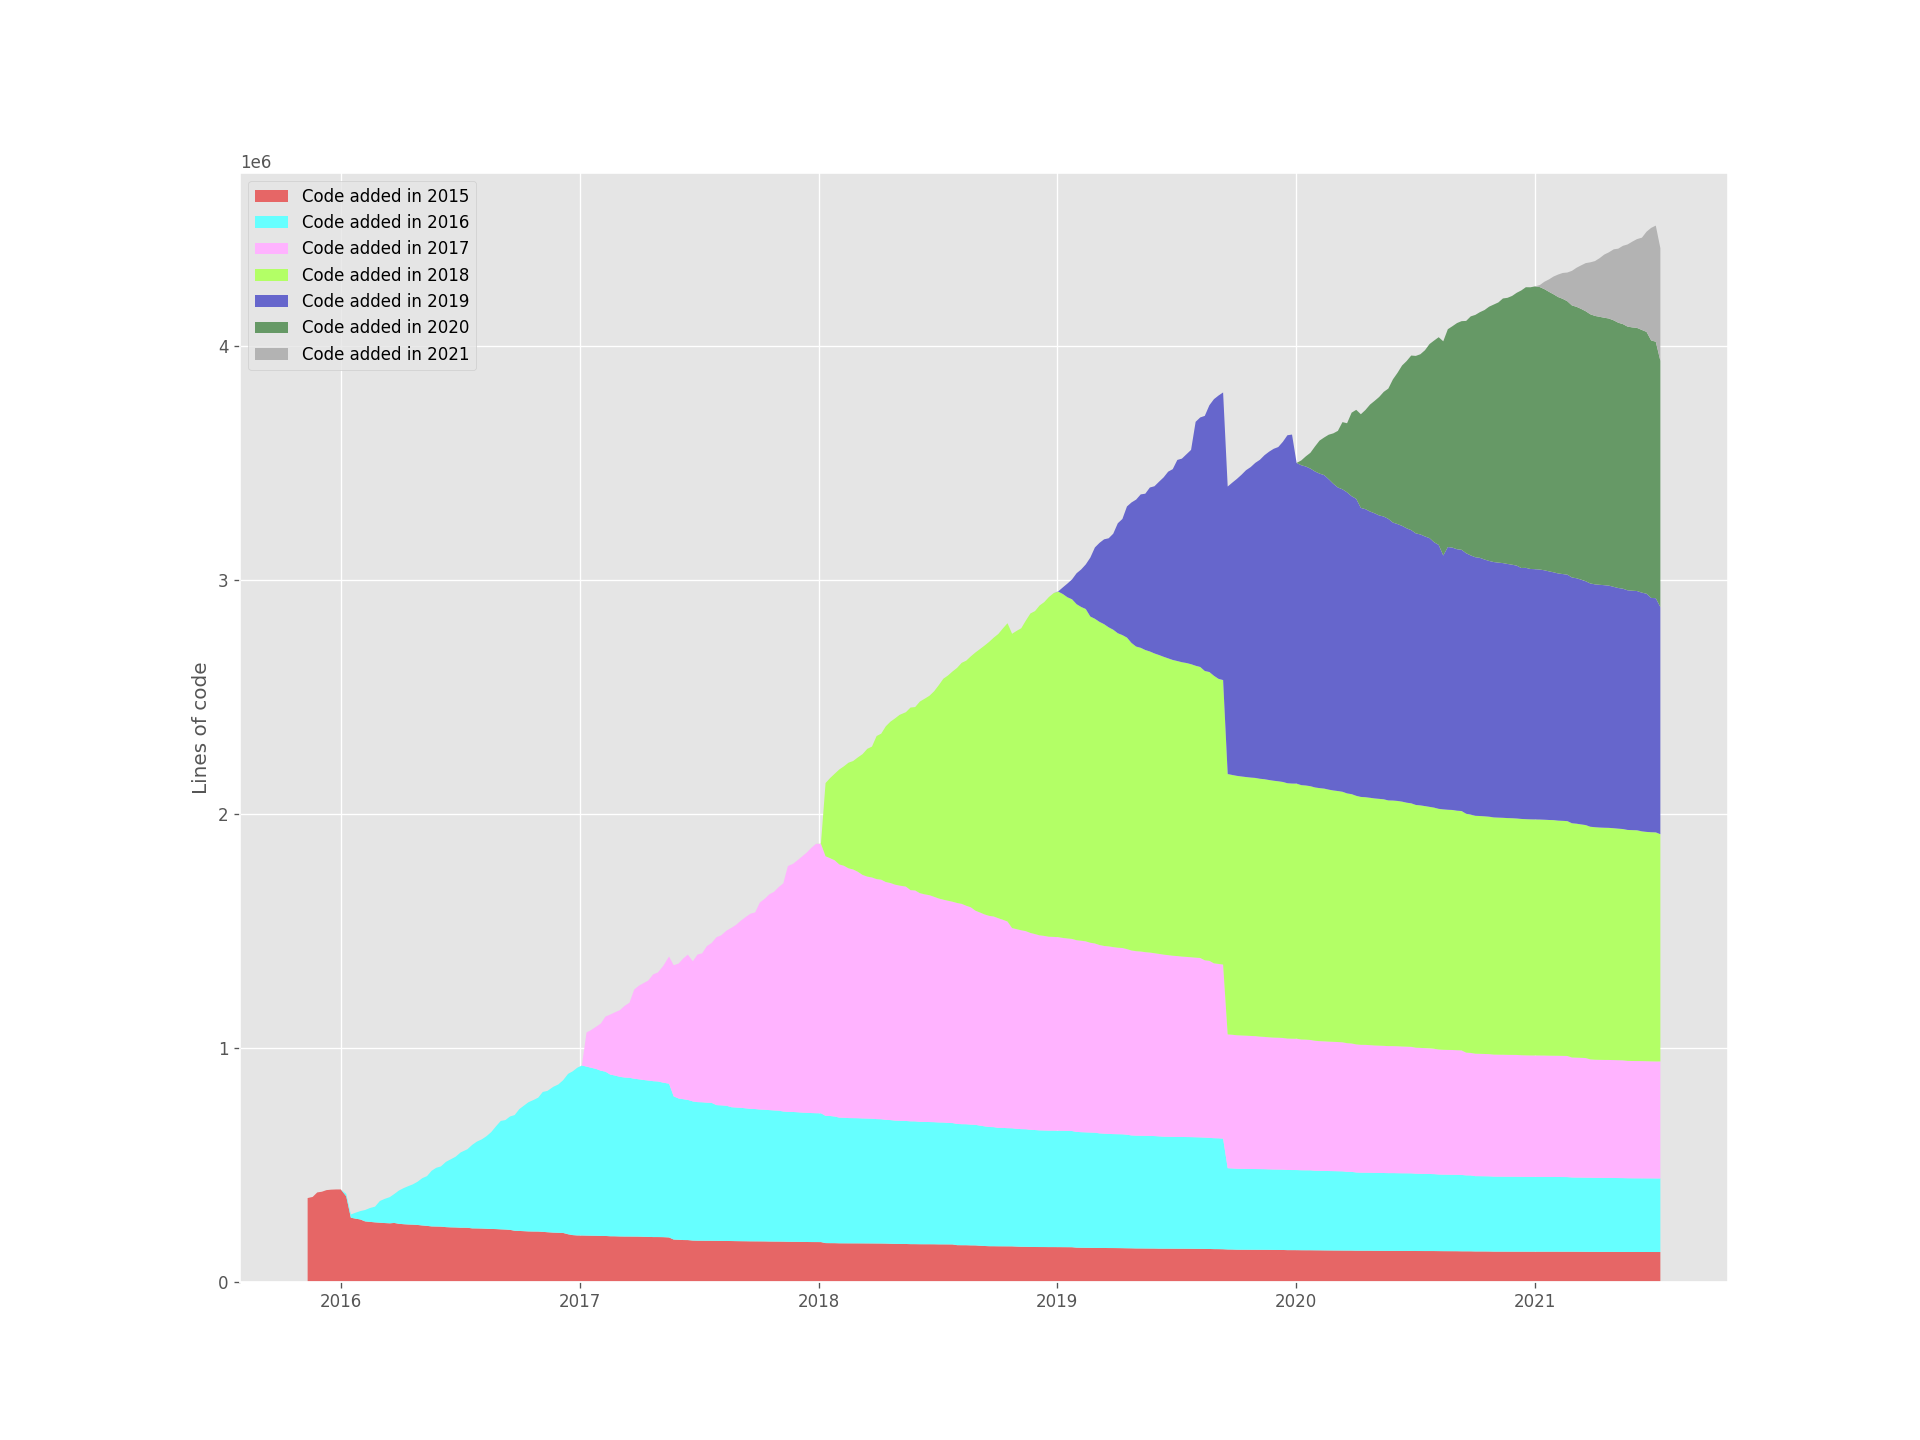
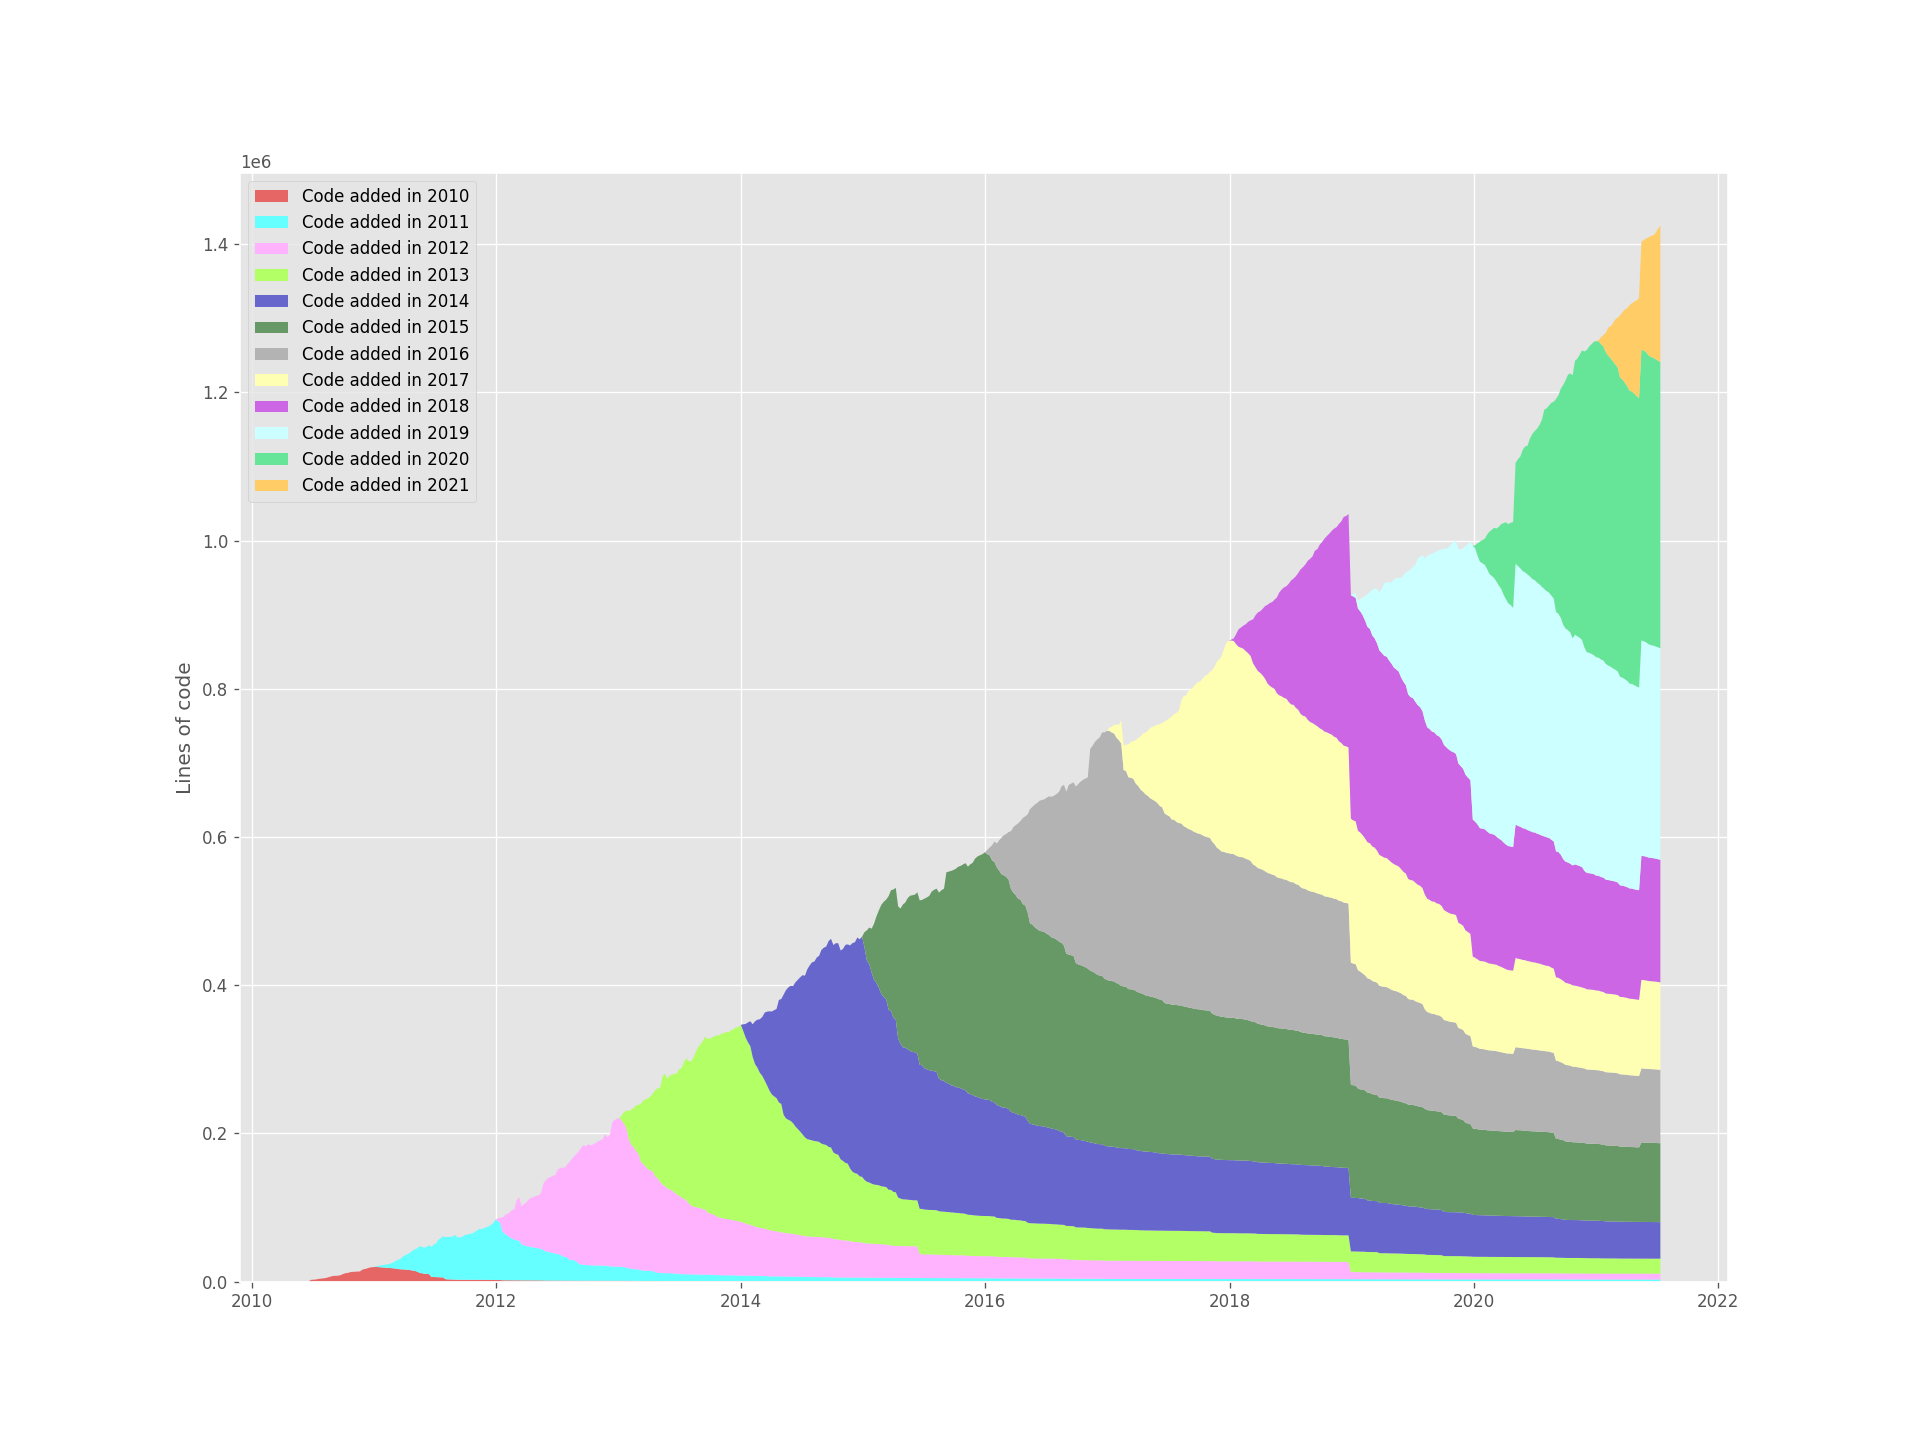
This curve is produced by the `git-of-theseus-stack-plot` script and shows the total number of lines in a repo broken down into cohorts by the year the code was added.
|
|
77
|
-
|
|
78
|
-
Node – stack plot:
|
|
79
|
-
|
|
80
|
-

|
|
81
|
-
|
|
82
|
-
Rails – stack plot:
|
|
83
|
-
|
|
84
|
-

|
|
85
|
-
|
|
86
|
-
Tensorflow – stack plot:
|
|
87
|
-
|
|
88
|
-

|
|
89
|
-
|
|
90
|
-
Rust – stack plot:
|
|
91
|
-
|
|
92
|
-

|
|
93
|
-
|
|
94
|
-
Plotting other stuff
|
|
95
|
-
--------------------
|
|
96
|
-
|
|
97
|
-
`git-of-theseus-analyze` will write `exts.json`, `cohorts.json` and `authors.json`. You can run `git-of-theseus-stack-plot authors.json` to plot author statistics as well, or `git-of-theseus-stack-plot exts.json` to plot file extension statistics. For author statistics, you might want to create a [.mailmap](https://git-scm.com/docs/gitmailmap) file in the root directory of the repository to deduplicate authors. If you need to create a .mailmap file the following command can list the distinct author-email combinations in a repository:
|
|
98
|
-
|
|
99
|
-
Mac / Linux
|
|
100
|
-
|
|
101
|
-
```shell
|
|
102
|
-
git log --pretty=format:"%an %ae" | sort | uniq
|
|
103
|
-
```
|
|
104
|
-
|
|
105
|
-
Windows Powershell
|
|
106
|
-
|
|
107
|
-
```powershell
|
|
108
|
-
git log --pretty=format:"%an %ae" | Sort-Object | Select-Object -Unique
|
|
109
|
-
```
|
|
110
|
-
|
|
111
|
-
For instance, here's the author statistics for [Kubernetes](https://github.com/kubernetes/kubernetes):
|
|
112
|
-
|
|
113
|
-

|
|
114
|
-
|
|
115
|
-
You can also normalize it to 100%. Here's author statistics for Git:
|
|
116
|
-
|
|
117
|
-

|
|
118
|
-
|
|
119
|
-
Other stuff
|
|
120
|
-
-----------
|
|
121
|
-
|
|
122
|
-
[Markovtsev Vadim](https://twitter.com/tmarkhor) implemented a very similar analysis that claims to be 20%-6x faster than Git of Theseus. It's named [Hercules](https://github.com/src-d/hercules) and there's a great [blog post](https://web.archive.org/web/20180918135417/https://blog.sourced.tech/post/hercules.v4/) about all the complexity going into the analysis of Git history.
|
|
@@ -1,6 +0,0 @@
|
|
|
1
|
-
[console_scripts]
|
|
2
|
-
git-of-theseus-analyze = git_of_theseus.analyze:analyze_cmdline
|
|
3
|
-
git-of-theseus-line-plot = git_of_theseus:line_plot_cmdline
|
|
4
|
-
git-of-theseus-stack-plot = git_of_theseus:stack_plot_cmdline
|
|
5
|
-
git-of-theseus-survival-plot = git_of_theseus:survival_plot_cmdline
|
|
6
|
-
git-of-theseus-visualize = git_of_theseus.cmd:main
|
|
File without changes
|
|
File without changes
|
|
File without changes
|
|
File without changes
|
|
File without changes
|
|
File without changes
|
|
File without changes
|
|
File without changes
|
|
File without changes
|
|
File without changes
|
|
File without changes
|
|
File without changes
|