airflow-pytest-plugin 0.3.2__tar.gz → 0.5.0__tar.gz
This diff represents the content of publicly available package versions that have been released to one of the supported registries. The information contained in this diff is provided for informational purposes only and reflects changes between package versions as they appear in their respective public registries.
- {airflow_pytest_plugin-0.3.2 → airflow_pytest_plugin-0.5.0}/PKG-INFO +67 -5
- {airflow_pytest_plugin-0.3.2 → airflow_pytest_plugin-0.5.0}/README.md +61 -4
- {airflow_pytest_plugin-0.3.2 → airflow_pytest_plugin-0.5.0}/pyproject.toml +18 -1
- {airflow_pytest_plugin-0.3.2 → airflow_pytest_plugin-0.5.0}/src/airflow_pytest_plugin/config.py +58 -0
- {airflow_pytest_plugin-0.3.2 → airflow_pytest_plugin-0.5.0}/src/airflow_pytest_plugin/producer/archiving_parser.py +4 -1
- {airflow_pytest_plugin-0.3.2 → airflow_pytest_plugin-0.5.0}/src/airflow_pytest_plugin/sources/filesystem.py +53 -13
- {airflow_pytest_plugin-0.3.2 → airflow_pytest_plugin-0.5.0}/src/airflow_pytest_plugin/web/app.py +6 -1
- airflow_pytest_plugin-0.5.0/src/airflow_pytest_plugin/web/routes/failures.py +281 -0
- {airflow_pytest_plugin-0.3.2 → airflow_pytest_plugin-0.5.0}/src/airflow_pytest_plugin/web/routes/flaky.py +15 -2
- airflow_pytest_plugin-0.5.0/src/airflow_pytest_plugin/web/routes/monitoring.py +324 -0
- airflow_pytest_plugin-0.5.0/src/airflow_pytest_plugin/web/routes/reports.py +754 -0
- {airflow_pytest_plugin-0.3.2 → airflow_pytest_plugin-0.5.0}/src/airflow_pytest_plugin/web/templates.py +1482 -150
- {airflow_pytest_plugin-0.3.2 → airflow_pytest_plugin-0.5.0}/tests/conftest.py +7 -0
- {airflow_pytest_plugin-0.3.2 → airflow_pytest_plugin-0.5.0}/tests/test_config.py +27 -0
- {airflow_pytest_plugin-0.3.2 → airflow_pytest_plugin-0.5.0}/tests/test_filesystem_source.py +77 -0
- airflow_pytest_plugin-0.5.0/tests/test_heatmap.py +149 -0
- airflow_pytest_plugin-0.5.0/tests/test_metrics.py +283 -0
- {airflow_pytest_plugin-0.3.2 → airflow_pytest_plugin-0.5.0}/tests/test_web_app.py +541 -9
- airflow_pytest_plugin-0.5.0/tests/ui/README.md +52 -0
- airflow_pytest_plugin-0.5.0/tests/ui/conftest.py +443 -0
- airflow_pytest_plugin-0.5.0/tests/ui/test_ui_airflow.py +63 -0
- airflow_pytest_plugin-0.5.0/tests/ui/test_ui_heatmap.py +263 -0
- airflow_pytest_plugin-0.5.0/tests/ui/test_ui_regression.py +505 -0
- airflow_pytest_plugin-0.5.0/tests/ui/test_ui_scale.py +118 -0
- airflow_pytest_plugin-0.3.2/src/airflow_pytest_plugin/web/routes/failures.py +0 -109
- airflow_pytest_plugin-0.3.2/src/airflow_pytest_plugin/web/routes/monitoring.py +0 -92
- airflow_pytest_plugin-0.3.2/src/airflow_pytest_plugin/web/routes/reports.py +0 -392
- {airflow_pytest_plugin-0.3.2 → airflow_pytest_plugin-0.5.0}/.gitignore +0 -0
- {airflow_pytest_plugin-0.3.2 → airflow_pytest_plugin-0.5.0}/LICENSE +0 -0
- {airflow_pytest_plugin-0.3.2 → airflow_pytest_plugin-0.5.0}/examples/example_dag.py +0 -0
- {airflow_pytest_plugin-0.3.2 → airflow_pytest_plugin-0.5.0}/src/airflow_pytest_plugin/__init__.py +0 -0
- {airflow_pytest_plugin-0.3.2 → airflow_pytest_plugin-0.5.0}/src/airflow_pytest_plugin/compat/__init__.py +0 -0
- {airflow_pytest_plugin-0.3.2 → airflow_pytest_plugin-0.5.0}/src/airflow_pytest_plugin/compat/airflow.py +0 -0
- {airflow_pytest_plugin-0.3.2 → airflow_pytest_plugin-0.5.0}/src/airflow_pytest_plugin/layout.py +0 -0
- {airflow_pytest_plugin-0.3.2 → airflow_pytest_plugin-0.5.0}/src/airflow_pytest_plugin/models.py +0 -0
- {airflow_pytest_plugin-0.3.2 → airflow_pytest_plugin-0.5.0}/src/airflow_pytest_plugin/plugin.py +0 -0
- {airflow_pytest_plugin-0.3.2 → airflow_pytest_plugin-0.5.0}/src/airflow_pytest_plugin/producer/__init__.py +0 -0
- {airflow_pytest_plugin-0.3.2 → airflow_pytest_plugin-0.5.0}/src/airflow_pytest_plugin/retention.py +0 -0
- {airflow_pytest_plugin-0.3.2 → airflow_pytest_plugin-0.5.0}/src/airflow_pytest_plugin/sources/__init__.py +0 -0
- {airflow_pytest_plugin-0.3.2 → airflow_pytest_plugin-0.5.0}/src/airflow_pytest_plugin/sources/base.py +0 -0
- {airflow_pytest_plugin-0.3.2 → airflow_pytest_plugin-0.5.0}/src/airflow_pytest_plugin/version.py +0 -0
- {airflow_pytest_plugin-0.3.2 → airflow_pytest_plugin-0.5.0}/src/airflow_pytest_plugin/web/__init__.py +0 -0
- {airflow_pytest_plugin-0.3.2 → airflow_pytest_plugin-0.5.0}/src/airflow_pytest_plugin/web/__main__.py +0 -0
- {airflow_pytest_plugin-0.3.2 → airflow_pytest_plugin-0.5.0}/src/airflow_pytest_plugin/web/routes/__init__.py +0 -0
- {airflow_pytest_plugin-0.3.2 → airflow_pytest_plugin-0.5.0}/src/airflow_pytest_plugin/web/routes/common.py +0 -0
- {airflow_pytest_plugin-0.3.2 → airflow_pytest_plugin-0.5.0}/src/airflow_pytest_plugin/web/routes/compare.py +0 -0
- {airflow_pytest_plugin-0.3.2 → airflow_pytest_plugin-0.5.0}/tests/test_archiving_parser.py +0 -0
- {airflow_pytest_plugin-0.3.2 → airflow_pytest_plugin-0.5.0}/tests/test_authz_integration.py +0 -0
- {airflow_pytest_plugin-0.3.2 → airflow_pytest_plugin-0.5.0}/tests/test_compat.py +0 -0
- {airflow_pytest_plugin-0.3.2 → airflow_pytest_plugin-0.5.0}/tests/test_layout.py +0 -0
- {airflow_pytest_plugin-0.3.2 → airflow_pytest_plugin-0.5.0}/tests/test_models.py +0 -0
- {airflow_pytest_plugin-0.3.2 → airflow_pytest_plugin-0.5.0}/tests/test_package.py +0 -0
- {airflow_pytest_plugin-0.3.2 → airflow_pytest_plugin-0.5.0}/tests/test_plugin.py +0 -0
- {airflow_pytest_plugin-0.3.2 → airflow_pytest_plugin-0.5.0}/tests/test_retention.py +0 -0
- {airflow_pytest_plugin-0.3.2 → airflow_pytest_plugin-0.5.0}/tests/test_version.py +0 -0
|
@@ -1,6 +1,6 @@
|
|
|
1
1
|
Metadata-Version: 2.4
|
|
2
2
|
Name: airflow-pytest-plugin
|
|
3
|
-
Version: 0.
|
|
3
|
+
Version: 0.5.0
|
|
4
4
|
Summary: View airflow-pytest-operator results in the Airflow 3 web UI.
|
|
5
5
|
Project-URL: Homepage, https://github.com/IKrysanov/airflow-pytest-plugin
|
|
6
6
|
Project-URL: Repository, https://github.com/IKrysanov/airflow-pytest-plugin
|
|
@@ -37,6 +37,11 @@ Requires-Dist: pytest>=7.0; extra == 'dev'
|
|
|
37
37
|
Requires-Dist: ruff>=0.4; extra == 'dev'
|
|
38
38
|
Provides-Extra: secure-xml
|
|
39
39
|
Requires-Dist: defusedxml>=0.7; extra == 'secure-xml'
|
|
40
|
+
Provides-Extra: ui-test
|
|
41
|
+
Requires-Dist: fastapi>=0.110; extra == 'ui-test'
|
|
42
|
+
Requires-Dist: pytest-playwright>=0.5; extra == 'ui-test'
|
|
43
|
+
Requires-Dist: pytest>=7.0; extra == 'ui-test'
|
|
44
|
+
Requires-Dist: uvicorn>=0.23; extra == 'ui-test'
|
|
40
45
|
Provides-Extra: web
|
|
41
46
|
Requires-Dist: fastapi>=0.110; extra == 'web'
|
|
42
47
|
Requires-Dist: uvicorn>=0.23; extra == 'web'
|
|
@@ -91,6 +96,7 @@ It has two halves that share one on-disk layout:
|
|
|
91
96
|
- [HTTP API](#http-api)
|
|
92
97
|
- [Access control (RBAC)](#access-control-rbac)
|
|
93
98
|
- [Configuration](#configuration)
|
|
99
|
+
- [Prometheus metrics](#prometheus-metrics)
|
|
94
100
|
- [Architecture (SOLID)](#architecture-solid)
|
|
95
101
|
- [Development](#development)
|
|
96
102
|
- [License](#license)
|
|
@@ -124,9 +130,30 @@ run; expanding a case offers its full **history**:
|
|
|
124
130
|
|
|
125
131
|
|
|
126
132
|
|
|
133
|
+
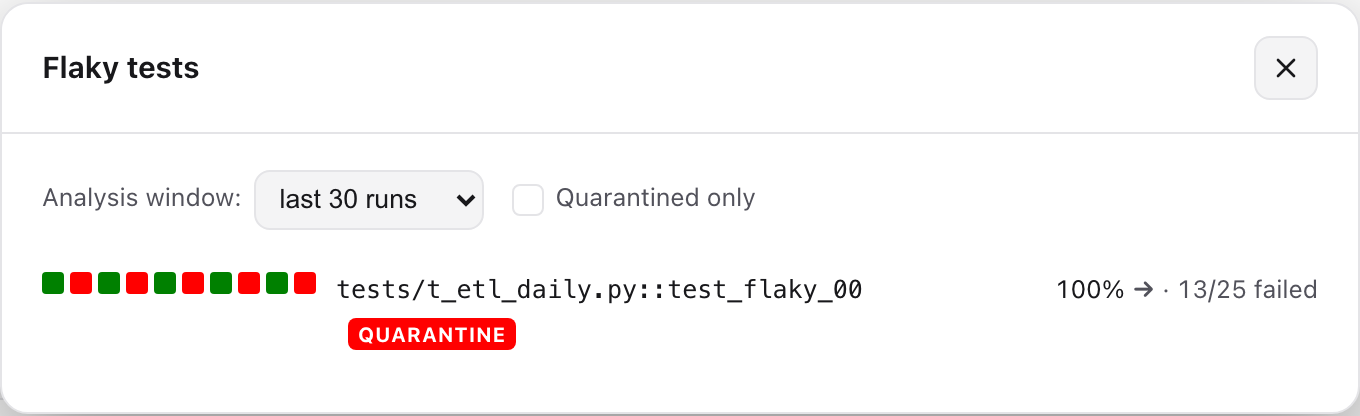
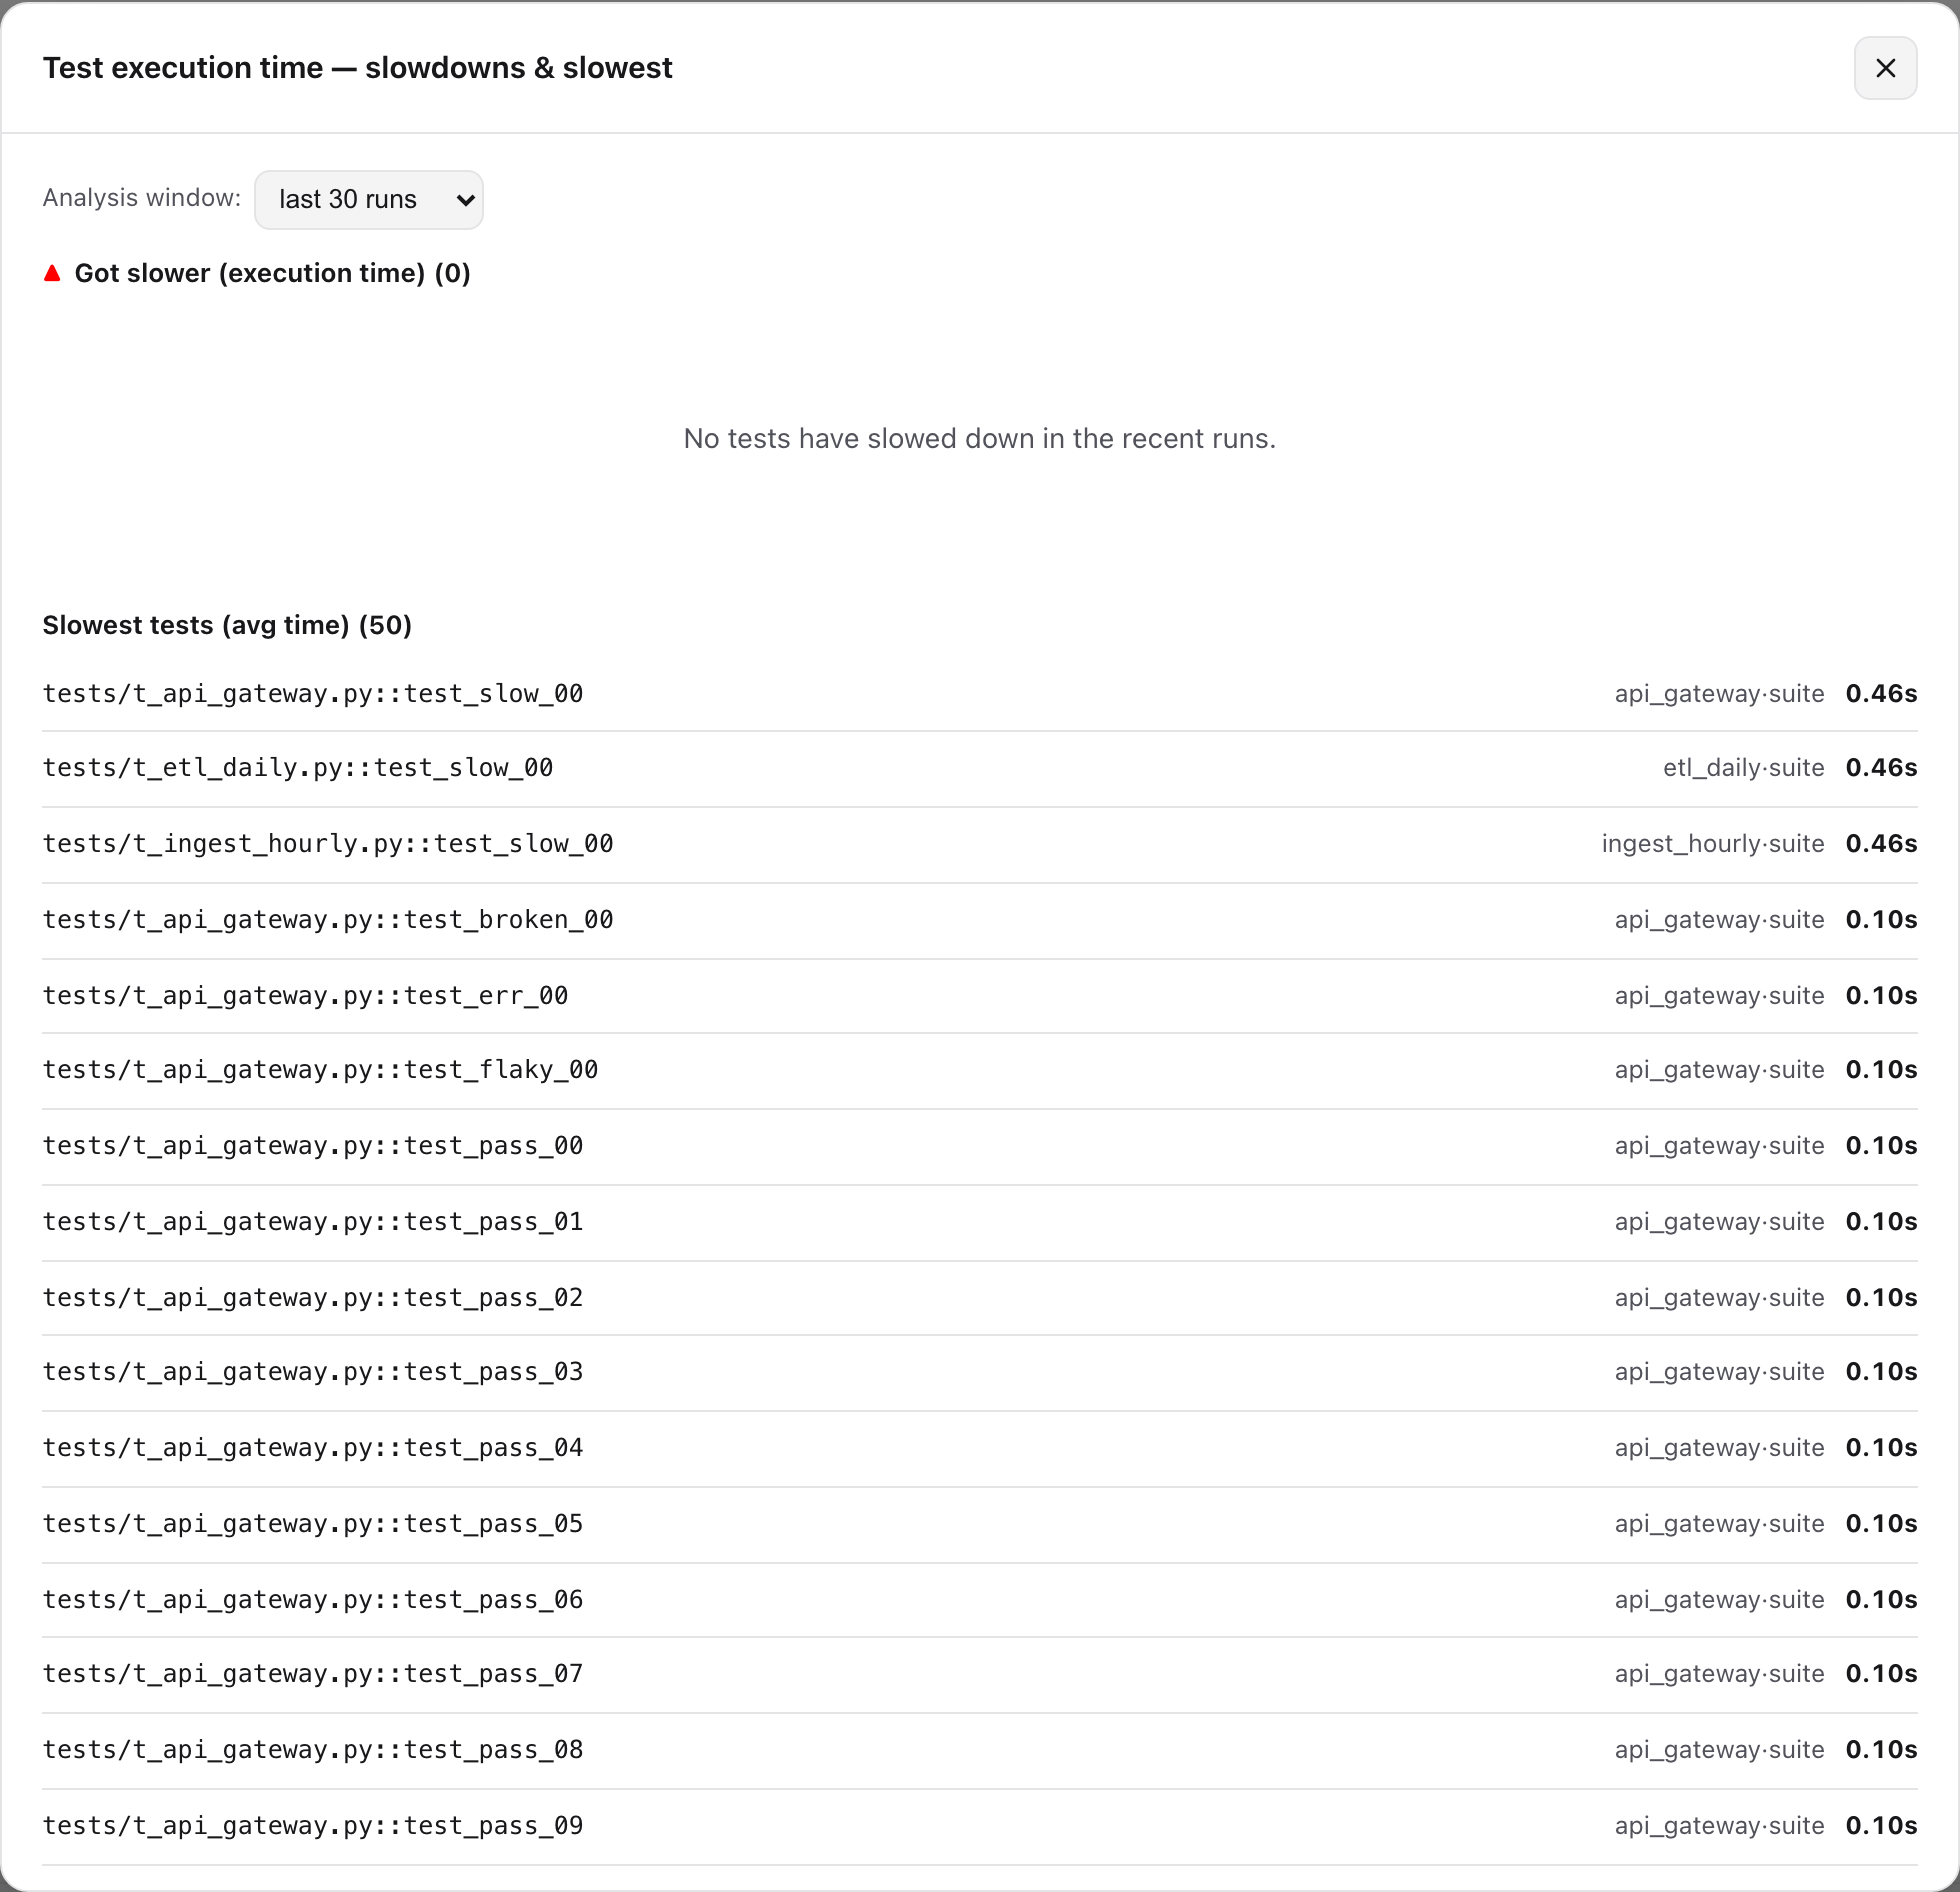
**Slow tests & duration regressions** — the *Slowdowns* KPI opens a panel of tests
|
|
134
|
+
whose **execution time got slower** (recent-half average vs the older half, over a
|
|
135
|
+
configurable window) alongside the **slowest tests** by average duration. A test
|
|
136
|
+
that speeds back up drops off the list. Inside a run, the case table sorts by
|
|
137
|
+
execution time (slowest first) so the heaviest tests surface immediately.
|
|
138
|
+
|
|
139
|
+
|
|
140
|
+
|
|
141
|
+
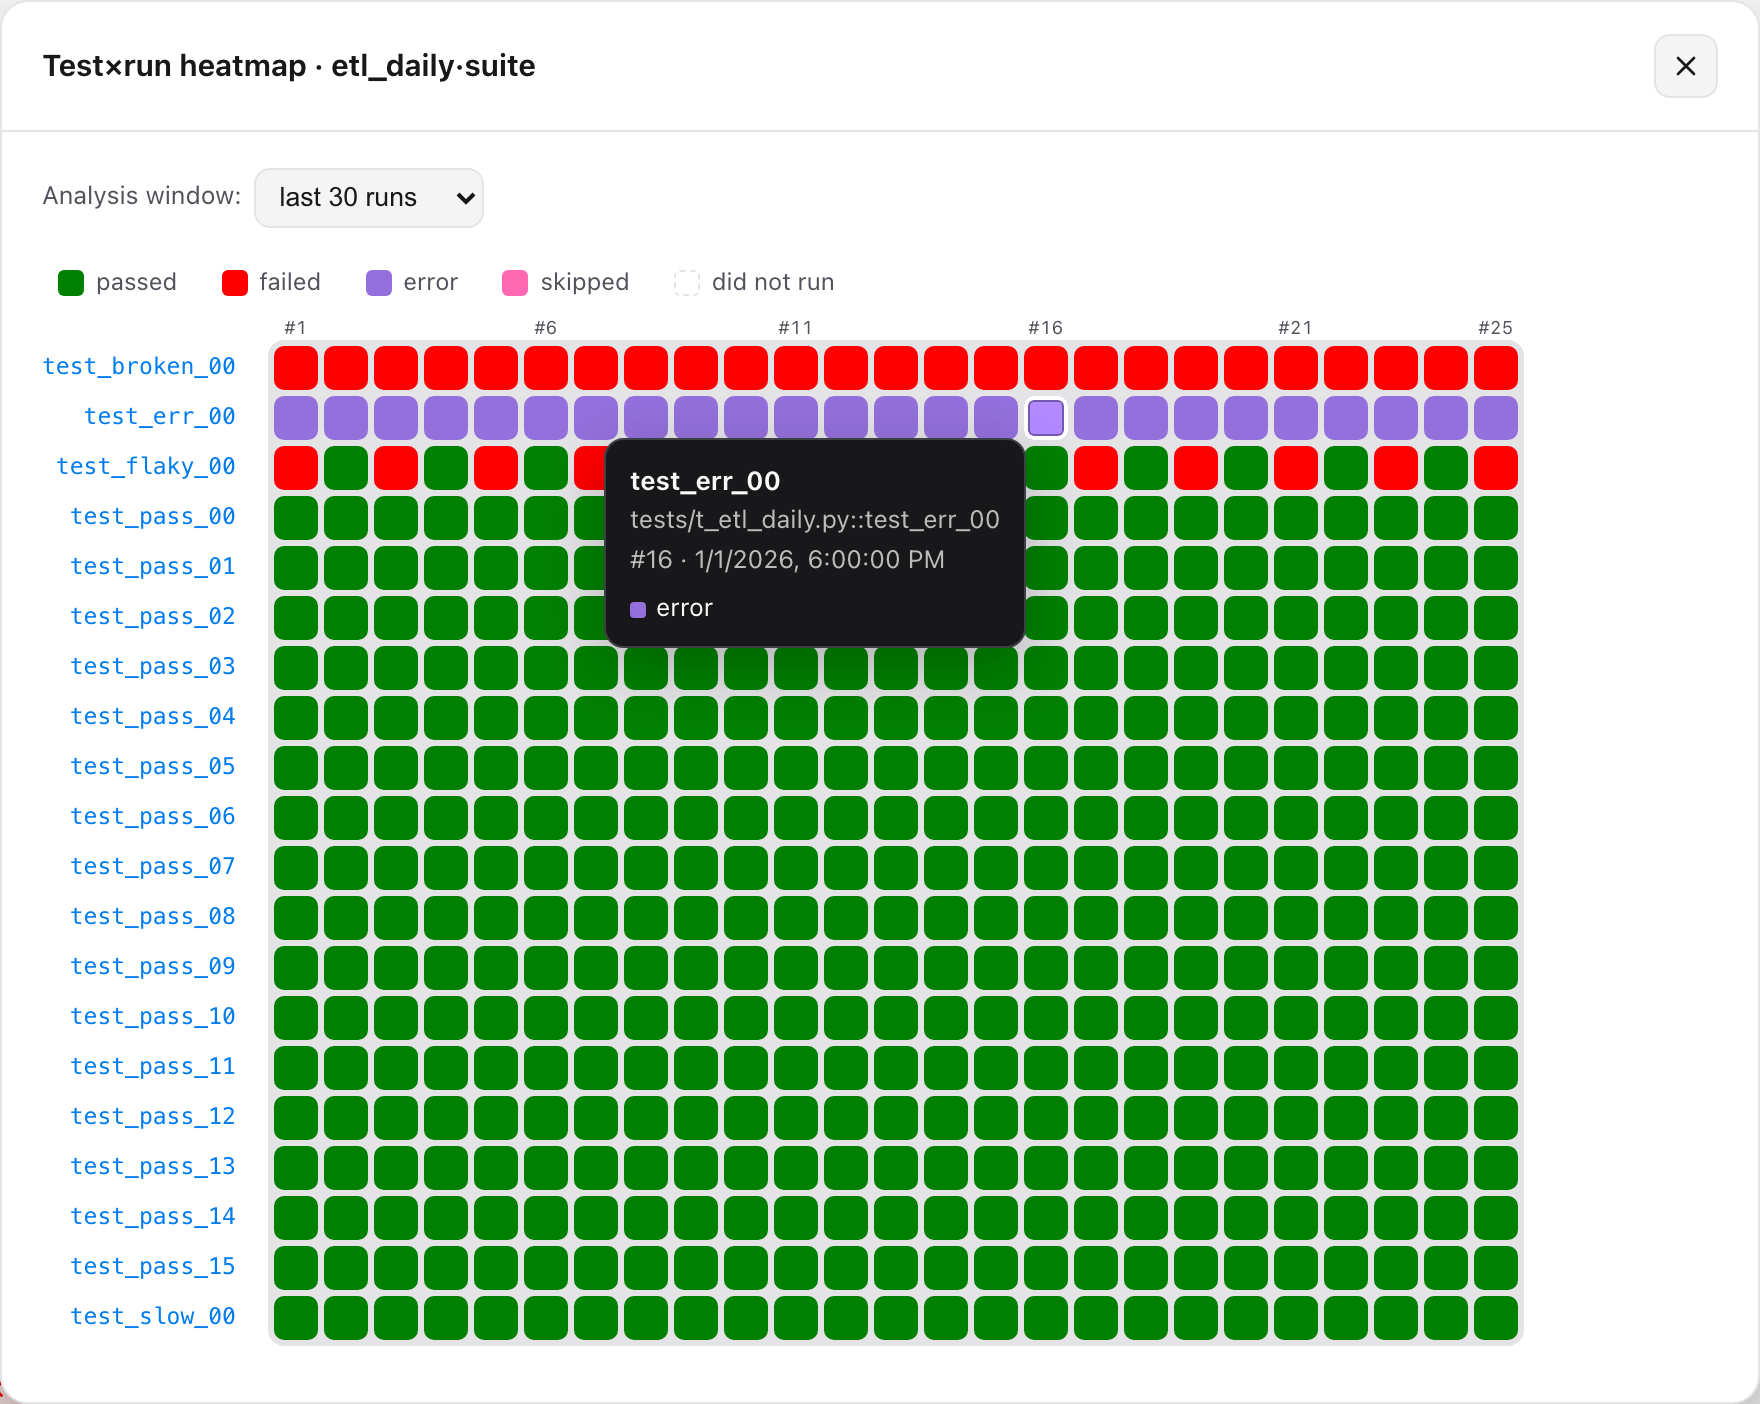
**Test×run heatmap** — the *Heatmap* button on a dag·task group (or a run's toolbar)
|
|
142
|
+
opens a matrix of **tests (rows) × recent runs (columns)**, each cell coloured by that
|
|
143
|
+
test's outcome (`did not run` is an empty dashed cell). Flaky tests read as alternating
|
|
144
|
+
rows, a regression as a block of failures filling in on the right, and a run that broke
|
|
145
|
+
the build as a red/error **column** — all at a glance. Rows sort most-broken first; click
|
|
146
|
+
a cell to open that run, or a test name to open its history.
|
|
147
|
+
|
|
148
|
+
|
|
149
|
+
|
|
127
150
|
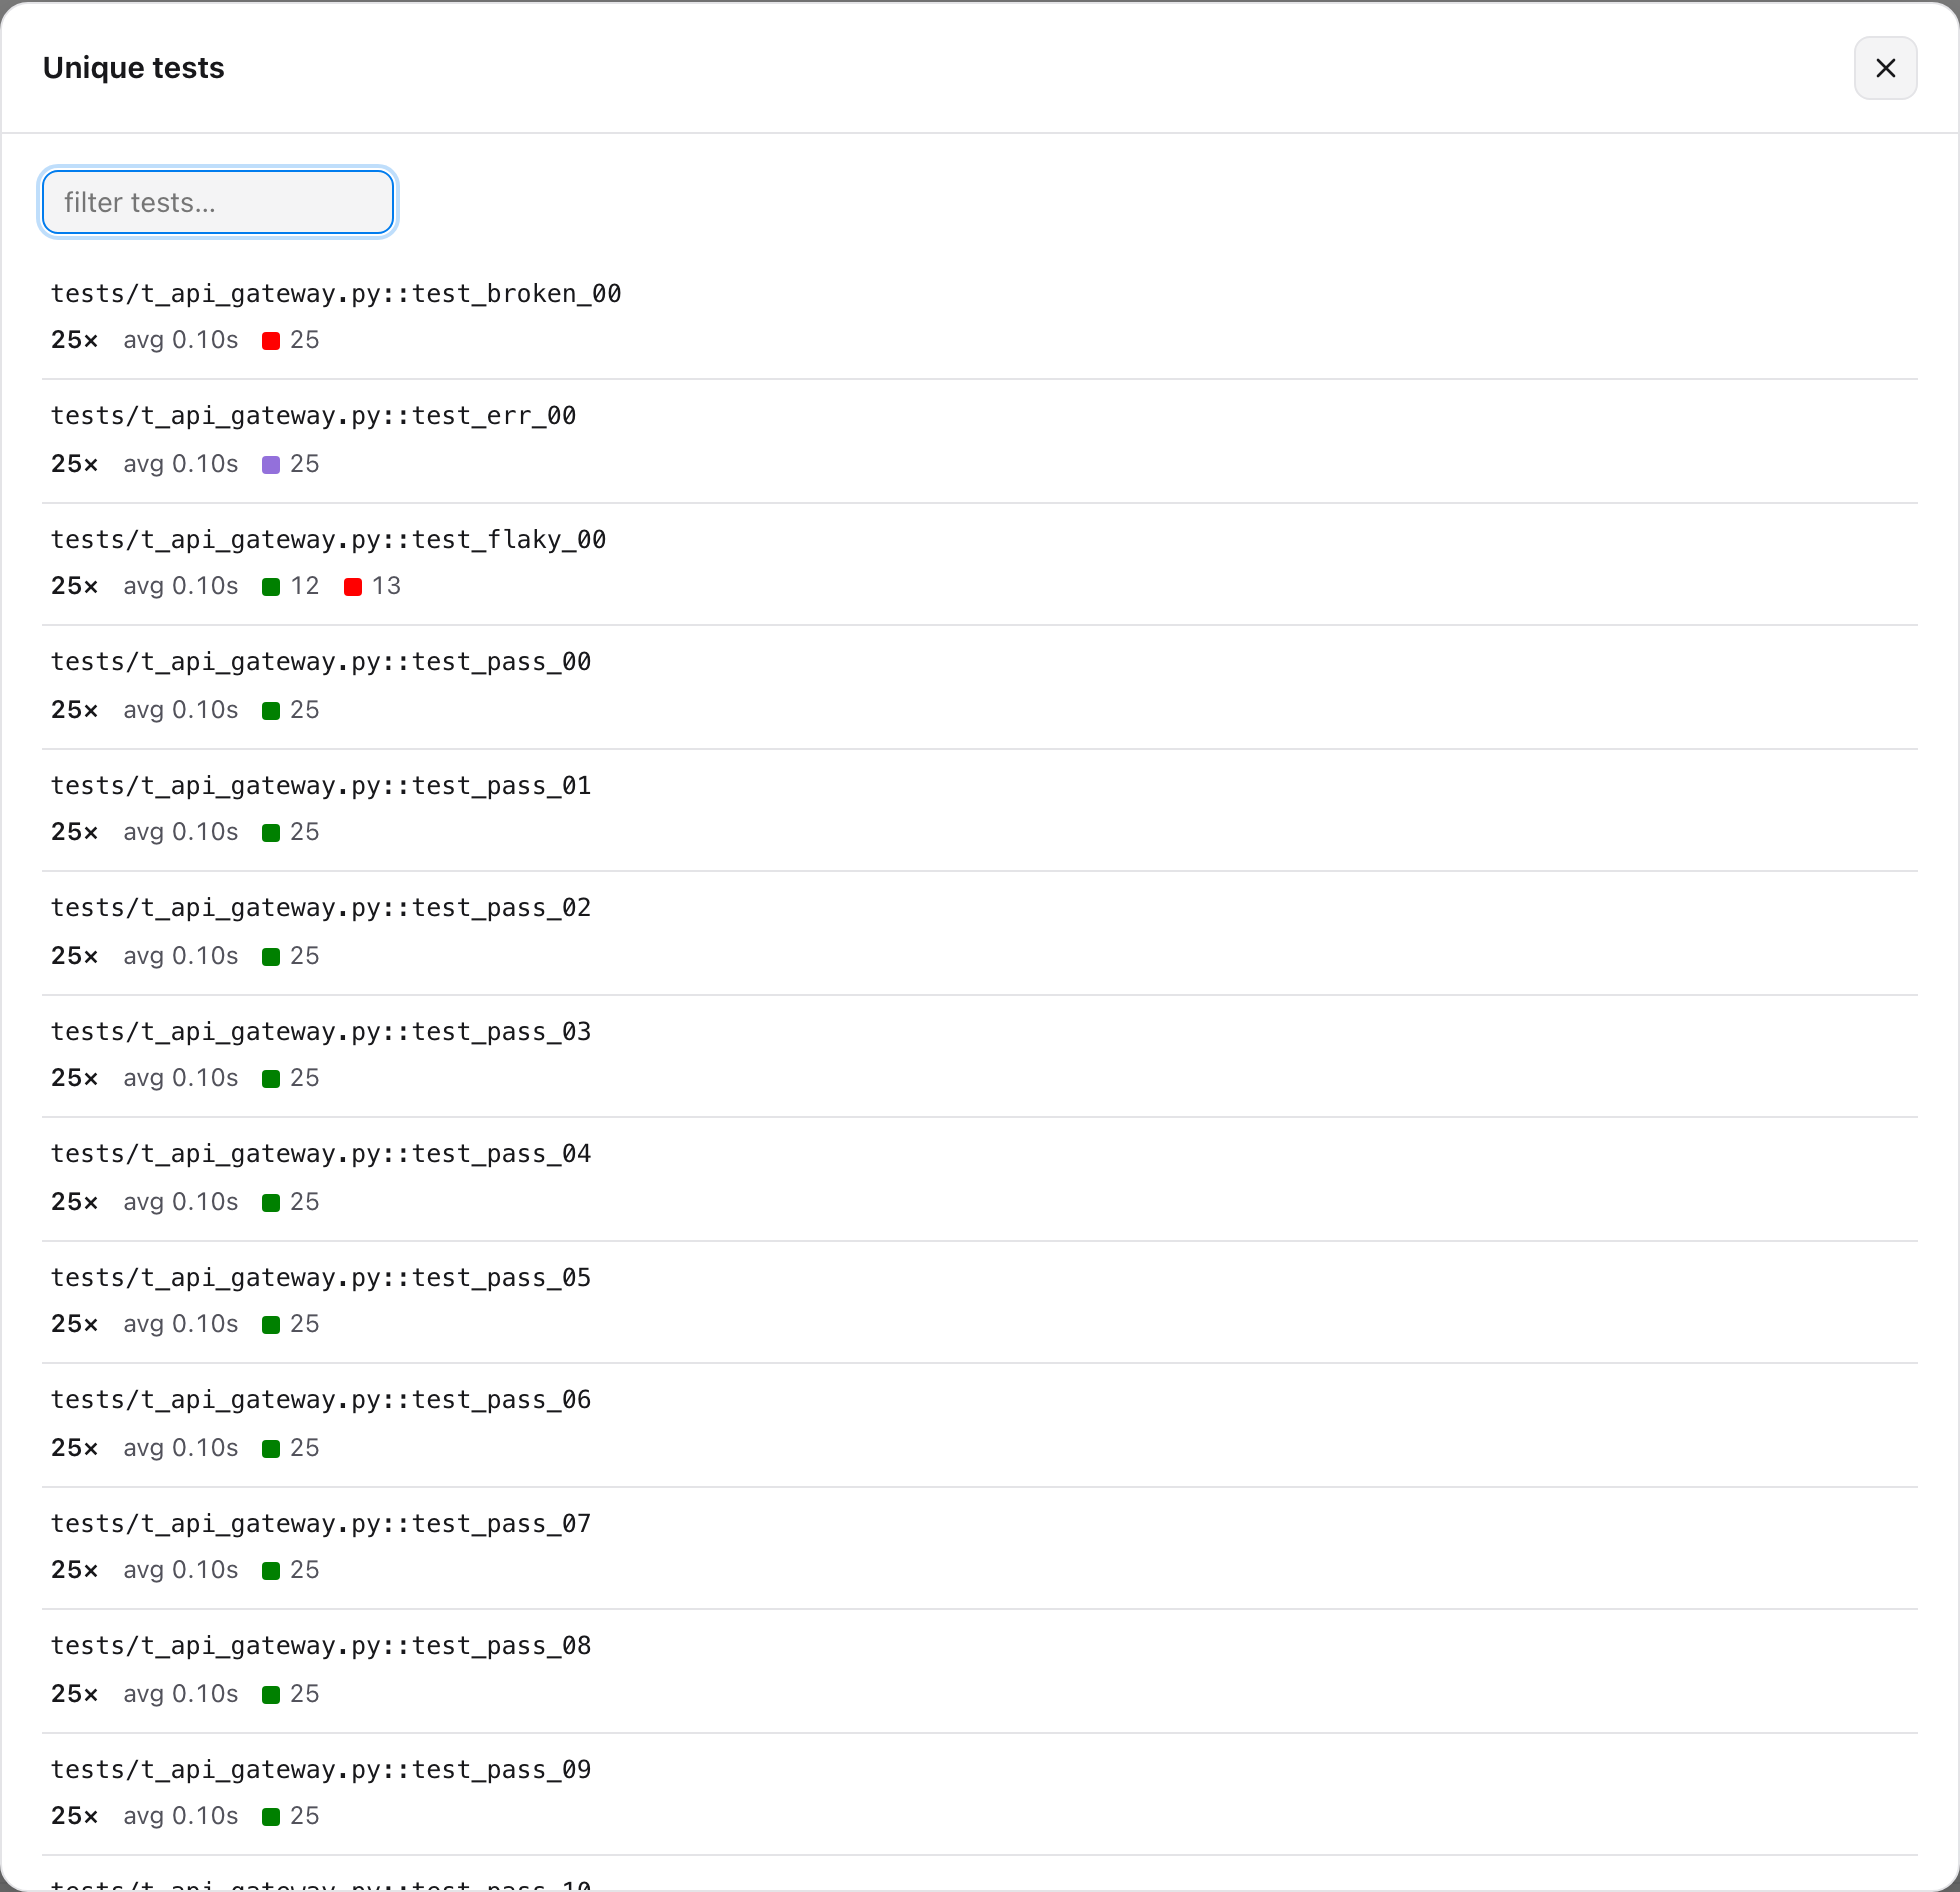
**Unique tests & failures** — the *Unique tests* KPI opens the searchable,
|
|
128
|
-
paginated catalogue of every distinct test
|
|
129
|
-
|
|
151
|
+
paginated catalogue of every distinct test (each with its runs / pass-fail-error-skip
|
|
152
|
+
counts / average time); the *Failures* KPI shows what's broken **now** — failures in each
|
|
153
|
+
dag·task's latest run, so the count shrinks as tests are fixed — grouped into **clusters
|
|
154
|
+
by normalized error** (biggest first) so common root causes surface instead of
|
|
155
|
+
per-failure spam. Expand a cluster to its tests, or open the same clusters scoped to one
|
|
156
|
+
run via the detail's *Error clusters* button:
|
|
130
157
|
|
|
131
158
|
|
|
132
159
|
|
|
@@ -234,15 +261,19 @@ runtime. Endpoints (relative to the mount):
|
|
|
234
261
|
| `GET /api/reports?dag_id=&run_id=` | summaries, newest first |
|
|
235
262
|
| `GET /api/reports/{report_id}` | one report with per-case rows |
|
|
236
263
|
| `GET /api/groups?dag_id=&task_id=` | runs aggregated by dag·task (count, pass-rate, avg duration, last status) |
|
|
237
|
-
| `GET /api/failures?dag_id=&run_id=&task_id=` | failed/errored cases
|
|
264
|
+
| `GET /api/failures?dag_id=&run_id=&task_id=&latest=` | failed/errored cases — each dag·task's latest run by default (`latest=0` for full history) |
|
|
265
|
+
| `GET /api/failure-clusters?dag_id=&run_id=&task_id=&latest=` | failures grouped by normalized error signature (biggest first); latest-run-only by default |
|
|
238
266
|
| `GET /api/compare?base=&head=` | per-test diff between two runs (newly failed / fixed / …) |
|
|
239
267
|
| `GET /api/flaky?dag_id=&task_id=&window=` | flaky tests with score, trend, and a quarantine flag |
|
|
268
|
+
| `GET /api/slow?dag_id=&task_id=&window=` | duration regressions (tests whose execution time got slower) + the slowest tests by average |
|
|
269
|
+
| `GET /api/heatmap?dag_id=&task_id=&window=` | test×run outcome matrix for one dag·task (rows = tests sorted most-broken first, cells = `p`/`f`/`e`/`s`/`-` aligned to recent runs) |
|
|
240
270
|
| `GET /api/test-history?dag_id=&task_id=&node_id=&limit=` | one test's outcome per run |
|
|
241
|
-
| `GET /api/unique-tests?dag_id=&task_id=&run_id=&full=` | distinct test count (+
|
|
271
|
+
| `GET /api/unique-tests?dag_id=&task_id=&run_id=&full=` | distinct test count (+ when `full`, each test's runs / passed / failed / errors / skipped / avg duration) |
|
|
242
272
|
| `DELETE /api/reports/{report_id}` | delete a report (RBAC-gated) |
|
|
243
273
|
| `GET /api/reports/{report_id}/allure.zip` | raw Allure results as a zip (if any) |
|
|
244
274
|
| `GET /api/health` | liveness + readiness: `status`, `ready`, `reports_root`(+`_exists`), `auth`, `secure_xml` |
|
|
245
275
|
| `GET /api/version` | `{"name": ..., "version": ...}` from package metadata |
|
|
276
|
+
| `GET /api/metrics` | Prometheus exposition — opt-in, bearer-token (see [Prometheus metrics](#prometheus-metrics)) |
|
|
246
277
|
| `GET /api/docs` | OpenAPI docs (Swagger UI) |
|
|
247
278
|
|
|
248
279
|
The reads (`GET`) and the delete are gated by Airflow RBAC — see below.
|
|
@@ -308,7 +339,10 @@ Download them from a report's detail view, or `GET
|
|
|
308
339
|
| `AIRFLOW_PYTEST_FLAKY_WINDOW` (env/cfg) | `30` | default recent runs the flaky detector scans |
|
|
309
340
|
| `AIRFLOW_PYTEST_FLAKY_QUARANTINE_SCORE` (env/cfg) | `0.5` | flakiness score (0–1) that flags a test for quarantine |
|
|
310
341
|
| `AIRFLOW_PYTEST_FLAKY_MIN_SCORE` (env/cfg) | `0.1` | flakiness score (0–1) below which a test is not counted as flaky |
|
|
342
|
+
| `AIRFLOW_PYTEST_SLOW_FACTOR` (env/cfg) | `1.3` | how much slower (recent-half avg ÷ older half, ≥1) a test must get to count as a duration regression |
|
|
343
|
+
| `AIRFLOW_PYTEST_SLOW_MIN_DELTA` (env/cfg) | `0.5` | minimum absolute slowdown in seconds for a regression to register (filters jittery fast tests) |
|
|
311
344
|
| `AIRFLOW_PYTEST_SUCCESS_THRESHOLD` (env/cfg) | `0.85` | pass-rate (0–1) over executed tests at/above which a run counts as successful (*Passing runs*); `1.0` = strict, zero failures/errors |
|
|
345
|
+
| `AIRFLOW_PYTEST_METRICS_TOKEN` (env/cfg) | — | bearer token that **enables** the Prometheus `/api/metrics` endpoint; unset = disabled (see [below](#prometheus-metrics)) |
|
|
312
346
|
|
|
313
347
|
**Enable / disable the reader.** Set `AIRFLOW_PYTEST_PLUGIN_ENABLE` to a falsey
|
|
314
348
|
value (`0`, `false`, `no`, `off`) to stop the plugin registering its UI and API
|
|
@@ -328,6 +362,34 @@ single scan for `AIRFLOW_PYTEST_SCAN_CACHE_TTL` seconds (default `2.0`; deletes
|
|
|
328
362
|
invalidate it immediately). New runs therefore appear within a couple of seconds (or
|
|
329
363
|
on **Refresh**); set it to `0` for no caching, or higher on a very large tree.
|
|
330
364
|
|
|
365
|
+
## Prometheus metrics
|
|
366
|
+
|
|
367
|
+
`GET /api/metrics` exposes per-dag·task gauges (from each dag·task's **latest** run)
|
|
368
|
+
in the Prometheus text format — `airflow_pytest_latest_{passed,failed,errors,skipped,
|
|
369
|
+
tests,pass_ratio,duration_seconds,success,run_timestamp_seconds}{dag_id,task_id}` and
|
|
370
|
+
`airflow_pytest_dagtask_runs{dag_id,task_id}`, plus globals
|
|
371
|
+
`airflow_pytest_{up,runs,dagtasks,latest_failures,series_truncated,build_info}` (all gauges).
|
|
372
|
+
|
|
373
|
+
It's **disabled by default** and turns on only when you set a scrape token; requests must
|
|
374
|
+
then present it as a bearer token (constant-time compared). The scrape is cheap and
|
|
375
|
+
bounded — one cached directory scan, summary-derived (no per-run reads), capped at 2000
|
|
376
|
+
series — so it's safe to poll frequently.
|
|
377
|
+
|
|
378
|
+
```bash
|
|
379
|
+
export AIRFLOW_PYTEST_METRICS_TOKEN="$(openssl rand -hex 16)"
|
|
380
|
+
```
|
|
381
|
+
|
|
382
|
+
```yaml
|
|
383
|
+
# prometheus.yml
|
|
384
|
+
scrape_configs:
|
|
385
|
+
- job_name: airflow-pytest
|
|
386
|
+
metrics_path: /pytest-reports/api/metrics # the plugin's mount prefix
|
|
387
|
+
authorization:
|
|
388
|
+
credentials: "<AIRFLOW_PYTEST_METRICS_TOKEN>"
|
|
389
|
+
static_configs:
|
|
390
|
+
- targets: ["airflow-apiserver:8080"]
|
|
391
|
+
```
|
|
392
|
+
|
|
331
393
|
## Retention (auto-cleanup)
|
|
332
394
|
|
|
333
395
|
Reports accumulate forever unless you prune them. Set any of the
|
|
@@ -47,6 +47,7 @@ It has two halves that share one on-disk layout:
|
|
|
47
47
|
- [HTTP API](#http-api)
|
|
48
48
|
- [Access control (RBAC)](#access-control-rbac)
|
|
49
49
|
- [Configuration](#configuration)
|
|
50
|
+
- [Prometheus metrics](#prometheus-metrics)
|
|
50
51
|
- [Architecture (SOLID)](#architecture-solid)
|
|
51
52
|
- [Development](#development)
|
|
52
53
|
- [License](#license)
|
|
@@ -80,9 +81,30 @@ run; expanding a case offers its full **history**:
|
|
|
80
81
|
|
|
81
82
|

|
|
82
83
|
|
|
84
|
+
**Slow tests & duration regressions** — the *Slowdowns* KPI opens a panel of tests
|
|
85
|
+
whose **execution time got slower** (recent-half average vs the older half, over a
|
|
86
|
+
configurable window) alongside the **slowest tests** by average duration. A test
|
|
87
|
+
that speeds back up drops off the list. Inside a run, the case table sorts by
|
|
88
|
+
execution time (slowest first) so the heaviest tests surface immediately.
|
|
89
|
+
|
|
90
|
+

|
|
91
|
+
|
|
92
|
+
**Test×run heatmap** — the *Heatmap* button on a dag·task group (or a run's toolbar)
|
|
93
|
+
opens a matrix of **tests (rows) × recent runs (columns)**, each cell coloured by that
|
|
94
|
+
test's outcome (`did not run` is an empty dashed cell). Flaky tests read as alternating
|
|
95
|
+
rows, a regression as a block of failures filling in on the right, and a run that broke
|
|
96
|
+
the build as a red/error **column** — all at a glance. Rows sort most-broken first; click
|
|
97
|
+
a cell to open that run, or a test name to open its history.
|
|
98
|
+
|
|
99
|
+

|
|
100
|
+
|
|
83
101
|
**Unique tests & failures** — the *Unique tests* KPI opens the searchable,
|
|
84
|
-
paginated catalogue of every distinct test
|
|
85
|
-
|
|
102
|
+
paginated catalogue of every distinct test (each with its runs / pass-fail-error-skip
|
|
103
|
+
counts / average time); the *Failures* KPI shows what's broken **now** — failures in each
|
|
104
|
+
dag·task's latest run, so the count shrinks as tests are fixed — grouped into **clusters
|
|
105
|
+
by normalized error** (biggest first) so common root causes surface instead of
|
|
106
|
+
per-failure spam. Expand a cluster to its tests, or open the same clusters scoped to one
|
|
107
|
+
run via the detail's *Error clusters* button:
|
|
86
108
|
|
|
87
109
|

|
|
88
110
|
|
|
@@ -190,15 +212,19 @@ runtime. Endpoints (relative to the mount):
|
|
|
190
212
|
| `GET /api/reports?dag_id=&run_id=` | summaries, newest first |
|
|
191
213
|
| `GET /api/reports/{report_id}` | one report with per-case rows |
|
|
192
214
|
| `GET /api/groups?dag_id=&task_id=` | runs aggregated by dag·task (count, pass-rate, avg duration, last status) |
|
|
193
|
-
| `GET /api/failures?dag_id=&run_id=&task_id=` | failed/errored cases
|
|
215
|
+
| `GET /api/failures?dag_id=&run_id=&task_id=&latest=` | failed/errored cases — each dag·task's latest run by default (`latest=0` for full history) |
|
|
216
|
+
| `GET /api/failure-clusters?dag_id=&run_id=&task_id=&latest=` | failures grouped by normalized error signature (biggest first); latest-run-only by default |
|
|
194
217
|
| `GET /api/compare?base=&head=` | per-test diff between two runs (newly failed / fixed / …) |
|
|
195
218
|
| `GET /api/flaky?dag_id=&task_id=&window=` | flaky tests with score, trend, and a quarantine flag |
|
|
219
|
+
| `GET /api/slow?dag_id=&task_id=&window=` | duration regressions (tests whose execution time got slower) + the slowest tests by average |
|
|
220
|
+
| `GET /api/heatmap?dag_id=&task_id=&window=` | test×run outcome matrix for one dag·task (rows = tests sorted most-broken first, cells = `p`/`f`/`e`/`s`/`-` aligned to recent runs) |
|
|
196
221
|
| `GET /api/test-history?dag_id=&task_id=&node_id=&limit=` | one test's outcome per run |
|
|
197
|
-
| `GET /api/unique-tests?dag_id=&task_id=&run_id=&full=` | distinct test count (+
|
|
222
|
+
| `GET /api/unique-tests?dag_id=&task_id=&run_id=&full=` | distinct test count (+ when `full`, each test's runs / passed / failed / errors / skipped / avg duration) |
|
|
198
223
|
| `DELETE /api/reports/{report_id}` | delete a report (RBAC-gated) |
|
|
199
224
|
| `GET /api/reports/{report_id}/allure.zip` | raw Allure results as a zip (if any) |
|
|
200
225
|
| `GET /api/health` | liveness + readiness: `status`, `ready`, `reports_root`(+`_exists`), `auth`, `secure_xml` |
|
|
201
226
|
| `GET /api/version` | `{"name": ..., "version": ...}` from package metadata |
|
|
227
|
+
| `GET /api/metrics` | Prometheus exposition — opt-in, bearer-token (see [Prometheus metrics](#prometheus-metrics)) |
|
|
202
228
|
| `GET /api/docs` | OpenAPI docs (Swagger UI) |
|
|
203
229
|
|
|
204
230
|
The reads (`GET`) and the delete are gated by Airflow RBAC — see below.
|
|
@@ -264,7 +290,10 @@ Download them from a report's detail view, or `GET
|
|
|
264
290
|
| `AIRFLOW_PYTEST_FLAKY_WINDOW` (env/cfg) | `30` | default recent runs the flaky detector scans |
|
|
265
291
|
| `AIRFLOW_PYTEST_FLAKY_QUARANTINE_SCORE` (env/cfg) | `0.5` | flakiness score (0–1) that flags a test for quarantine |
|
|
266
292
|
| `AIRFLOW_PYTEST_FLAKY_MIN_SCORE` (env/cfg) | `0.1` | flakiness score (0–1) below which a test is not counted as flaky |
|
|
293
|
+
| `AIRFLOW_PYTEST_SLOW_FACTOR` (env/cfg) | `1.3` | how much slower (recent-half avg ÷ older half, ≥1) a test must get to count as a duration regression |
|
|
294
|
+
| `AIRFLOW_PYTEST_SLOW_MIN_DELTA` (env/cfg) | `0.5` | minimum absolute slowdown in seconds for a regression to register (filters jittery fast tests) |
|
|
267
295
|
| `AIRFLOW_PYTEST_SUCCESS_THRESHOLD` (env/cfg) | `0.85` | pass-rate (0–1) over executed tests at/above which a run counts as successful (*Passing runs*); `1.0` = strict, zero failures/errors |
|
|
296
|
+
| `AIRFLOW_PYTEST_METRICS_TOKEN` (env/cfg) | — | bearer token that **enables** the Prometheus `/api/metrics` endpoint; unset = disabled (see [below](#prometheus-metrics)) |
|
|
268
297
|
|
|
269
298
|
**Enable / disable the reader.** Set `AIRFLOW_PYTEST_PLUGIN_ENABLE` to a falsey
|
|
270
299
|
value (`0`, `false`, `no`, `off`) to stop the plugin registering its UI and API
|
|
@@ -284,6 +313,34 @@ single scan for `AIRFLOW_PYTEST_SCAN_CACHE_TTL` seconds (default `2.0`; deletes
|
|
|
284
313
|
invalidate it immediately). New runs therefore appear within a couple of seconds (or
|
|
285
314
|
on **Refresh**); set it to `0` for no caching, or higher on a very large tree.
|
|
286
315
|
|
|
316
|
+
## Prometheus metrics
|
|
317
|
+
|
|
318
|
+
`GET /api/metrics` exposes per-dag·task gauges (from each dag·task's **latest** run)
|
|
319
|
+
in the Prometheus text format — `airflow_pytest_latest_{passed,failed,errors,skipped,
|
|
320
|
+
tests,pass_ratio,duration_seconds,success,run_timestamp_seconds}{dag_id,task_id}` and
|
|
321
|
+
`airflow_pytest_dagtask_runs{dag_id,task_id}`, plus globals
|
|
322
|
+
`airflow_pytest_{up,runs,dagtasks,latest_failures,series_truncated,build_info}` (all gauges).
|
|
323
|
+
|
|
324
|
+
It's **disabled by default** and turns on only when you set a scrape token; requests must
|
|
325
|
+
then present it as a bearer token (constant-time compared). The scrape is cheap and
|
|
326
|
+
bounded — one cached directory scan, summary-derived (no per-run reads), capped at 2000
|
|
327
|
+
series — so it's safe to poll frequently.
|
|
328
|
+
|
|
329
|
+
```bash
|
|
330
|
+
export AIRFLOW_PYTEST_METRICS_TOKEN="$(openssl rand -hex 16)"
|
|
331
|
+
```
|
|
332
|
+
|
|
333
|
+
```yaml
|
|
334
|
+
# prometheus.yml
|
|
335
|
+
scrape_configs:
|
|
336
|
+
- job_name: airflow-pytest
|
|
337
|
+
metrics_path: /pytest-reports/api/metrics # the plugin's mount prefix
|
|
338
|
+
authorization:
|
|
339
|
+
credentials: "<AIRFLOW_PYTEST_METRICS_TOKEN>"
|
|
340
|
+
static_configs:
|
|
341
|
+
- targets: ["airflow-apiserver:8080"]
|
|
342
|
+
```
|
|
343
|
+
|
|
287
344
|
## Retention (auto-cleanup)
|
|
288
345
|
|
|
289
346
|
Reports accumulate forever unless you prune them. Set any of the
|
|
@@ -4,7 +4,7 @@ build-backend = "hatchling.build"
|
|
|
4
4
|
|
|
5
5
|
[project]
|
|
6
6
|
name = "airflow-pytest-plugin"
|
|
7
|
-
version = "0.
|
|
7
|
+
version = "0.5.0"
|
|
8
8
|
description = "View airflow-pytest-operator results in the Airflow 3 web UI."
|
|
9
9
|
readme = "README.md"
|
|
10
10
|
requires-python = ">=3.10"
|
|
@@ -60,6 +60,14 @@ dev = [
|
|
|
60
60
|
"mypy>=1.8",
|
|
61
61
|
"ruff>=0.4",
|
|
62
62
|
]
|
|
63
|
+
# Playwright UI regression suite (tests/ui, marker `ui`). Opt-in: heavy (real browser),
|
|
64
|
+
# run locally + in a dedicated CI job. After install: `playwright install chromium`.
|
|
65
|
+
ui-test = [
|
|
66
|
+
"pytest>=7.0",
|
|
67
|
+
"pytest-playwright>=0.5",
|
|
68
|
+
"fastapi>=0.110",
|
|
69
|
+
"uvicorn>=0.23", # the standalone dev server the UI tests drive
|
|
70
|
+
]
|
|
63
71
|
|
|
64
72
|
[project.urls]
|
|
65
73
|
Homepage = "https://github.com/IKrysanov/airflow-pytest-plugin"
|
|
@@ -83,6 +91,15 @@ include = ["src", "tests", "examples", "README.md", "LICENSE"]
|
|
|
83
91
|
[tool.pytest.ini_options]
|
|
84
92
|
testpaths = ["tests"]
|
|
85
93
|
pythonpath = ["src"]
|
|
94
|
+
# UI (Playwright) tests are opt-in and excluded by default so the unit suite stays fast
|
|
95
|
+
# and browser-free. Run them explicitly: `pytest -m ui` (standalone dev server) or
|
|
96
|
+
# `pytest -m ui_airflow` (embedded in a real Airflow api-server). Both need the
|
|
97
|
+
# `ui-test` extra + browsers; `ui_airflow` also needs Airflow installed.
|
|
98
|
+
addopts = ["-m", "not ui and not ui_airflow"]
|
|
99
|
+
markers = [
|
|
100
|
+
"ui: Playwright UI regression test (opt-in; needs the 'ui-test' extra + browsers)",
|
|
101
|
+
"ui_airflow: Playwright UI test against a real Airflow api-server with the plugin embedded",
|
|
102
|
+
]
|
|
86
103
|
|
|
87
104
|
[tool.coverage.run]
|
|
88
105
|
branch = true
|
{airflow_pytest_plugin-0.3.2 → airflow_pytest_plugin-0.5.0}/src/airflow_pytest_plugin/config.py
RENAMED
|
@@ -16,6 +16,7 @@
|
|
|
16
16
|
|
|
17
17
|
from __future__ import annotations
|
|
18
18
|
|
|
19
|
+
import math
|
|
19
20
|
import os
|
|
20
21
|
|
|
21
22
|
from .compat import get_conf_value
|
|
@@ -149,6 +150,49 @@ def get_flaky_min_score() -> float:
|
|
|
149
150
|
)
|
|
150
151
|
|
|
151
152
|
|
|
153
|
+
#: Duration-regression detector. A test is flagged "slower" when its recent-half
|
|
154
|
+
#: average duration is at least ``SLOW_FACTOR``× its older-half average AND the
|
|
155
|
+
#: absolute increase clears ``SLOW_MIN_DELTA`` seconds (the delta filters noise on
|
|
156
|
+
#: fast tests, where a tiny jitter can still beat the ratio). Shares the flaky window.
|
|
157
|
+
SLOW_FACTOR_ENV = "AIRFLOW_PYTEST_SLOW_FACTOR"
|
|
158
|
+
DEFAULT_SLOW_FACTOR = 1.3
|
|
159
|
+
SLOW_MIN_DELTA_ENV = "AIRFLOW_PYTEST_SLOW_MIN_DELTA"
|
|
160
|
+
DEFAULT_SLOW_MIN_DELTA = 0.5
|
|
161
|
+
|
|
162
|
+
|
|
163
|
+
def _positive_float_setting(
|
|
164
|
+
env_var: str, conf_key: str, default: float, *, minimum: float
|
|
165
|
+
) -> float:
|
|
166
|
+
"""A float ≥ ``minimum`` from env, then cfg; default on missing/invalid/below."""
|
|
167
|
+
raw = os.environ.get(env_var)
|
|
168
|
+
if raw is None or not raw.strip():
|
|
169
|
+
raw = get_conf_value(CONF_SECTION, conf_key)
|
|
170
|
+
if raw is None or not str(raw).strip():
|
|
171
|
+
return default
|
|
172
|
+
try:
|
|
173
|
+
value = float(str(raw).strip())
|
|
174
|
+
except ValueError:
|
|
175
|
+
return default
|
|
176
|
+
# Reject NaN/inf: they'd serialize to non-spec JSON ("NaN"/"Infinity") downstream.
|
|
177
|
+
if not math.isfinite(value):
|
|
178
|
+
return default
|
|
179
|
+
return value if value >= minimum else default
|
|
180
|
+
|
|
181
|
+
|
|
182
|
+
def get_slow_factor() -> float:
|
|
183
|
+
"""Multiplier a test's recent-half avg duration must reach to count as a regression."""
|
|
184
|
+
return _positive_float_setting(
|
|
185
|
+
SLOW_FACTOR_ENV, "slow_factor", DEFAULT_SLOW_FACTOR, minimum=1.0
|
|
186
|
+
)
|
|
187
|
+
|
|
188
|
+
|
|
189
|
+
def get_slow_min_delta() -> float:
|
|
190
|
+
"""Minimum absolute slowdown (seconds) for a duration regression to register."""
|
|
191
|
+
return _positive_float_setting(
|
|
192
|
+
SLOW_MIN_DELTA_ENV, "slow_min_delta", DEFAULT_SLOW_MIN_DELTA, minimum=0.0
|
|
193
|
+
)
|
|
194
|
+
|
|
195
|
+
|
|
152
196
|
#: Pass-rate (0–1) at/above which a run counts as successful ("Passing runs"). The
|
|
153
197
|
#: rate is over executed tests, so a run can carry a few failures and still pass.
|
|
154
198
|
#: At 1.0 a run is successful only with zero failures/errors (the strict default of
|
|
@@ -164,6 +208,20 @@ def get_success_threshold() -> float:
|
|
|
164
208
|
)
|
|
165
209
|
|
|
166
210
|
|
|
211
|
+
#: Opt-in bearer token for the Prometheus ``/api/metrics`` endpoint. Secure-by-default:
|
|
212
|
+
#: unset = the endpoint is DISABLED (404). When set, a scrape must send
|
|
213
|
+
#: ``Authorization: Bearer <token>``. Reads the env var, then the cfg key.
|
|
214
|
+
METRICS_TOKEN_ENV = "AIRFLOW_PYTEST_METRICS_TOKEN"
|
|
215
|
+
|
|
216
|
+
|
|
217
|
+
def get_metrics_token() -> str | None:
|
|
218
|
+
"""The metrics scrape token, or ``None`` when the endpoint should stay disabled."""
|
|
219
|
+
raw = os.environ.get(METRICS_TOKEN_ENV)
|
|
220
|
+
if raw is None or not raw.strip():
|
|
221
|
+
raw = get_conf_value(CONF_SECTION, "metrics_token")
|
|
222
|
+
return raw.strip() if raw and raw.strip() else None
|
|
223
|
+
|
|
224
|
+
|
|
167
225
|
def get_reports_root() -> str:
|
|
168
226
|
"""Resolve the report root directory (absolute path)."""
|
|
169
227
|
env = os.environ.get(ENV_VAR)
|
|
@@ -39,7 +39,10 @@ _log = logging.getLogger(__name__)
|
|
|
39
39
|
META_SCHEMA_VERSION = 1
|
|
40
40
|
|
|
41
41
|
|
|
42
|
-
|
|
42
|
+
# The operator base is typed as Any when the operator package ships without type info (some
|
|
43
|
+
# environments) and concretely typed in others -- so the misc subclass error only fires
|
|
44
|
+
# sometimes. Listing `unused-ignore` keeps this quiet whether or not misc fires.
|
|
45
|
+
class ArchivingResultParser(JUnitResultParser): # type: ignore[misc, unused-ignore]
|
|
43
46
|
"""Archives each run under the reports layout: the operator's JUnit result
|
|
44
47
|
plus (with ``allure=True``) the raw Allure results for TestOps export."""
|
|
45
48
|
|
|
@@ -19,6 +19,7 @@ from __future__ import annotations
|
|
|
19
19
|
import io
|
|
20
20
|
import json
|
|
21
21
|
import logging
|
|
22
|
+
import math
|
|
22
23
|
import os
|
|
23
24
|
import shutil
|
|
24
25
|
import threading
|
|
@@ -101,7 +102,17 @@ class FileSystemReportSource(ReportSource):
|
|
|
101
102
|
if summary is not None:
|
|
102
103
|
out.append(summary)
|
|
103
104
|
# Newest first: ISO-8601 created_at sorts chronologically; missing sorts last.
|
|
104
|
-
|
|
105
|
+
# Tiebreak deterministically (try_number, run_id, map_index) so that on equal or
|
|
106
|
+
# missing created_at a stable "latest" run is chosen (e.g. a retry wins its try).
|
|
107
|
+
out.sort(
|
|
108
|
+
key=lambda s: (
|
|
109
|
+
s.created_at or "",
|
|
110
|
+
s.ref.try_number,
|
|
111
|
+
s.ref.run_id,
|
|
112
|
+
s.ref.map_index,
|
|
113
|
+
),
|
|
114
|
+
reverse=True,
|
|
115
|
+
)
|
|
105
116
|
return out
|
|
106
117
|
|
|
107
118
|
def _all_summaries(self) -> list[ReportSummary]:
|
|
@@ -206,6 +217,10 @@ class FileSystemReportSource(ReportSource):
|
|
|
206
217
|
if len(row) > 2 and isinstance(row[2], int | float)
|
|
207
218
|
else 0.0
|
|
208
219
|
)
|
|
220
|
+
# Guard NaN/Infinity from a corrupt meta so they can't reach a
|
|
221
|
+
# JSON response (json.dumps would emit non-spec NaN/Infinity).
|
|
222
|
+
if not math.isfinite(dur):
|
|
223
|
+
dur = 0.0
|
|
209
224
|
out[str(row[0])] = {"outcome": str(row[1]), "duration": dur}
|
|
210
225
|
return out
|
|
211
226
|
# Older archive without the per-test map: parse junit.xml on demand.
|
|
@@ -217,12 +232,13 @@ class FileSystemReportSource(ReportSource):
|
|
|
217
232
|
except Exception:
|
|
218
233
|
_log.exception("Failed to parse JUnit report %s", report_path)
|
|
219
234
|
return None
|
|
235
|
+
|
|
236
|
+
def _dur(c: Any) -> float:
|
|
237
|
+
d = float(getattr(c, "time", 0.0) or 0.0)
|
|
238
|
+
return d if math.isfinite(d) else 0.0
|
|
239
|
+
|
|
220
240
|
return {
|
|
221
|
-
c.node_id: {
|
|
222
|
-
"outcome": c.outcome,
|
|
223
|
-
"duration": float(getattr(c, "time", 0.0) or 0.0),
|
|
224
|
-
}
|
|
225
|
-
for c in result.cases
|
|
241
|
+
c.node_id: {"outcome": c.outcome, "duration": _dur(c)} for c in result.cases
|
|
226
242
|
}
|
|
227
243
|
|
|
228
244
|
def delete(self, ref: ReportRef) -> bool:
|
|
@@ -366,18 +382,24 @@ class FileSystemReportSource(ReportSource):
|
|
|
366
382
|
_log.warning("Skipping meta with missing/invalid identity: %r", meta)
|
|
367
383
|
return None
|
|
368
384
|
|
|
369
|
-
|
|
370
|
-
|
|
371
|
-
|
|
372
|
-
|
|
385
|
+
# The counts/duration come from a semi-trusted sidecar (written by the test code
|
|
386
|
+
# the operator ran). A single corrupt value (non-numeric count, inf/NaN duration)
|
|
387
|
+
# must NOT crash the whole scan or leak non-spec JSON -- coerce defensively and
|
|
388
|
+
# keep the run, mirroring the identity skip above and test_outcomes' finite guard.
|
|
389
|
+
summary = meta.get("summary")
|
|
390
|
+
if not isinstance(summary, dict):
|
|
391
|
+
summary = {}
|
|
392
|
+
passed = _safe_int(summary.get("passed"))
|
|
393
|
+
failed = _safe_int(summary.get("failed"))
|
|
394
|
+
errors = _safe_int(summary.get("errors"))
|
|
373
395
|
return ReportSummary(
|
|
374
396
|
ref=ref,
|
|
375
|
-
total=
|
|
397
|
+
total=_safe_int(summary.get("total")),
|
|
376
398
|
passed=passed,
|
|
377
399
|
failed=failed,
|
|
378
|
-
skipped=
|
|
400
|
+
skipped=_safe_int(summary.get("skipped")),
|
|
379
401
|
errors=errors,
|
|
380
|
-
duration=
|
|
402
|
+
duration=_safe_finite_float(summary.get("duration")),
|
|
381
403
|
# success is reader-derived from the pass-rate threshold, not the stored flag.
|
|
382
404
|
success=run_succeeds(passed, failed, errors, threshold),
|
|
383
405
|
created_at=_opt_str(meta.get("created_at")),
|
|
@@ -388,3 +410,21 @@ class FileSystemReportSource(ReportSource):
|
|
|
388
410
|
|
|
389
411
|
def _opt_str(value: Any) -> str | None:
|
|
390
412
|
return str(value) if value is not None else None
|
|
413
|
+
|
|
414
|
+
|
|
415
|
+
def _safe_int(value: Any) -> int:
|
|
416
|
+
"""A summary count coerced to a non-negative int; ``0`` for anything unparseable."""
|
|
417
|
+
try:
|
|
418
|
+
return max(0, int(value))
|
|
419
|
+
except (TypeError, ValueError):
|
|
420
|
+
return 0
|
|
421
|
+
|
|
422
|
+
|
|
423
|
+
def _safe_finite_float(value: Any) -> float:
|
|
424
|
+
"""A summary duration coerced to a finite float; ``0.0`` for bad/inf/NaN values
|
|
425
|
+
(non-finite floats are not JSON-spec and would 500 the serializer)."""
|
|
426
|
+
try:
|
|
427
|
+
f = float(value)
|
|
428
|
+
except (TypeError, ValueError):
|
|
429
|
+
return 0.0
|
|
430
|
+
return f if math.isfinite(f) else 0.0
|
{airflow_pytest_plugin-0.3.2 → airflow_pytest_plugin-0.5.0}/src/airflow_pytest_plugin/web/app.py
RENAMED
|
@@ -150,6 +150,11 @@ def create_app(
|
|
|
150
150
|
|
|
151
151
|
@app.get("/", response_class=HTMLResponse, include_in_schema=False)
|
|
152
152
|
def index() -> HTMLResponse:
|
|
153
|
-
|
|
153
|
+
# The whole single-page app (incl. all inline JS) lives in this HTML, so it must
|
|
154
|
+
# never be served stale -- otherwise a browser/Airflow cache keeps running old JS
|
|
155
|
+
# after an upgrade. no-store guarantees every load fetches the current build.
|
|
156
|
+
return HTMLResponse(
|
|
157
|
+
index_html(), headers={"Cache-Control": "no-store, must-revalidate"}
|
|
158
|
+
)
|
|
154
159
|
|
|
155
160
|
return app
|