HSTransform 0.1.1__tar.gz
This diff represents the content of publicly available package versions that have been released to one of the supported registries. The information contained in this diff is provided for informational purposes only and reflects changes between package versions as they appear in their respective public registries.
- HSTransform-0.1.1/HSTransform.egg-info/PKG-INFO +130 -0
- HSTransform-0.1.1/HSTransform.egg-info/SOURCES.txt +11 -0
- HSTransform-0.1.1/HSTransform.egg-info/dependency_links.txt +1 -0
- HSTransform-0.1.1/HSTransform.egg-info/requires.txt +4 -0
- HSTransform-0.1.1/HSTransform.egg-info/top_level.txt +2 -0
- HSTransform-0.1.1/PKG-INFO +130 -0
- HSTransform-0.1.1/README.md +116 -0
- HSTransform-0.1.1/hstransform/__init__.py +1 -0
- HSTransform-0.1.1/hstransform/hstransform.py +133 -0
- HSTransform-0.1.1/setup.cfg +4 -0
- HSTransform-0.1.1/setup.py +38 -0
- HSTransform-0.1.1/tests/__init__.py +0 -0
- HSTransform-0.1.1/tests/test_hstransform.py +50 -0
|
@@ -0,0 +1,130 @@
|
|
|
1
|
+
Metadata-Version: 2.1
|
|
2
|
+
Name: HSTransform
|
|
3
|
+
Version: 0.1.1
|
|
4
|
+
Summary: A Package to Compute S-transform with Hyperbolic Window
|
|
5
|
+
Home-page: https://github.com/nvlinhvn/HSTransform
|
|
6
|
+
Author: Linh V Nguyen
|
|
7
|
+
Author-email: linhvietnguyen.ee@gmail.com
|
|
8
|
+
License: MIT
|
|
9
|
+
Classifier: Development Status :: 4 - Beta
|
|
10
|
+
Classifier: License :: OSI Approved :: MIT License
|
|
11
|
+
Classifier: Programming Language :: Python :: 3.10
|
|
12
|
+
Requires-Python: >=3.10
|
|
13
|
+
Description-Content-Type: text/markdown
|
|
14
|
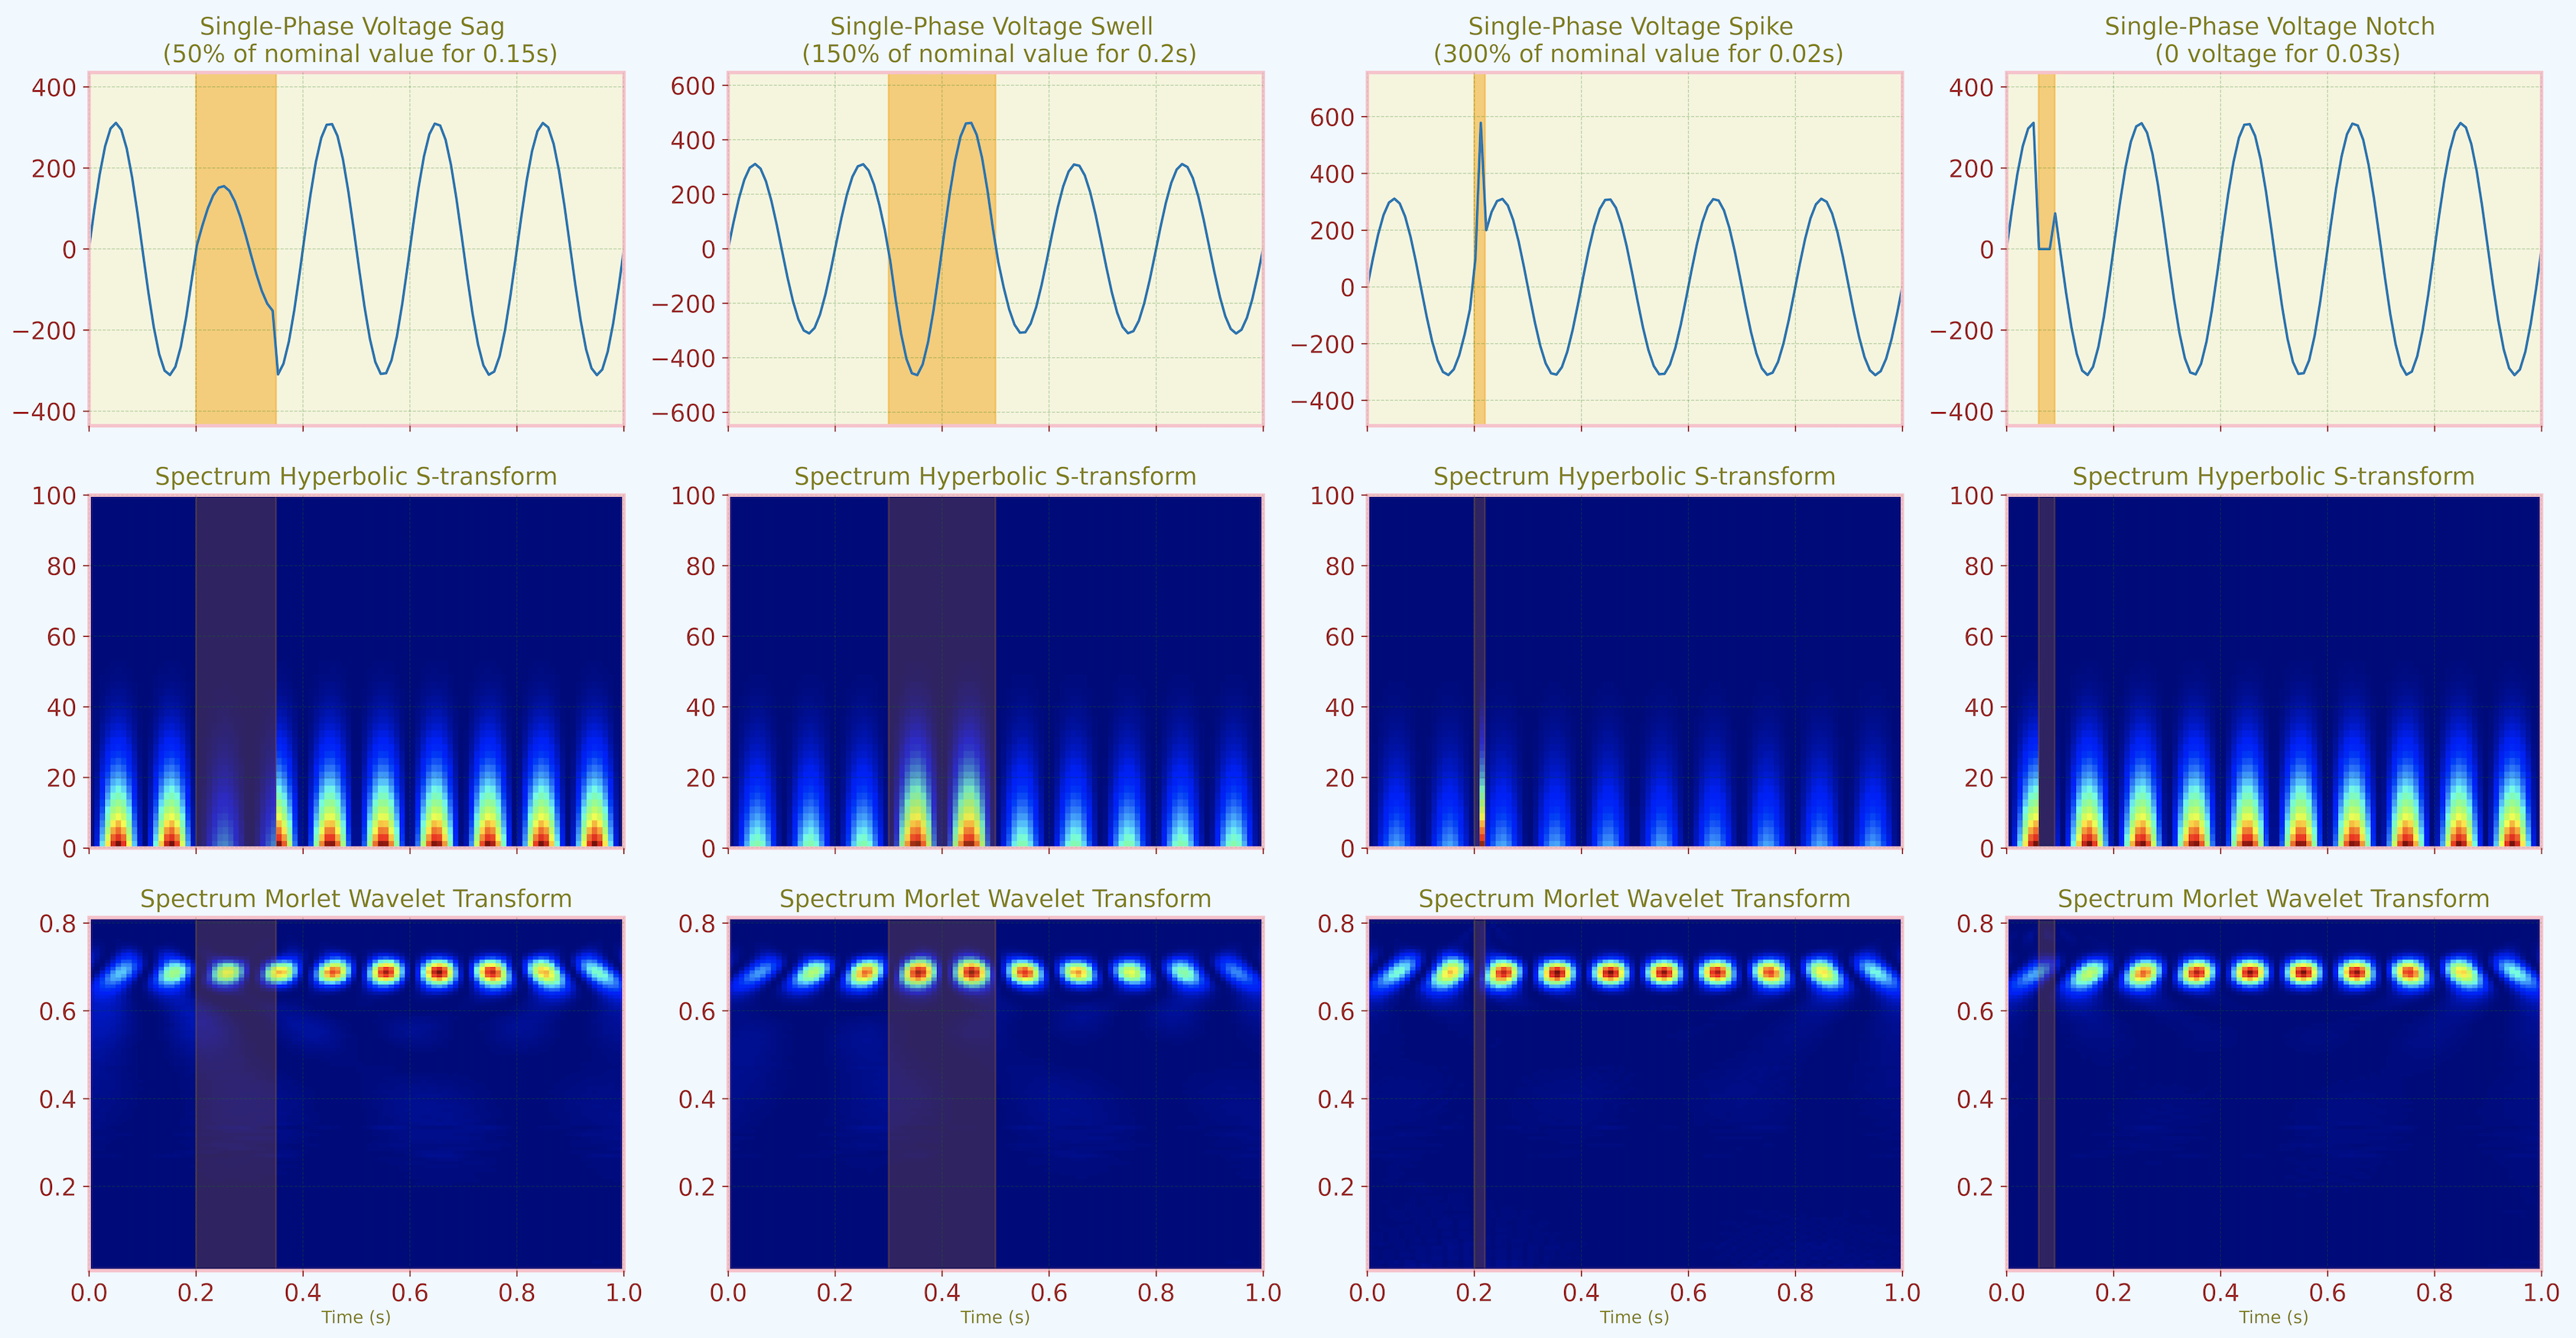
+
|
|
15
|
+
# Hyperbolic S-Transform
|
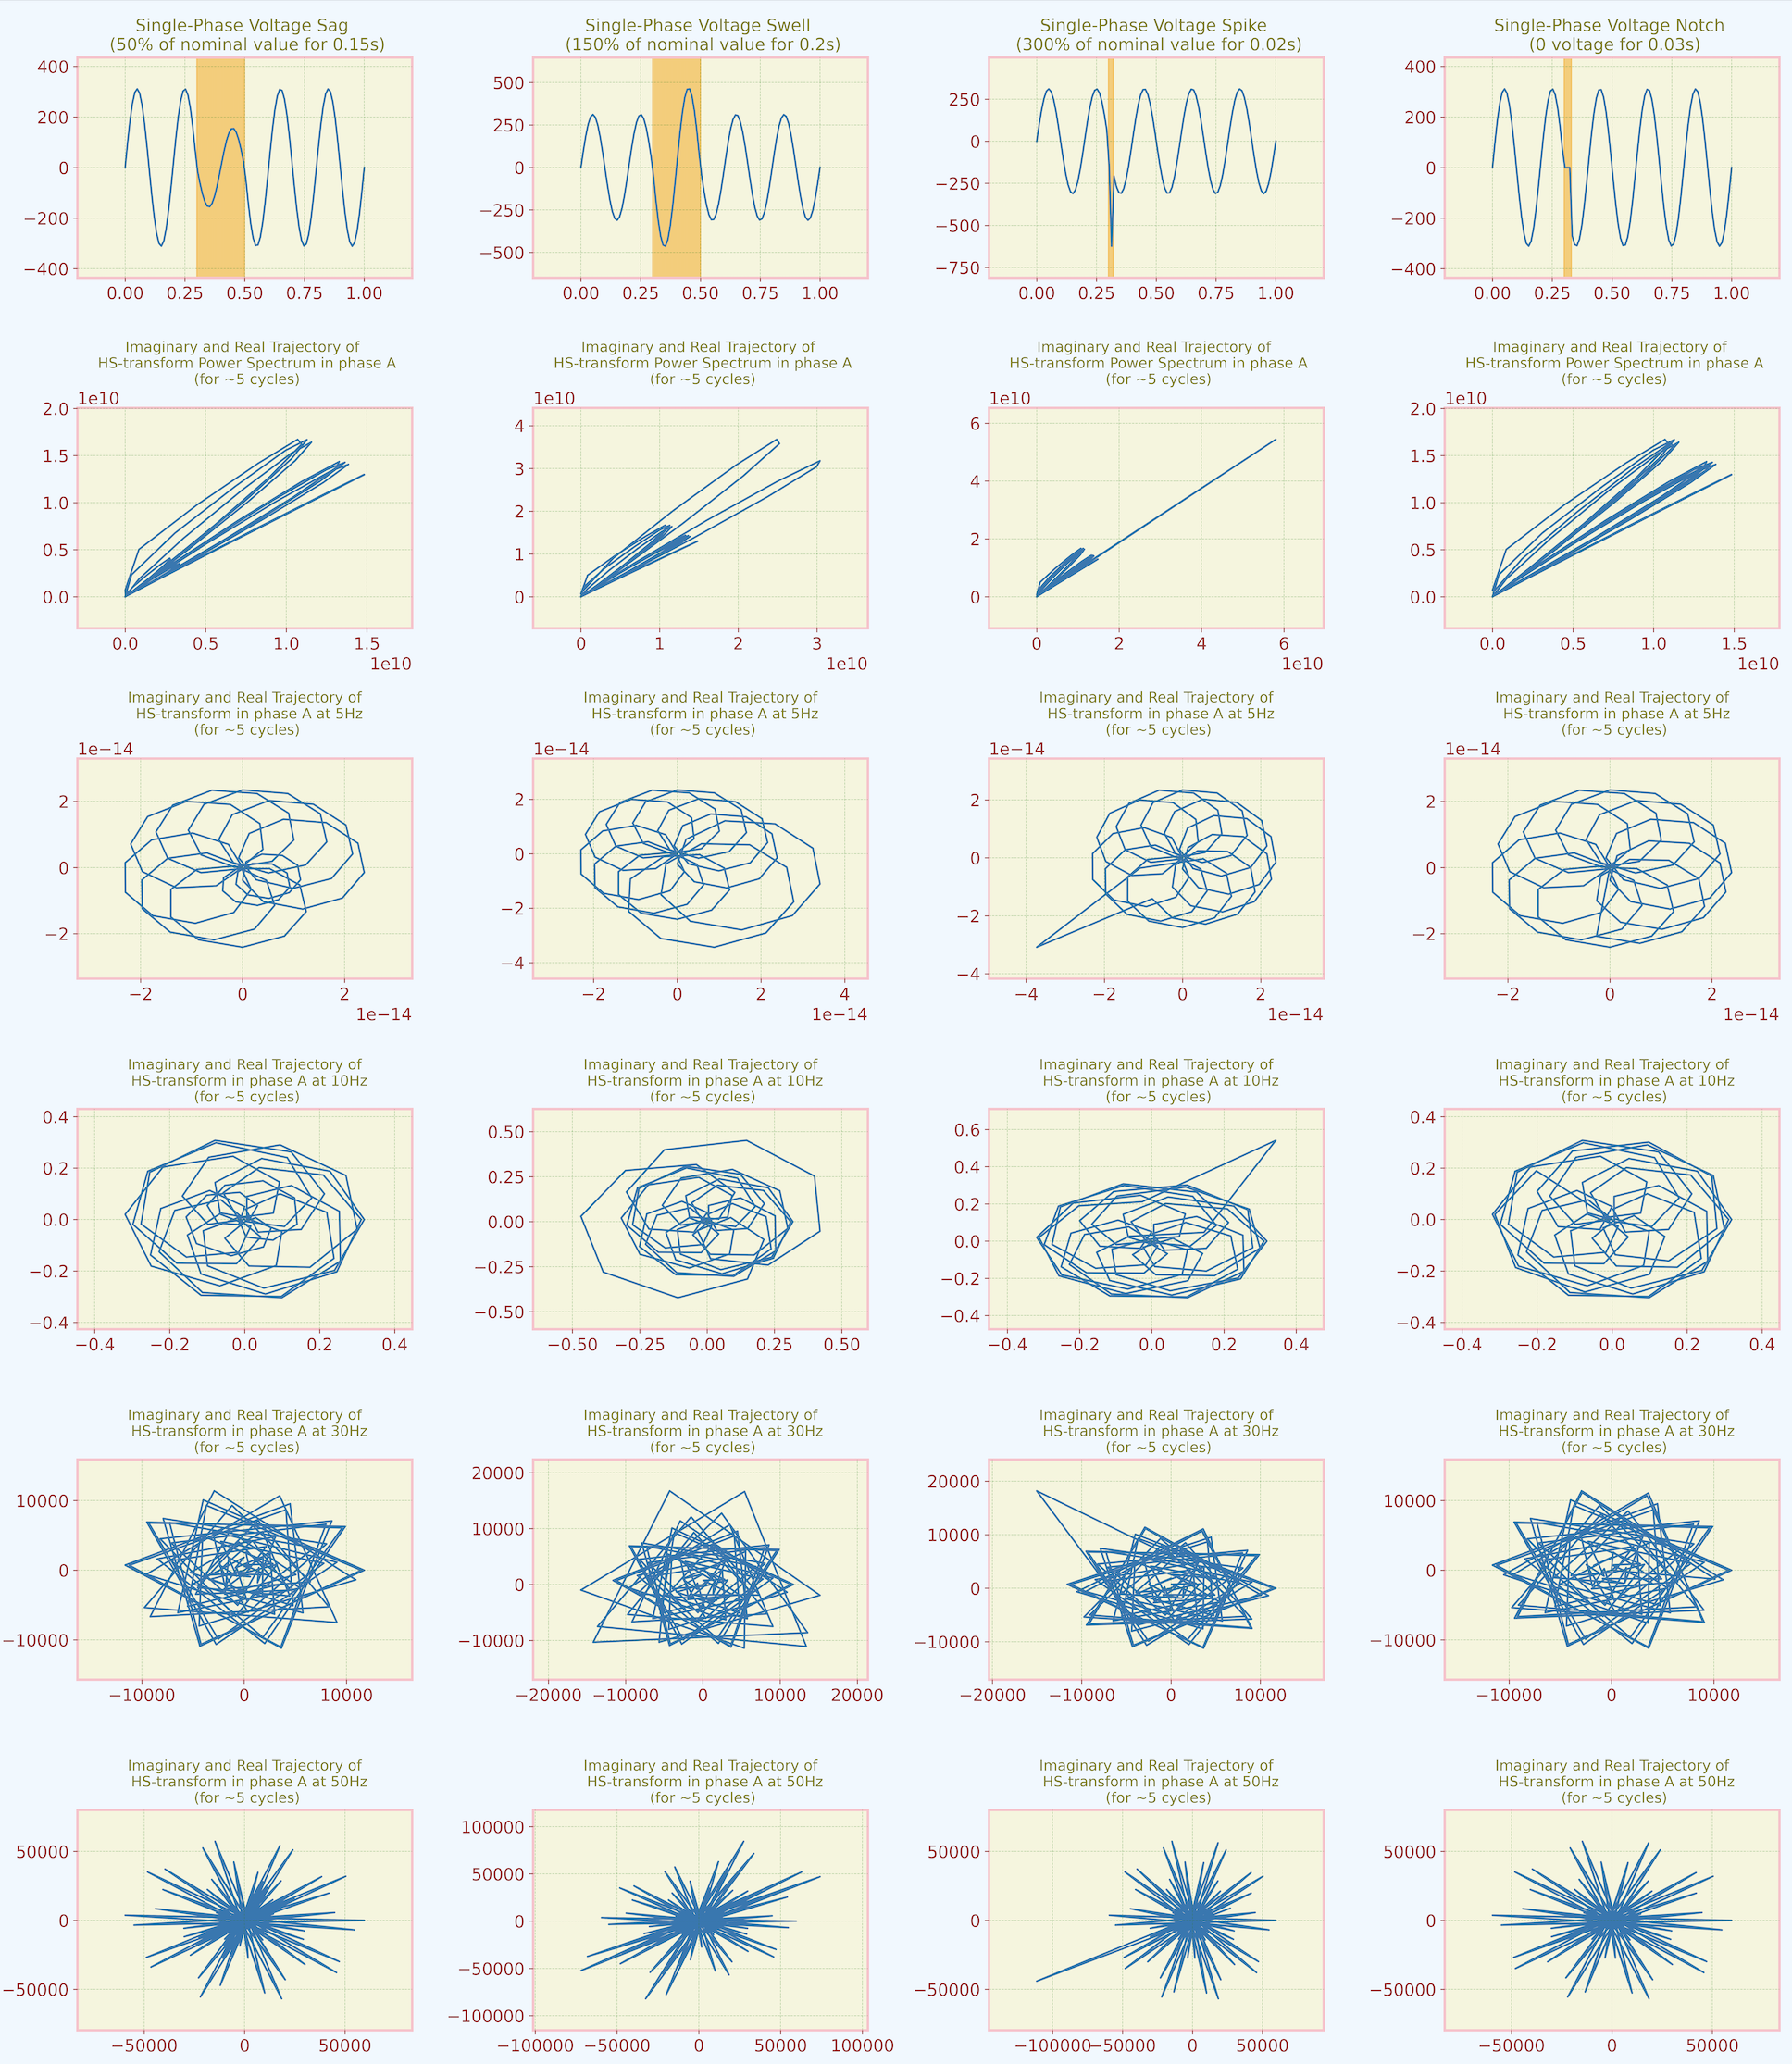
|
16
|
+
|
|
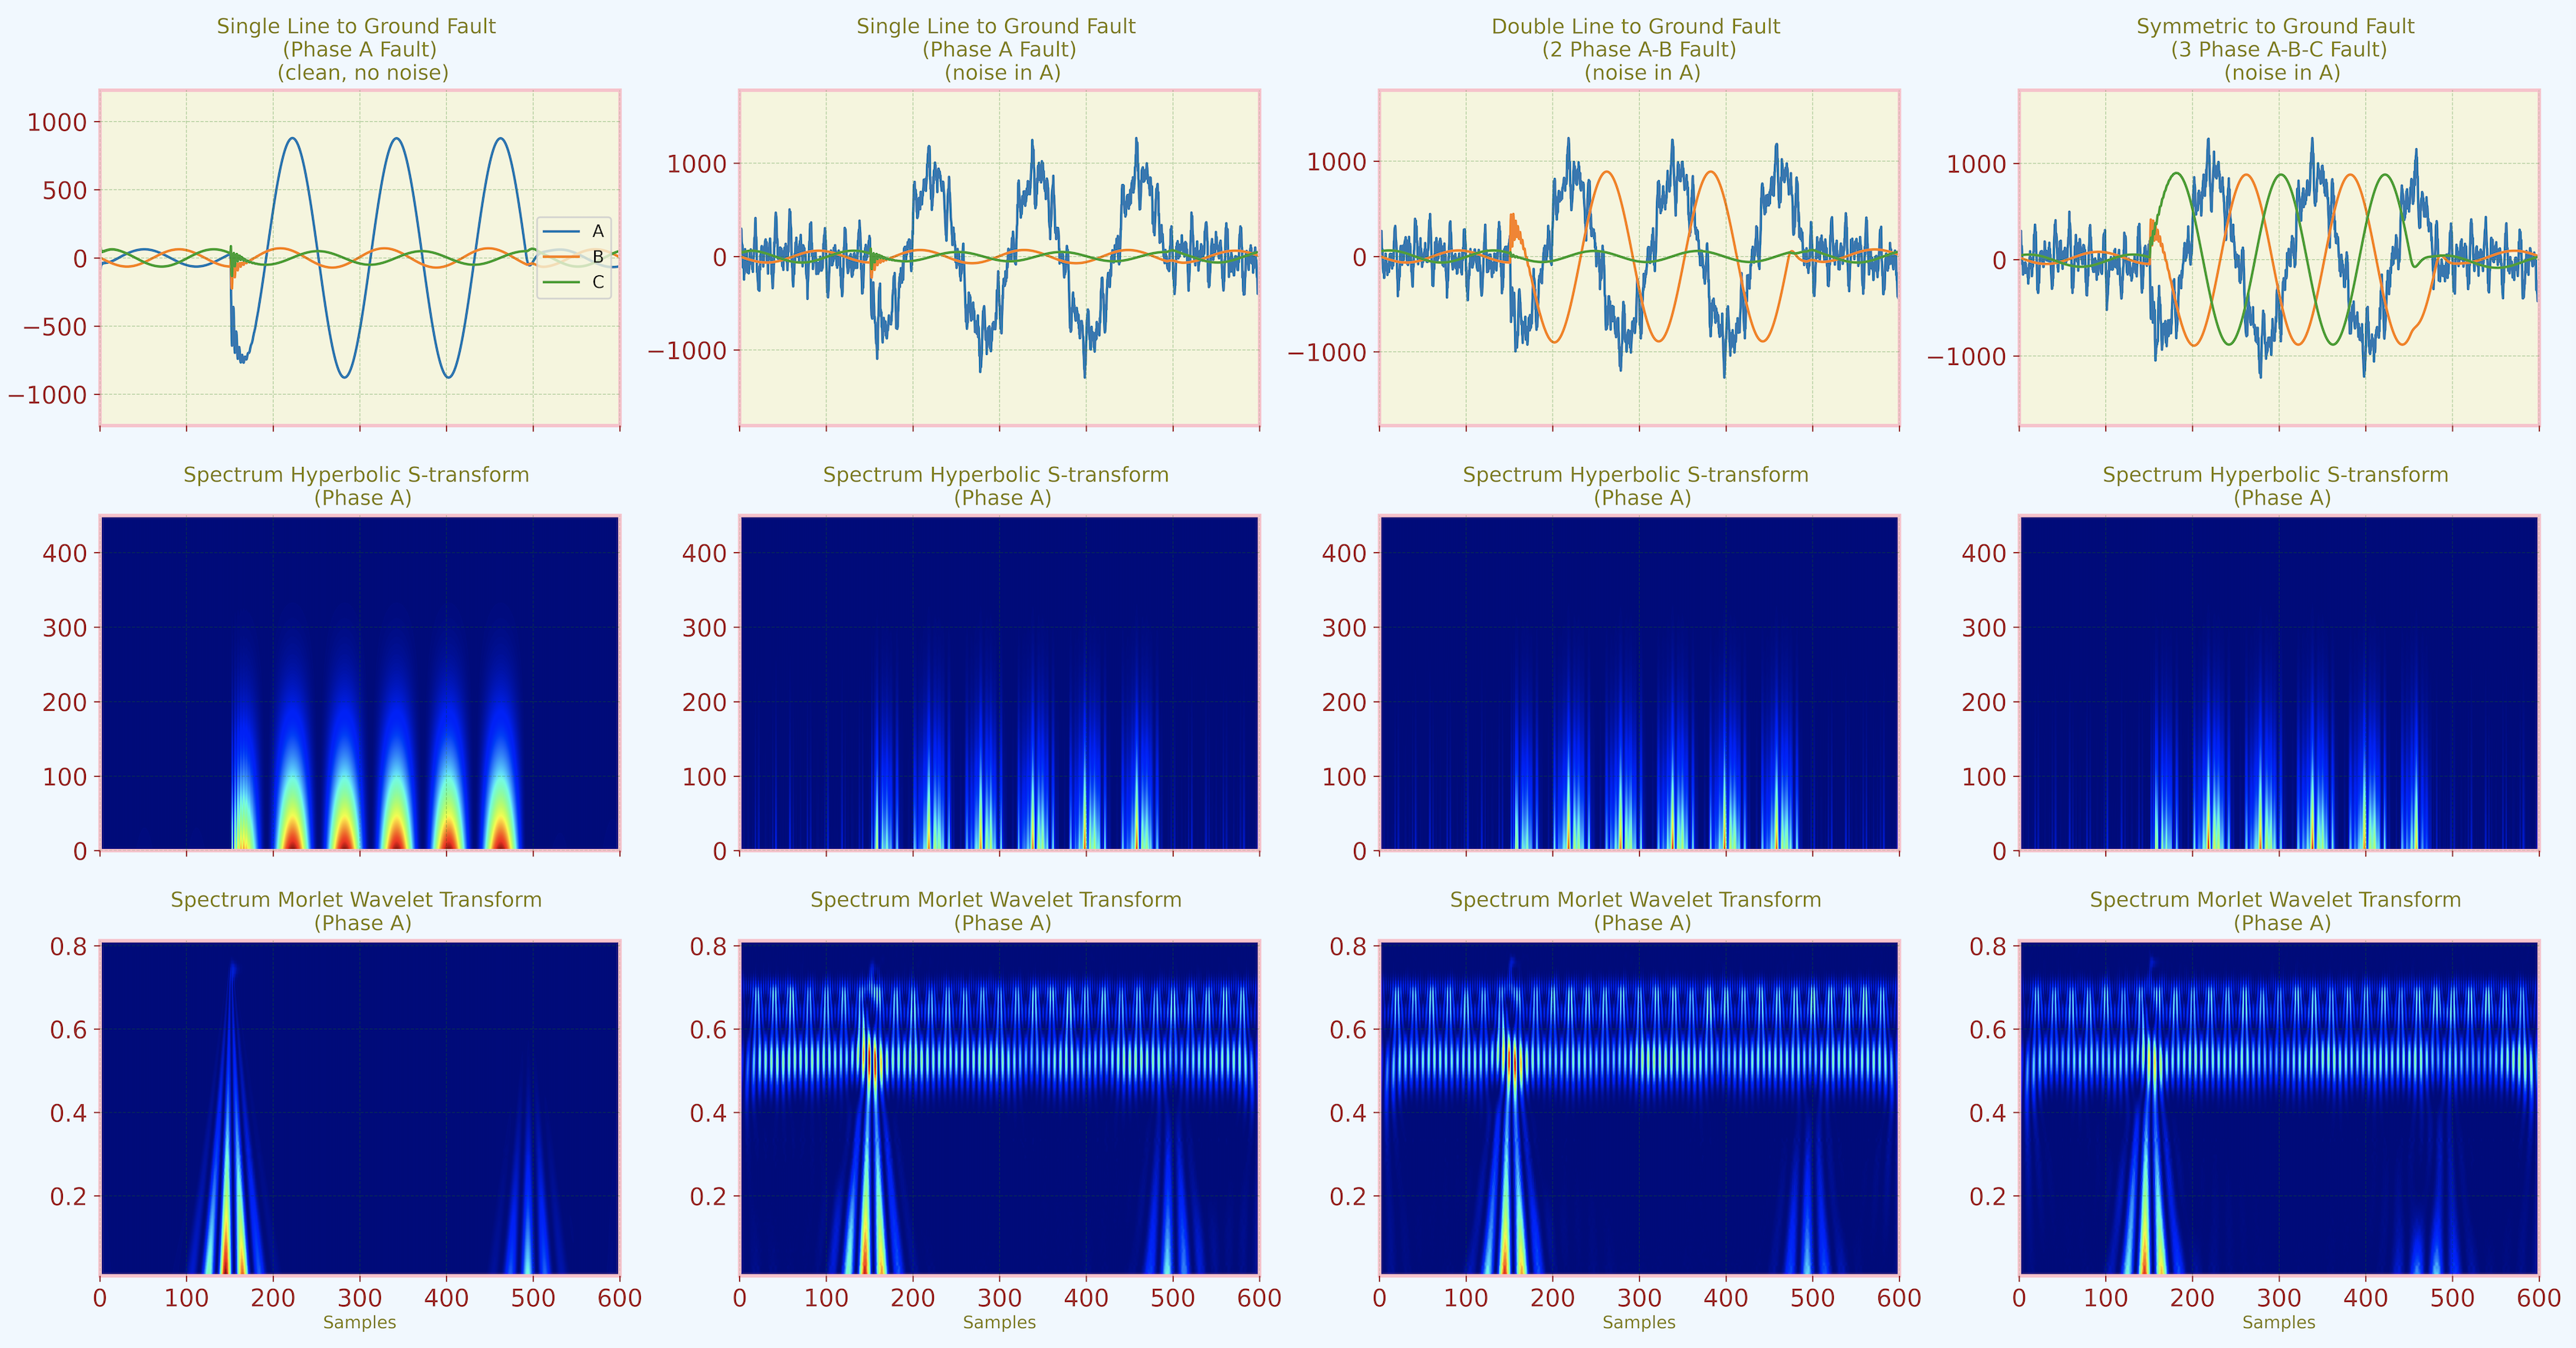
17
|
+
Package for Hyperbolic S-transform
|
|
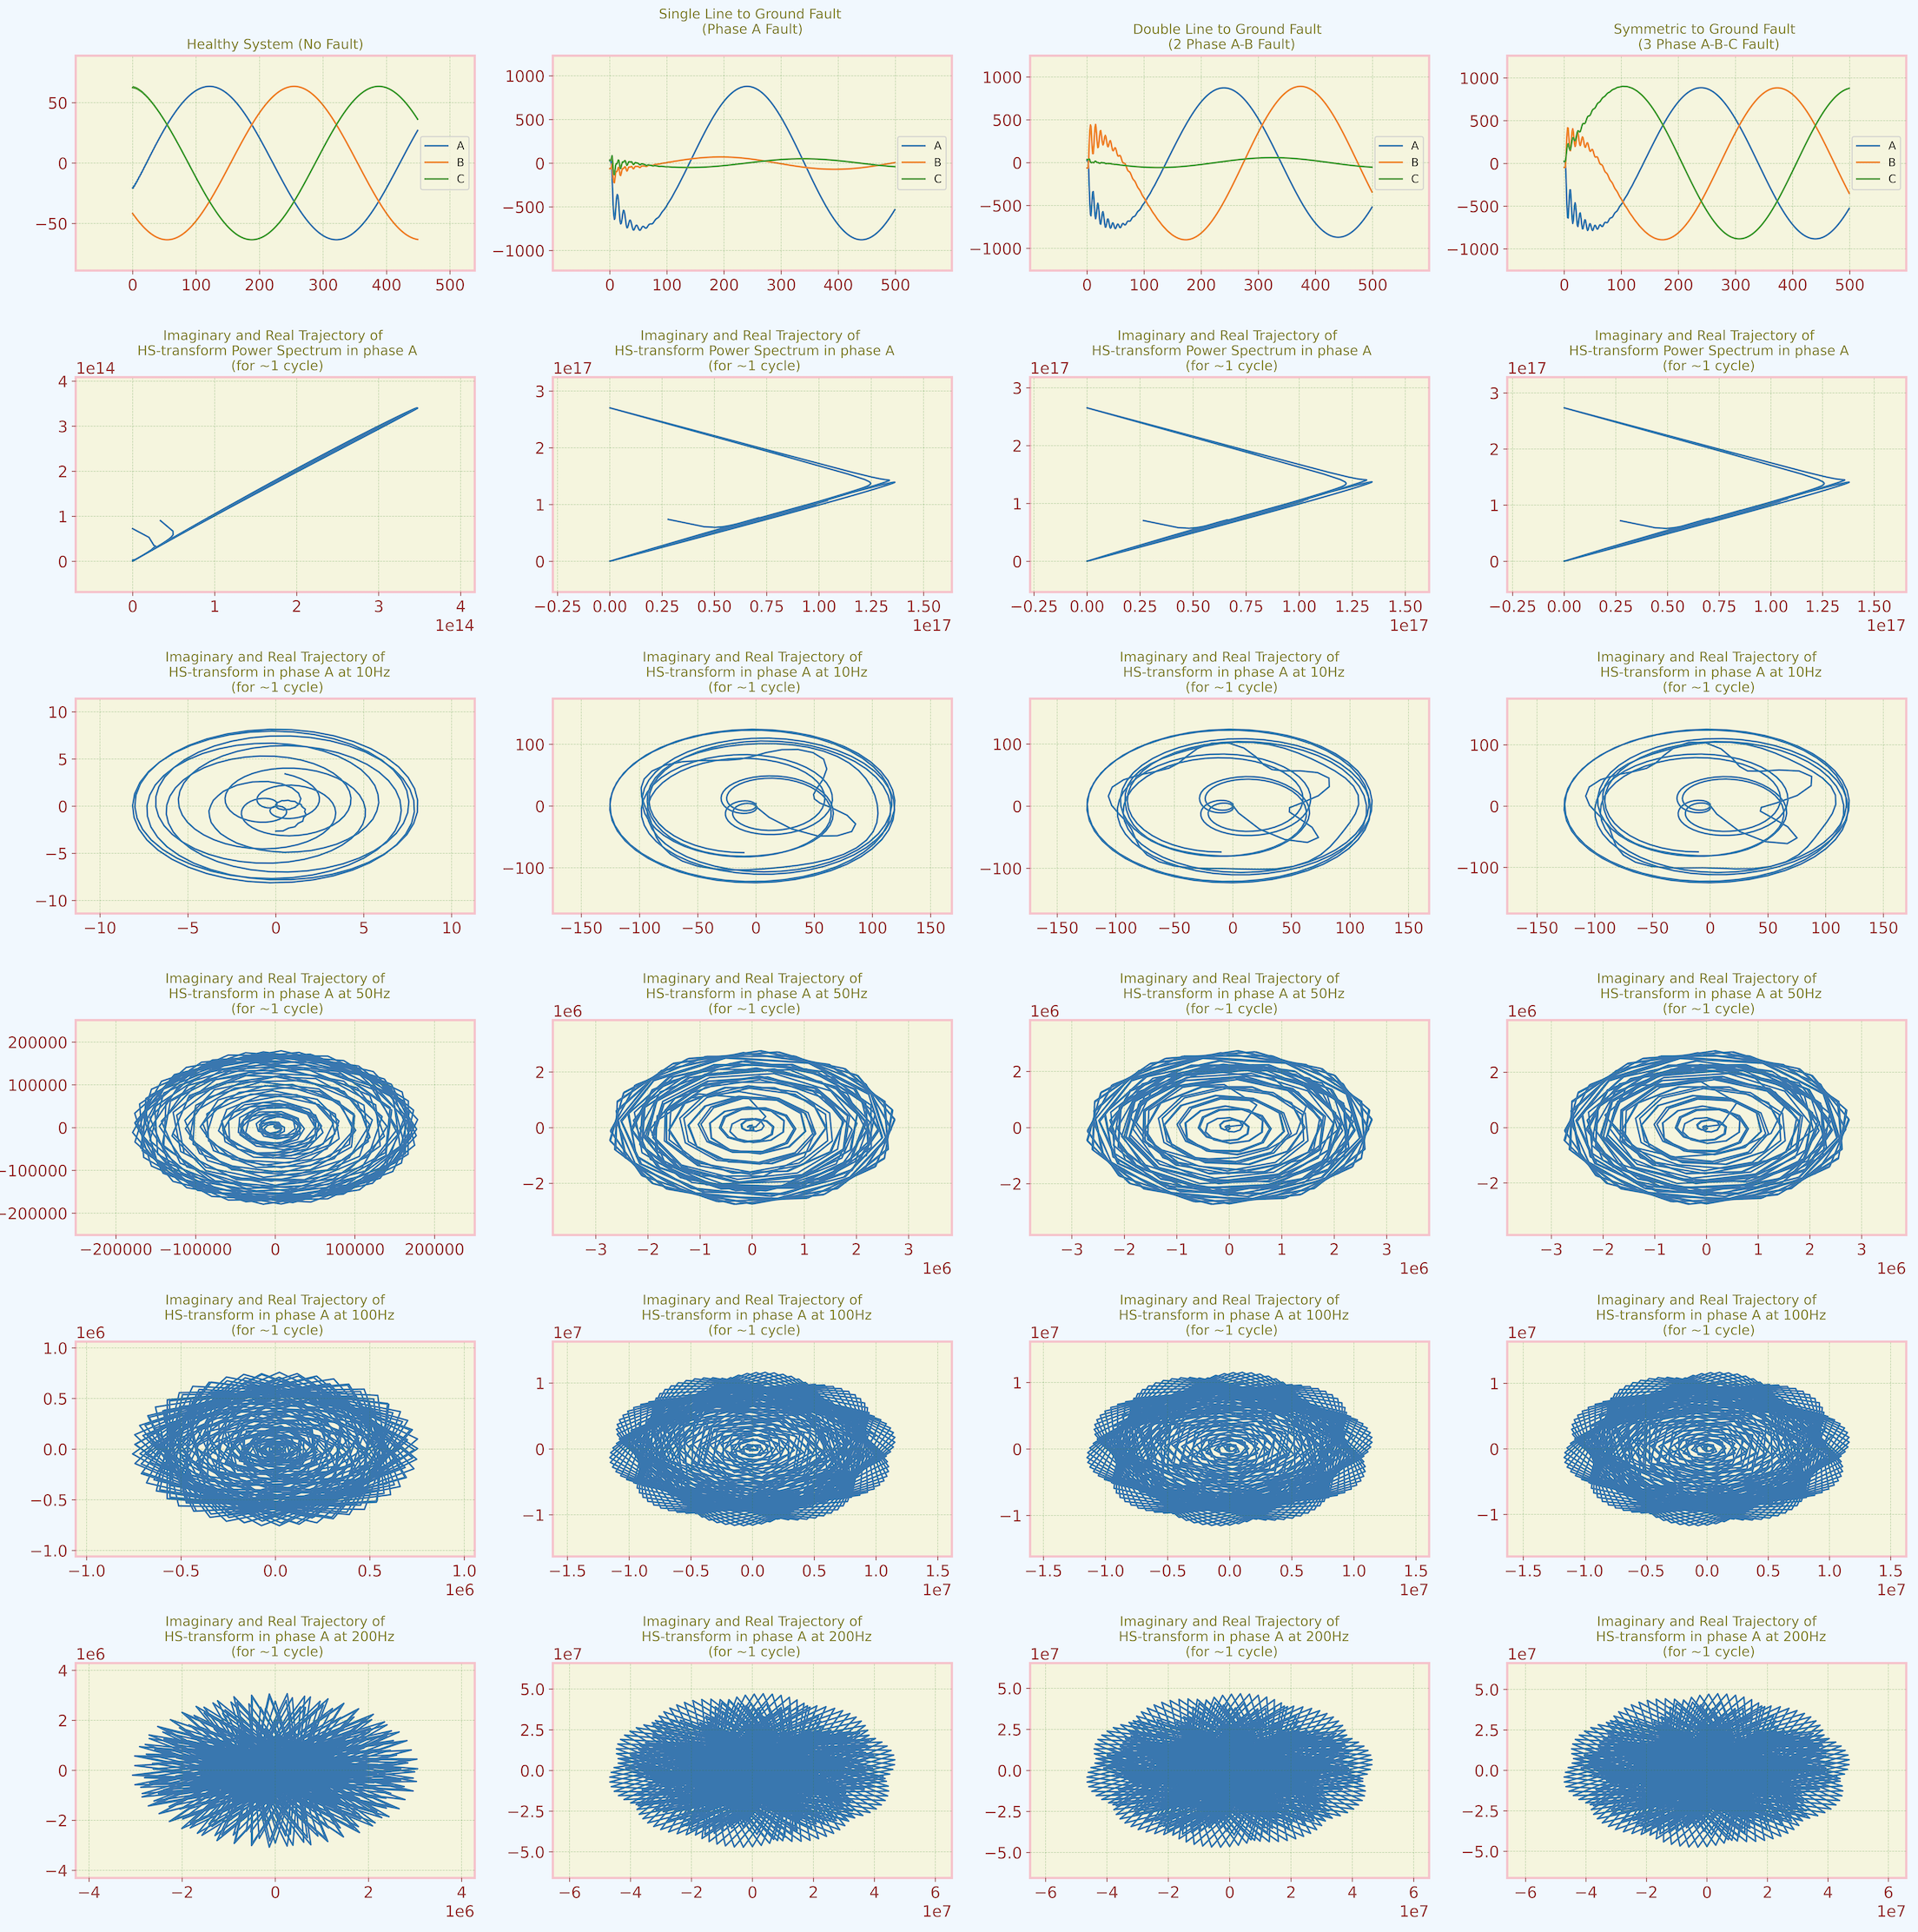
18
|
+
|
|
19
|
+
## 1. Introduction
|
|
20
|
+
|
|
21
|
+
HS Transform is a Python package for performing Hyperbolic [S-transform](https://en.wikipedia.org/wiki/S_transform) [[1]](#1). The S-transform is a time-frequency representation that combines the best properties of the Short-time Fourier Transform and the Wavelet Transform. It provides simultaneous information on both the frequency content and temporal localization of a signal.
|
|
22
|
+
|
|
23
|
+
This is a work of my [published paper](https://ieeexplore.ieee.org/document/8423487)
|
|
24
|
+
|
|
25
|
+
### References
|
|
26
|
+
|
|
27
|
+
<a id="1">[1]</a>
|
|
28
|
+
Stockwell, R.G., Mansinha, L. & Lowe, R.P., (1996).
|
|
29
|
+
Localization of the complex spectrum: the S transform.
|
|
30
|
+
IEEE Trans. Signal Process., 44(4), 998–1001, doi:10.1109/78.492555
|
|
31
|
+
|
|
32
|
+
## 2. Dependencies
|
|
33
|
+
|
|
34
|
+
HS Transform requires the following Python packages:
|
|
35
|
+
|
|
36
|
+
- numpy
|
|
37
|
+
- scipy
|
|
38
|
+
- pandas
|
|
39
|
+
- matplotlib
|
|
40
|
+
- pytest
|
|
41
|
+
|
|
42
|
+
## 3. How to Install
|
|
43
|
+
|
|
44
|
+
After that, you can install HS Transform using pip:
|
|
45
|
+
|
|
46
|
+
```
|
|
47
|
+
pip install HSTransform
|
|
48
|
+
```
|
|
49
|
+
|
|
50
|
+
You can also install all dependencies and package in 1 statement
|
|
51
|
+
|
|
52
|
+
```
|
|
53
|
+
pip install numpy scipy pandas matplotlib pytest HSTransform
|
|
54
|
+
```
|
|
55
|
+
|
|
56
|
+
## 4. Run tests
|
|
57
|
+
|
|
58
|
+
After installation, you can test the package using the included test scripts:
|
|
59
|
+
`pytest tests/`
|
|
60
|
+
|
|
61
|
+
## 5. Example
|
|
62
|
+
|
|
63
|
+
Here’s an example of how to use HS Transform to analyze a signal with voltage disturbance and power system fault:
|
|
64
|
+
|
|
65
|
+
It's noted sometimes you need to include the installed HSTransform package location into sys
|
|
66
|
+
|
|
67
|
+
```python
|
|
68
|
+
import sys
|
|
69
|
+
import os
|
|
70
|
+
|
|
71
|
+
# Add the package directory to sys.path
|
|
72
|
+
package_path = os.path.abspath('/usr/local/Caskroom/miniconda/base/envs/YOUR_ENVIRONMENT/lib/python3.10/site-packages/')
|
|
73
|
+
if package_path not in sys.path:
|
|
74
|
+
sys.path.insert(0, package_path)
|
|
75
|
+
|
|
76
|
+
import numpy as np
|
|
77
|
+
from hstransform import HSTransform
|
|
78
|
+
|
|
79
|
+
# Create input signal (for example: Voltage signal)
|
|
80
|
+
t = np.linspace(0, 10, 100) # timeseries
|
|
81
|
+
V_m = 220*np.sqrt(2) # peak voltage
|
|
82
|
+
f_V = 50 # frequency
|
|
83
|
+
phi_V = 0 # phase
|
|
84
|
+
|
|
85
|
+
V_clean = V_m * np.sin(2 * np.pi * f_V * t + phi_V)
|
|
86
|
+
# Create voltage sag/dip (80% of the nominal voltage for 0.15 second)
|
|
87
|
+
V_sag = np.where((t >= 2) & (t <= 3.5), 0.5 * V_clean, V_clean)
|
|
88
|
+
|
|
89
|
+
# Create an instance of HSTransform
|
|
90
|
+
|
|
91
|
+
hs = HSTransform()
|
|
92
|
+
|
|
93
|
+
# Perform the transform
|
|
94
|
+
signal = V_sag
|
|
95
|
+
S_transformed = hs.fit_transform(t, signal)
|
|
96
|
+
```
|
|
97
|
+
|
|
98
|
+
### 5.1 Power Quality Disturbance
|
|
99
|
+
|
|
100
|
+
Compare HS-transform vs. Morlet Wavelet Transform:
|
|
101
|
+
|
|
102
|
+
|
|
103
|
+
The figure showed HS-transform is able to detect the transient disturbances like notch, spike. Meanwhile, those signals from Morlet Wavelet transform are not obviously recognized.
|
|
104
|
+
|
|
105
|
+
######
|
|
106
|
+
|
|
107
|
+
|
|
108
|
+
We can see also different types of voltage disturbance can generate different real-imaginary trajectory in S-transform at different frequencies.
|
|
109
|
+
|
|
110
|
+
### 5.2 Power System Faults
|
|
111
|
+
|
|
112
|
+
|
|
113
|
+
|
|
114
|
+
As can be seen, both Wavelet and S-transform are able to detect when the fault occur (huge change in current magnitude). Wavelet transform seems more sensitive with noise with high distortion compared with HS-transform.
|
|
115
|
+
|
|
116
|
+
######
|
|
117
|
+
|
|
118
|
+
|
|
119
|
+
|
|
120
|
+
We can also observe different types of faults can generate different real-imaginary trajectory in S-transform at varying levels of frequencies.
|
|
121
|
+
|
|
122
|
+
## 6. Communication
|
|
123
|
+
|
|
124
|
+
If you have any questions, issues, or suggestions for HS Transform, please open an issue on the GitHub repository.
|
|
125
|
+
or contact email: linhvietnguyen.ee@gmail.com
|
|
126
|
+
|
|
127
|
+
## 7. Citation
|
|
128
|
+
|
|
129
|
+
If you use HS Transform in your research, please cite it as follows:
|
|
130
|
+
Linh V Nguyen (2024). HS Transform (Version 0.1) [Computer software]. GitHub: github.com/nvlinhvn/hstransform
|
|
@@ -0,0 +1,11 @@
|
|
|
1
|
+
README.md
|
|
2
|
+
setup.py
|
|
3
|
+
HSTransform.egg-info/PKG-INFO
|
|
4
|
+
HSTransform.egg-info/SOURCES.txt
|
|
5
|
+
HSTransform.egg-info/dependency_links.txt
|
|
6
|
+
HSTransform.egg-info/requires.txt
|
|
7
|
+
HSTransform.egg-info/top_level.txt
|
|
8
|
+
hstransform/__init__.py
|
|
9
|
+
hstransform/hstransform.py
|
|
10
|
+
tests/__init__.py
|
|
11
|
+
tests/test_hstransform.py
|
|
@@ -0,0 +1 @@
|
|
|
1
|
+
|
|
@@ -0,0 +1,130 @@
|
|
|
1
|
+
Metadata-Version: 2.1
|
|
2
|
+
Name: HSTransform
|
|
3
|
+
Version: 0.1.1
|
|
4
|
+
Summary: A Package to Compute S-transform with Hyperbolic Window
|
|
5
|
+
Home-page: https://github.com/nvlinhvn/HSTransform
|
|
6
|
+
Author: Linh V Nguyen
|
|
7
|
+
Author-email: linhvietnguyen.ee@gmail.com
|
|
8
|
+
License: MIT
|
|
9
|
+
Classifier: Development Status :: 4 - Beta
|
|
10
|
+
Classifier: License :: OSI Approved :: MIT License
|
|
11
|
+
Classifier: Programming Language :: Python :: 3.10
|
|
12
|
+
Requires-Python: >=3.10
|
|
13
|
+
Description-Content-Type: text/markdown
|
|
14
|
+
|
|
15
|
+
# Hyperbolic S-Transform
|
|
16
|
+
|
|
17
|
+
Package for Hyperbolic S-transform
|
|
18
|
+
|
|
19
|
+
## 1. Introduction
|
|
20
|
+
|
|
21
|
+
HS Transform is a Python package for performing Hyperbolic [S-transform](https://en.wikipedia.org/wiki/S_transform) [[1]](#1). The S-transform is a time-frequency representation that combines the best properties of the Short-time Fourier Transform and the Wavelet Transform. It provides simultaneous information on both the frequency content and temporal localization of a signal.
|
|
22
|
+
|
|
23
|
+
This is a work of my [published paper](https://ieeexplore.ieee.org/document/8423487)
|
|
24
|
+
|
|
25
|
+
### References
|
|
26
|
+
|
|
27
|
+
<a id="1">[1]</a>
|
|
28
|
+
Stockwell, R.G., Mansinha, L. & Lowe, R.P., (1996).
|
|
29
|
+
Localization of the complex spectrum: the S transform.
|
|
30
|
+
IEEE Trans. Signal Process., 44(4), 998–1001, doi:10.1109/78.492555
|
|
31
|
+
|
|
32
|
+
## 2. Dependencies
|
|
33
|
+
|
|
34
|
+
HS Transform requires the following Python packages:
|
|
35
|
+
|
|
36
|
+
- numpy
|
|
37
|
+
- scipy
|
|
38
|
+
- pandas
|
|
39
|
+
- matplotlib
|
|
40
|
+
- pytest
|
|
41
|
+
|
|
42
|
+
## 3. How to Install
|
|
43
|
+
|
|
44
|
+
After that, you can install HS Transform using pip:
|
|
45
|
+
|
|
46
|
+
```
|
|
47
|
+
pip install HSTransform
|
|
48
|
+
```
|
|
49
|
+
|
|
50
|
+
You can also install all dependencies and package in 1 statement
|
|
51
|
+
|
|
52
|
+
```
|
|
53
|
+
pip install numpy scipy pandas matplotlib pytest HSTransform
|
|
54
|
+
```
|
|
55
|
+
|
|
56
|
+
## 4. Run tests
|
|
57
|
+
|
|
58
|
+
After installation, you can test the package using the included test scripts:
|
|
59
|
+
`pytest tests/`
|
|
60
|
+
|
|
61
|
+
## 5. Example
|
|
62
|
+
|
|
63
|
+
Here’s an example of how to use HS Transform to analyze a signal with voltage disturbance and power system fault:
|
|
64
|
+
|
|
65
|
+
It's noted sometimes you need to include the installed HSTransform package location into sys
|
|
66
|
+
|
|
67
|
+
```python
|
|
68
|
+
import sys
|
|
69
|
+
import os
|
|
70
|
+
|
|
71
|
+
# Add the package directory to sys.path
|
|
72
|
+
package_path = os.path.abspath('/usr/local/Caskroom/miniconda/base/envs/YOUR_ENVIRONMENT/lib/python3.10/site-packages/')
|
|
73
|
+
if package_path not in sys.path:
|
|
74
|
+
sys.path.insert(0, package_path)
|
|
75
|
+
|
|
76
|
+
import numpy as np
|
|
77
|
+
from hstransform import HSTransform
|
|
78
|
+
|
|
79
|
+
# Create input signal (for example: Voltage signal)
|
|
80
|
+
t = np.linspace(0, 10, 100) # timeseries
|
|
81
|
+
V_m = 220*np.sqrt(2) # peak voltage
|
|
82
|
+
f_V = 50 # frequency
|
|
83
|
+
phi_V = 0 # phase
|
|
84
|
+
|
|
85
|
+
V_clean = V_m * np.sin(2 * np.pi * f_V * t + phi_V)
|
|
86
|
+
# Create voltage sag/dip (80% of the nominal voltage for 0.15 second)
|
|
87
|
+
V_sag = np.where((t >= 2) & (t <= 3.5), 0.5 * V_clean, V_clean)
|
|
88
|
+
|
|
89
|
+
# Create an instance of HSTransform
|
|
90
|
+
|
|
91
|
+
hs = HSTransform()
|
|
92
|
+
|
|
93
|
+
# Perform the transform
|
|
94
|
+
signal = V_sag
|
|
95
|
+
S_transformed = hs.fit_transform(t, signal)
|
|
96
|
+
```
|
|
97
|
+
|
|
98
|
+
### 5.1 Power Quality Disturbance
|
|
99
|
+
|
|
100
|
+
Compare HS-transform vs. Morlet Wavelet Transform:
|
|
101
|
+

|
|
102
|
+
|
|
103
|
+
The figure showed HS-transform is able to detect the transient disturbances like notch, spike. Meanwhile, those signals from Morlet Wavelet transform are not obviously recognized.
|
|
104
|
+
|
|
105
|
+
######
|
|
106
|
+
|
|
107
|
+

|
|
108
|
+
We can see also different types of voltage disturbance can generate different real-imaginary trajectory in S-transform at different frequencies.
|
|
109
|
+
|
|
110
|
+
### 5.2 Power System Faults
|
|
111
|
+
|
|
112
|
+

|
|
113
|
+
|
|
114
|
+
As can be seen, both Wavelet and S-transform are able to detect when the fault occur (huge change in current magnitude). Wavelet transform seems more sensitive with noise with high distortion compared with HS-transform.
|
|
115
|
+
|
|
116
|
+
######
|
|
117
|
+
|
|
118
|
+

|
|
119
|
+
|
|
120
|
+
We can also observe different types of faults can generate different real-imaginary trajectory in S-transform at varying levels of frequencies.
|
|
121
|
+
|
|
122
|
+
## 6. Communication
|
|
123
|
+
|
|
124
|
+
If you have any questions, issues, or suggestions for HS Transform, please open an issue on the GitHub repository.
|
|
125
|
+
or contact email: linhvietnguyen.ee@gmail.com
|
|
126
|
+
|
|
127
|
+
## 7. Citation
|
|
128
|
+
|
|
129
|
+
If you use HS Transform in your research, please cite it as follows:
|
|
130
|
+
Linh V Nguyen (2024). HS Transform (Version 0.1) [Computer software]. GitHub: github.com/nvlinhvn/hstransform
|
|
@@ -0,0 +1,116 @@
|
|
|
1
|
+
# Hyperbolic S-Transform
|
|
2
|
+
|
|
3
|
+
Package for Hyperbolic S-transform
|
|
4
|
+
|
|
5
|
+
## 1. Introduction
|
|
6
|
+
|
|
7
|
+
HS Transform is a Python package for performing Hyperbolic [S-transform](https://en.wikipedia.org/wiki/S_transform) [[1]](#1). The S-transform is a time-frequency representation that combines the best properties of the Short-time Fourier Transform and the Wavelet Transform. It provides simultaneous information on both the frequency content and temporal localization of a signal.
|
|
8
|
+
|
|
9
|
+
This is a work of my [published paper](https://ieeexplore.ieee.org/document/8423487)
|
|
10
|
+
|
|
11
|
+
### References
|
|
12
|
+
|
|
13
|
+
<a id="1">[1]</a>
|
|
14
|
+
Stockwell, R.G., Mansinha, L. & Lowe, R.P., (1996).
|
|
15
|
+
Localization of the complex spectrum: the S transform.
|
|
16
|
+
IEEE Trans. Signal Process., 44(4), 998–1001, doi:10.1109/78.492555
|
|
17
|
+
|
|
18
|
+
## 2. Dependencies
|
|
19
|
+
|
|
20
|
+
HS Transform requires the following Python packages:
|
|
21
|
+
|
|
22
|
+
- numpy
|
|
23
|
+
- scipy
|
|
24
|
+
- pandas
|
|
25
|
+
- matplotlib
|
|
26
|
+
- pytest
|
|
27
|
+
|
|
28
|
+
## 3. How to Install
|
|
29
|
+
|
|
30
|
+
After that, you can install HS Transform using pip:
|
|
31
|
+
|
|
32
|
+
```
|
|
33
|
+
pip install HSTransform
|
|
34
|
+
```
|
|
35
|
+
|
|
36
|
+
You can also install all dependencies and package in 1 statement
|
|
37
|
+
|
|
38
|
+
```
|
|
39
|
+
pip install numpy scipy pandas matplotlib pytest HSTransform
|
|
40
|
+
```
|
|
41
|
+
|
|
42
|
+
## 4. Run tests
|
|
43
|
+
|
|
44
|
+
After installation, you can test the package using the included test scripts:
|
|
45
|
+
`pytest tests/`
|
|
46
|
+
|
|
47
|
+
## 5. Example
|
|
48
|
+
|
|
49
|
+
Here’s an example of how to use HS Transform to analyze a signal with voltage disturbance and power system fault:
|
|
50
|
+
|
|
51
|
+
It's noted sometimes you need to include the installed HSTransform package location into sys
|
|
52
|
+
|
|
53
|
+
```python
|
|
54
|
+
import sys
|
|
55
|
+
import os
|
|
56
|
+
|
|
57
|
+
# Add the package directory to sys.path
|
|
58
|
+
package_path = os.path.abspath('/usr/local/Caskroom/miniconda/base/envs/YOUR_ENVIRONMENT/lib/python3.10/site-packages/')
|
|
59
|
+
if package_path not in sys.path:
|
|
60
|
+
sys.path.insert(0, package_path)
|
|
61
|
+
|
|
62
|
+
import numpy as np
|
|
63
|
+
from hstransform import HSTransform
|
|
64
|
+
|
|
65
|
+
# Create input signal (for example: Voltage signal)
|
|
66
|
+
t = np.linspace(0, 10, 100) # timeseries
|
|
67
|
+
V_m = 220*np.sqrt(2) # peak voltage
|
|
68
|
+
f_V = 50 # frequency
|
|
69
|
+
phi_V = 0 # phase
|
|
70
|
+
|
|
71
|
+
V_clean = V_m * np.sin(2 * np.pi * f_V * t + phi_V)
|
|
72
|
+
# Create voltage sag/dip (80% of the nominal voltage for 0.15 second)
|
|
73
|
+
V_sag = np.where((t >= 2) & (t <= 3.5), 0.5 * V_clean, V_clean)
|
|
74
|
+
|
|
75
|
+
# Create an instance of HSTransform
|
|
76
|
+
|
|
77
|
+
hs = HSTransform()
|
|
78
|
+
|
|
79
|
+
# Perform the transform
|
|
80
|
+
signal = V_sag
|
|
81
|
+
S_transformed = hs.fit_transform(t, signal)
|
|
82
|
+
```
|
|
83
|
+
|
|
84
|
+
### 5.1 Power Quality Disturbance
|
|
85
|
+
|
|
86
|
+
Compare HS-transform vs. Morlet Wavelet Transform:
|
|
87
|
+

|
|
88
|
+
|
|
89
|
+
The figure showed HS-transform is able to detect the transient disturbances like notch, spike. Meanwhile, those signals from Morlet Wavelet transform are not obviously recognized.
|
|
90
|
+
|
|
91
|
+
######
|
|
92
|
+
|
|
93
|
+

|
|
94
|
+
We can see also different types of voltage disturbance can generate different real-imaginary trajectory in S-transform at different frequencies.
|
|
95
|
+
|
|
96
|
+
### 5.2 Power System Faults
|
|
97
|
+
|
|
98
|
+

|
|
99
|
+
|
|
100
|
+
As can be seen, both Wavelet and S-transform are able to detect when the fault occur (huge change in current magnitude). Wavelet transform seems more sensitive with noise with high distortion compared with HS-transform.
|
|
101
|
+
|
|
102
|
+
######
|
|
103
|
+
|
|
104
|
+

|
|
105
|
+
|
|
106
|
+
We can also observe different types of faults can generate different real-imaginary trajectory in S-transform at varying levels of frequencies.
|
|
107
|
+
|
|
108
|
+
## 6. Communication
|
|
109
|
+
|
|
110
|
+
If you have any questions, issues, or suggestions for HS Transform, please open an issue on the GitHub repository.
|
|
111
|
+
or contact email: linhvietnguyen.ee@gmail.com
|
|
112
|
+
|
|
113
|
+
## 7. Citation
|
|
114
|
+
|
|
115
|
+
If you use HS Transform in your research, please cite it as follows:
|
|
116
|
+
Linh V Nguyen (2024). HS Transform (Version 0.1) [Computer software]. GitHub: github.com/nvlinhvn/hstransform
|
|
@@ -0,0 +1 @@
|
|
|
1
|
+
from .hstransform import HSTransform
|
|
@@ -0,0 +1,133 @@
|
|
|
1
|
+
import dataclasses
|
|
2
|
+
from typing import Union
|
|
3
|
+
|
|
4
|
+
import numpy as np
|
|
5
|
+
from scipy.fft import fft, ifft
|
|
6
|
+
import pandas as pd
|
|
7
|
+
|
|
8
|
+
|
|
9
|
+
@dataclasses.dataclass
|
|
10
|
+
class HSTransform:
|
|
11
|
+
"""
|
|
12
|
+
A class used to represent the S-transform with a hyperbolic Gaussian window.
|
|
13
|
+
|
|
14
|
+
...
|
|
15
|
+
|
|
16
|
+
Attributes
|
|
17
|
+
----------
|
|
18
|
+
forwardtaper : float
|
|
19
|
+
forward taper value
|
|
20
|
+
backwardtaper : float
|
|
21
|
+
backward taper value
|
|
22
|
+
curvature : float
|
|
23
|
+
curvature value
|
|
24
|
+
"""
|
|
25
|
+
|
|
26
|
+
forwardtaper: float = 0.2
|
|
27
|
+
backwardtaper: float = 0.1
|
|
28
|
+
curvature: float = 312.5
|
|
29
|
+
|
|
30
|
+
def _input_validation(self, input_signal):
|
|
31
|
+
"""
|
|
32
|
+
Validates the input signal.
|
|
33
|
+
|
|
34
|
+
Parameters
|
|
35
|
+
----------
|
|
36
|
+
input_signal : np.ndarray, pd.Series, or list
|
|
37
|
+
|
|
38
|
+
Raises
|
|
39
|
+
------
|
|
40
|
+
TypeError: If input_signal is not a numpy array, pandas Series, or list.
|
|
41
|
+
ValueError: If input_signal contains non-numerical values.
|
|
42
|
+
"""
|
|
43
|
+
valid_types = (np.ndarray, pd.Series, list)
|
|
44
|
+
if not isinstance(input_signal, valid_types):
|
|
45
|
+
raise TypeError(f"input_signal must be one of the following types: {valid_types}, not {type(input_signal)}.")
|
|
46
|
+
|
|
47
|
+
input_array = np.array(input_signal)
|
|
48
|
+
if np.isnan(input_array).any():
|
|
49
|
+
raise ValueError("input_signal contains null values.")
|
|
50
|
+
|
|
51
|
+
if not np.issubdtype(input_array.dtype, np.number):
|
|
52
|
+
raise ValueError("input_signal should only contain numerical values.")
|
|
53
|
+
|
|
54
|
+
def _compute_hyperbolic_gaussian(self, l: int, n: int, time: np.ndarray) -> np.ndarray:
|
|
55
|
+
"""
|
|
56
|
+
Computes the hyperbolic Gaussian window.
|
|
57
|
+
|
|
58
|
+
Parameters
|
|
59
|
+
----------
|
|
60
|
+
l : int
|
|
61
|
+
length of the signal
|
|
62
|
+
n : int
|
|
63
|
+
frequency point
|
|
64
|
+
time : np.ndarray
|
|
65
|
+
time values of the signal
|
|
66
|
+
|
|
67
|
+
Returns
|
|
68
|
+
-------
|
|
69
|
+
g : np.ndarray
|
|
70
|
+
hyperbolic Gaussian window
|
|
71
|
+
"""
|
|
72
|
+
vectorf = np.arange(0, l)
|
|
73
|
+
vectorf1 = vectorf**2
|
|
74
|
+
lambdaf = self.forwardtaper
|
|
75
|
+
lambdab = self.backwardtaper
|
|
76
|
+
lambda_val = self.curvature
|
|
77
|
+
x = (lambdaf + lambdab) * time / (2 * lambdaf * lambdab) + (lambdaf - lambdab) * np.sqrt(time**2 + lambda_val) / (2 * lambdaf * lambdab)
|
|
78
|
+
x = np.tile(x, (1, 2)).T
|
|
79
|
+
vectorf2 = -vectorf1 * x**2 / (2 * n**2)
|
|
80
|
+
g = 2 * np.abs(vectorf) * np.exp(vectorf2) / ((lambdaf + lambdab) * np.sqrt(2 * np.pi))
|
|
81
|
+
return np.sum(g)
|
|
82
|
+
|
|
83
|
+
def fit_transform(self,
|
|
84
|
+
time_values: Union[pd.Series, np.ndarray, list],
|
|
85
|
+
input_signal: Union[pd.Series, np.ndarray, list],
|
|
86
|
+
minf: int = 0,
|
|
87
|
+
fsamplingrate: int = 1) -> np.ndarray:
|
|
88
|
+
"""
|
|
89
|
+
Computes the S-transform of the input signal.
|
|
90
|
+
|
|
91
|
+
Parameters
|
|
92
|
+
----------
|
|
93
|
+
time_values : np.ndarray
|
|
94
|
+
time values of the signal
|
|
95
|
+
input_signal : np.ndarray
|
|
96
|
+
input signal
|
|
97
|
+
minf : int
|
|
98
|
+
minimum frequency point
|
|
99
|
+
fsamplingrate : int
|
|
100
|
+
frequency sampling rate
|
|
101
|
+
|
|
102
|
+
Returns
|
|
103
|
+
-------
|
|
104
|
+
S : np.ndarray
|
|
105
|
+
S-transform of the input signal
|
|
106
|
+
"""
|
|
107
|
+
# Validate the input
|
|
108
|
+
self._input_validation(input_signal)
|
|
109
|
+
|
|
110
|
+
# Convert to numpy arrays if they are not array types
|
|
111
|
+
if not isinstance(time_values, np.ndarray):
|
|
112
|
+
time_values = np.array(time_values)
|
|
113
|
+
if not isinstance(input_signal, np.ndarray):
|
|
114
|
+
input_signal = np.array(input_signal)
|
|
115
|
+
|
|
116
|
+
n = len(input_signal)
|
|
117
|
+
# Make sure the max frequency to be optimized (Cover the 6th, 12th, or 18th harmonic respectively)
|
|
118
|
+
maxf = min(900, n // 2)
|
|
119
|
+
|
|
120
|
+
# Compute the fft of input
|
|
121
|
+
h = fft(input_signal)
|
|
122
|
+
h = np.concatenate((h, h))
|
|
123
|
+
|
|
124
|
+
# S output
|
|
125
|
+
s = np.zeros(((maxf - minf + 1) // fsamplingrate, n), dtype='complex')
|
|
126
|
+
s[0, :] = np.mean(input_signal) * (1 & np.arange(1, n + 1))
|
|
127
|
+
|
|
128
|
+
# Increment the frequency point
|
|
129
|
+
for k in range(fsamplingrate, maxf - minf + 1, fsamplingrate):
|
|
130
|
+
w_hy = self._compute_hyperbolic_gaussian(n, minf + k, time_values)
|
|
131
|
+
s[k // fsamplingrate, :] = ifft(h[minf + k + 1:minf + k + n+1] * w_hy)
|
|
132
|
+
|
|
133
|
+
return s
|
|
@@ -0,0 +1,38 @@
|
|
|
1
|
+
"""
|
|
2
|
+
This is the setup module for the HSTransform package. (Beta test)
|
|
3
|
+
|
|
4
|
+
S-transform with Hyperbolic Window
|
|
5
|
+
Combines the best properties of the Short-time Fourier Transform
|
|
6
|
+
and the Wavelet Transform.
|
|
7
|
+
"""
|
|
8
|
+
|
|
9
|
+
from setuptools import setup, find_packages
|
|
10
|
+
|
|
11
|
+
with open("README.md", "r", encoding="utf-8") as fh:
|
|
12
|
+
long_description = fh.read()
|
|
13
|
+
|
|
14
|
+
setup(
|
|
15
|
+
name='HSTransform',
|
|
16
|
+
version='0.1.1',
|
|
17
|
+
url='https://github.com/nvlinhvn/HSTransform',
|
|
18
|
+
packages=find_packages(),
|
|
19
|
+
license='MIT',
|
|
20
|
+
author='Linh V Nguyen',
|
|
21
|
+
author_email='linhvietnguyen.ee@gmail.com',
|
|
22
|
+
description='A Package to Compute S-transform with Hyperbolic Window',
|
|
23
|
+
python_requires='>=3.10',
|
|
24
|
+
long_description=long_description,
|
|
25
|
+
long_description_content_type="text/markdown",
|
|
26
|
+
install_requires=[
|
|
27
|
+
'numpy>=1.21.2',
|
|
28
|
+
'scipy>=1.7.1',
|
|
29
|
+
'pandas>=1.3.3',
|
|
30
|
+
'pytest>=6.2.5'
|
|
31
|
+
],
|
|
32
|
+
classifiers=[
|
|
33
|
+
'Development Status :: 4 - Beta',
|
|
34
|
+
'License :: OSI Approved :: MIT License',
|
|
35
|
+
'Programming Language :: Python :: 3.10',
|
|
36
|
+
],
|
|
37
|
+
test_suite='tests'
|
|
38
|
+
)
|
|
File without changes
|
|
@@ -0,0 +1,50 @@
|
|
|
1
|
+
"""
|
|
2
|
+
Unit Test for HS functions
|
|
3
|
+
- Test Gaussian Windowed
|
|
4
|
+
- Test HS-transform output
|
|
5
|
+
"""
|
|
6
|
+
import numpy as np
|
|
7
|
+
import pytest
|
|
8
|
+
from hstransform import HSTransform
|
|
9
|
+
|
|
10
|
+
def test_hyperbolic_gaussian():
|
|
11
|
+
"""
|
|
12
|
+
Tests aims to validate the output
|
|
13
|
+
of Gaussian Window of a time array
|
|
14
|
+
"""
|
|
15
|
+
# Create a sinusoidal signal
|
|
16
|
+
t = np.linspace(0, 1, 100)
|
|
17
|
+
|
|
18
|
+
# Compute the S-transform
|
|
19
|
+
st = HSTransform()
|
|
20
|
+
|
|
21
|
+
# Test the _compute_hyperbolic_gaussian method
|
|
22
|
+
result = st._compute_hyperbolic_gaussian(1000, 50, t)
|
|
23
|
+
assert isinstance(result, np.float64)
|
|
24
|
+
|
|
25
|
+
def test_fit_transform():
|
|
26
|
+
"""
|
|
27
|
+
Tests aims to validate the S-transform output
|
|
28
|
+
- shape
|
|
29
|
+
- type
|
|
30
|
+
- check any null
|
|
31
|
+
"""
|
|
32
|
+
# Create a sinusoidal signal
|
|
33
|
+
t = np.linspace(0, 2, 100)
|
|
34
|
+
signal = np.sin(2 * np.pi * 50 * t)
|
|
35
|
+
|
|
36
|
+
# Compute the S-transform
|
|
37
|
+
st = HSTransform()
|
|
38
|
+
s_transformed = st.fit_transform(t, signal)
|
|
39
|
+
|
|
40
|
+
# Add some assertions here to test the S-transform output
|
|
41
|
+
# Dimension
|
|
42
|
+
assert s_transformed.shape == (min(900, len(signal) // 2)+1, len(signal))
|
|
43
|
+
# Type of output
|
|
44
|
+
assert isinstance(s_transformed, np.ndarray)
|
|
45
|
+
assert np.issubdtype(s_transformed.dtype, np.complexfloating)
|
|
46
|
+
# any null
|
|
47
|
+
assert not np.isnan(s_transformed).any()
|
|
48
|
+
|
|
49
|
+
if __name__ == "__main__":
|
|
50
|
+
pytest.main()
|