FigCompose 0.1.1__tar.gz → 0.1.2__tar.gz
This diff represents the content of publicly available package versions that have been released to one of the supported registries. The information contained in this diff is provided for informational purposes only and reflects changes between package versions as they appear in their respective public registries.
- figcompose-0.1.2/FigCompose.egg-info/PKG-INFO +254 -0
- {figcompose-0.1.1 → figcompose-0.1.2}/FigCompose.egg-info/SOURCES.txt +70 -1
- {figcompose-0.1.1 → figcompose-0.1.2}/MANIFEST.in +2 -0
- figcompose-0.1.2/PKG-INFO +254 -0
- figcompose-0.1.2/README.md +222 -0
- figcompose-0.1.2/README.zh-CN.md +222 -0
- figcompose-0.1.2/REFERENCE.md +257 -0
- {figcompose-0.1.1 → figcompose-0.1.2}/data_visuals/__init__.py +1 -1
- {figcompose-0.1.1 → figcompose-0.1.2}/data_visuals/api.py +6 -3
- {figcompose-0.1.1 → figcompose-0.1.2}/data_visuals/charts/__init__.py +2 -0
- figcompose-0.1.2/data_visuals/charts/circular_bar.py +50 -0
- figcompose-0.1.2/data_visuals/compute/circular.py +194 -0
- {figcompose-0.1.1 → figcompose-0.1.2}/data_visuals/core/figure.py +24 -5
- {figcompose-0.1.1 → figcompose-0.1.2}/data_visuals/core/metadata.py +6 -0
- {figcompose-0.1.1 → figcompose-0.1.2}/data_visuals/layout/physical.py +19 -4
- {figcompose-0.1.1 → figcompose-0.1.2}/data_visuals/renderer/mpl/canvas.py +14 -9
- figcompose-0.1.2/data_visuals/renderer/mpl/charts/circular_bar.py +288 -0
- {figcompose-0.1.1 → figcompose-0.1.2}/data_visuals/renderer/mpl/charts/helpers.py +4 -9
- {figcompose-0.1.1 → figcompose-0.1.2}/data_visuals/renderer/mpl/charts/pie.py +3 -6
- {figcompose-0.1.1 → figcompose-0.1.2}/data_visuals/renderer/mpl/charts/registry.py +2 -0
- {figcompose-0.1.1 → figcompose-0.1.2}/data_visuals/renderer/mpl/config.py +23 -0
- figcompose-0.1.2/data_visuals/renderer/mpl/presentation.py +55 -0
- {figcompose-0.1.1 → figcompose-0.1.2}/data_visuals/utils/colors.py +18 -4
- figcompose-0.1.2/examples/README.md +39 -0
- figcompose-0.1.2/examples/_export.py +45 -0
- figcompose-0.1.2/examples/alluvial_flows/README.md +37 -0
- figcompose-0.1.2/examples/alluvial_flows/data.csv +18 -0
- figcompose-0.1.2/examples/alluvial_flows/figure.png +0 -0
- figcompose-0.1.2/examples/alluvial_flows/figure.svg +2548 -0
- figcompose-0.1.2/examples/alluvial_flows/generate.py +142 -0
- figcompose-0.1.2/examples/alluvial_flows/preview.png +0 -0
- figcompose-0.1.2/examples/alluvial_flows/style.yaml +12 -0
- figcompose-0.1.2/examples/chord_connections/README.md +36 -0
- figcompose-0.1.2/examples/chord_connections/data.csv +16 -0
- figcompose-0.1.2/examples/chord_connections/figure.png +0 -0
- figcompose-0.1.2/examples/chord_connections/figure.svg +2514 -0
- figcompose-0.1.2/examples/chord_connections/generate.py +156 -0
- figcompose-0.1.2/examples/chord_connections/preview.png +0 -0
- figcompose-0.1.2/examples/chord_connections/style.yaml +13 -0
- figcompose-0.1.2/examples/circular_scores/README.md +36 -0
- figcompose-0.1.2/examples/circular_scores/data.csv +41 -0
- figcompose-0.1.2/examples/circular_scores/figure.png +0 -0
- figcompose-0.1.2/examples/circular_scores/figure.svg +5118 -0
- figcompose-0.1.2/examples/circular_scores/generate.py +37 -0
- figcompose-0.1.2/examples/circular_scores/preview.png +0 -0
- figcompose-0.1.2/examples/circular_scores/style.yaml +37 -0
- figcompose-0.1.2/examples/clustered_heatmap/README.md +34 -0
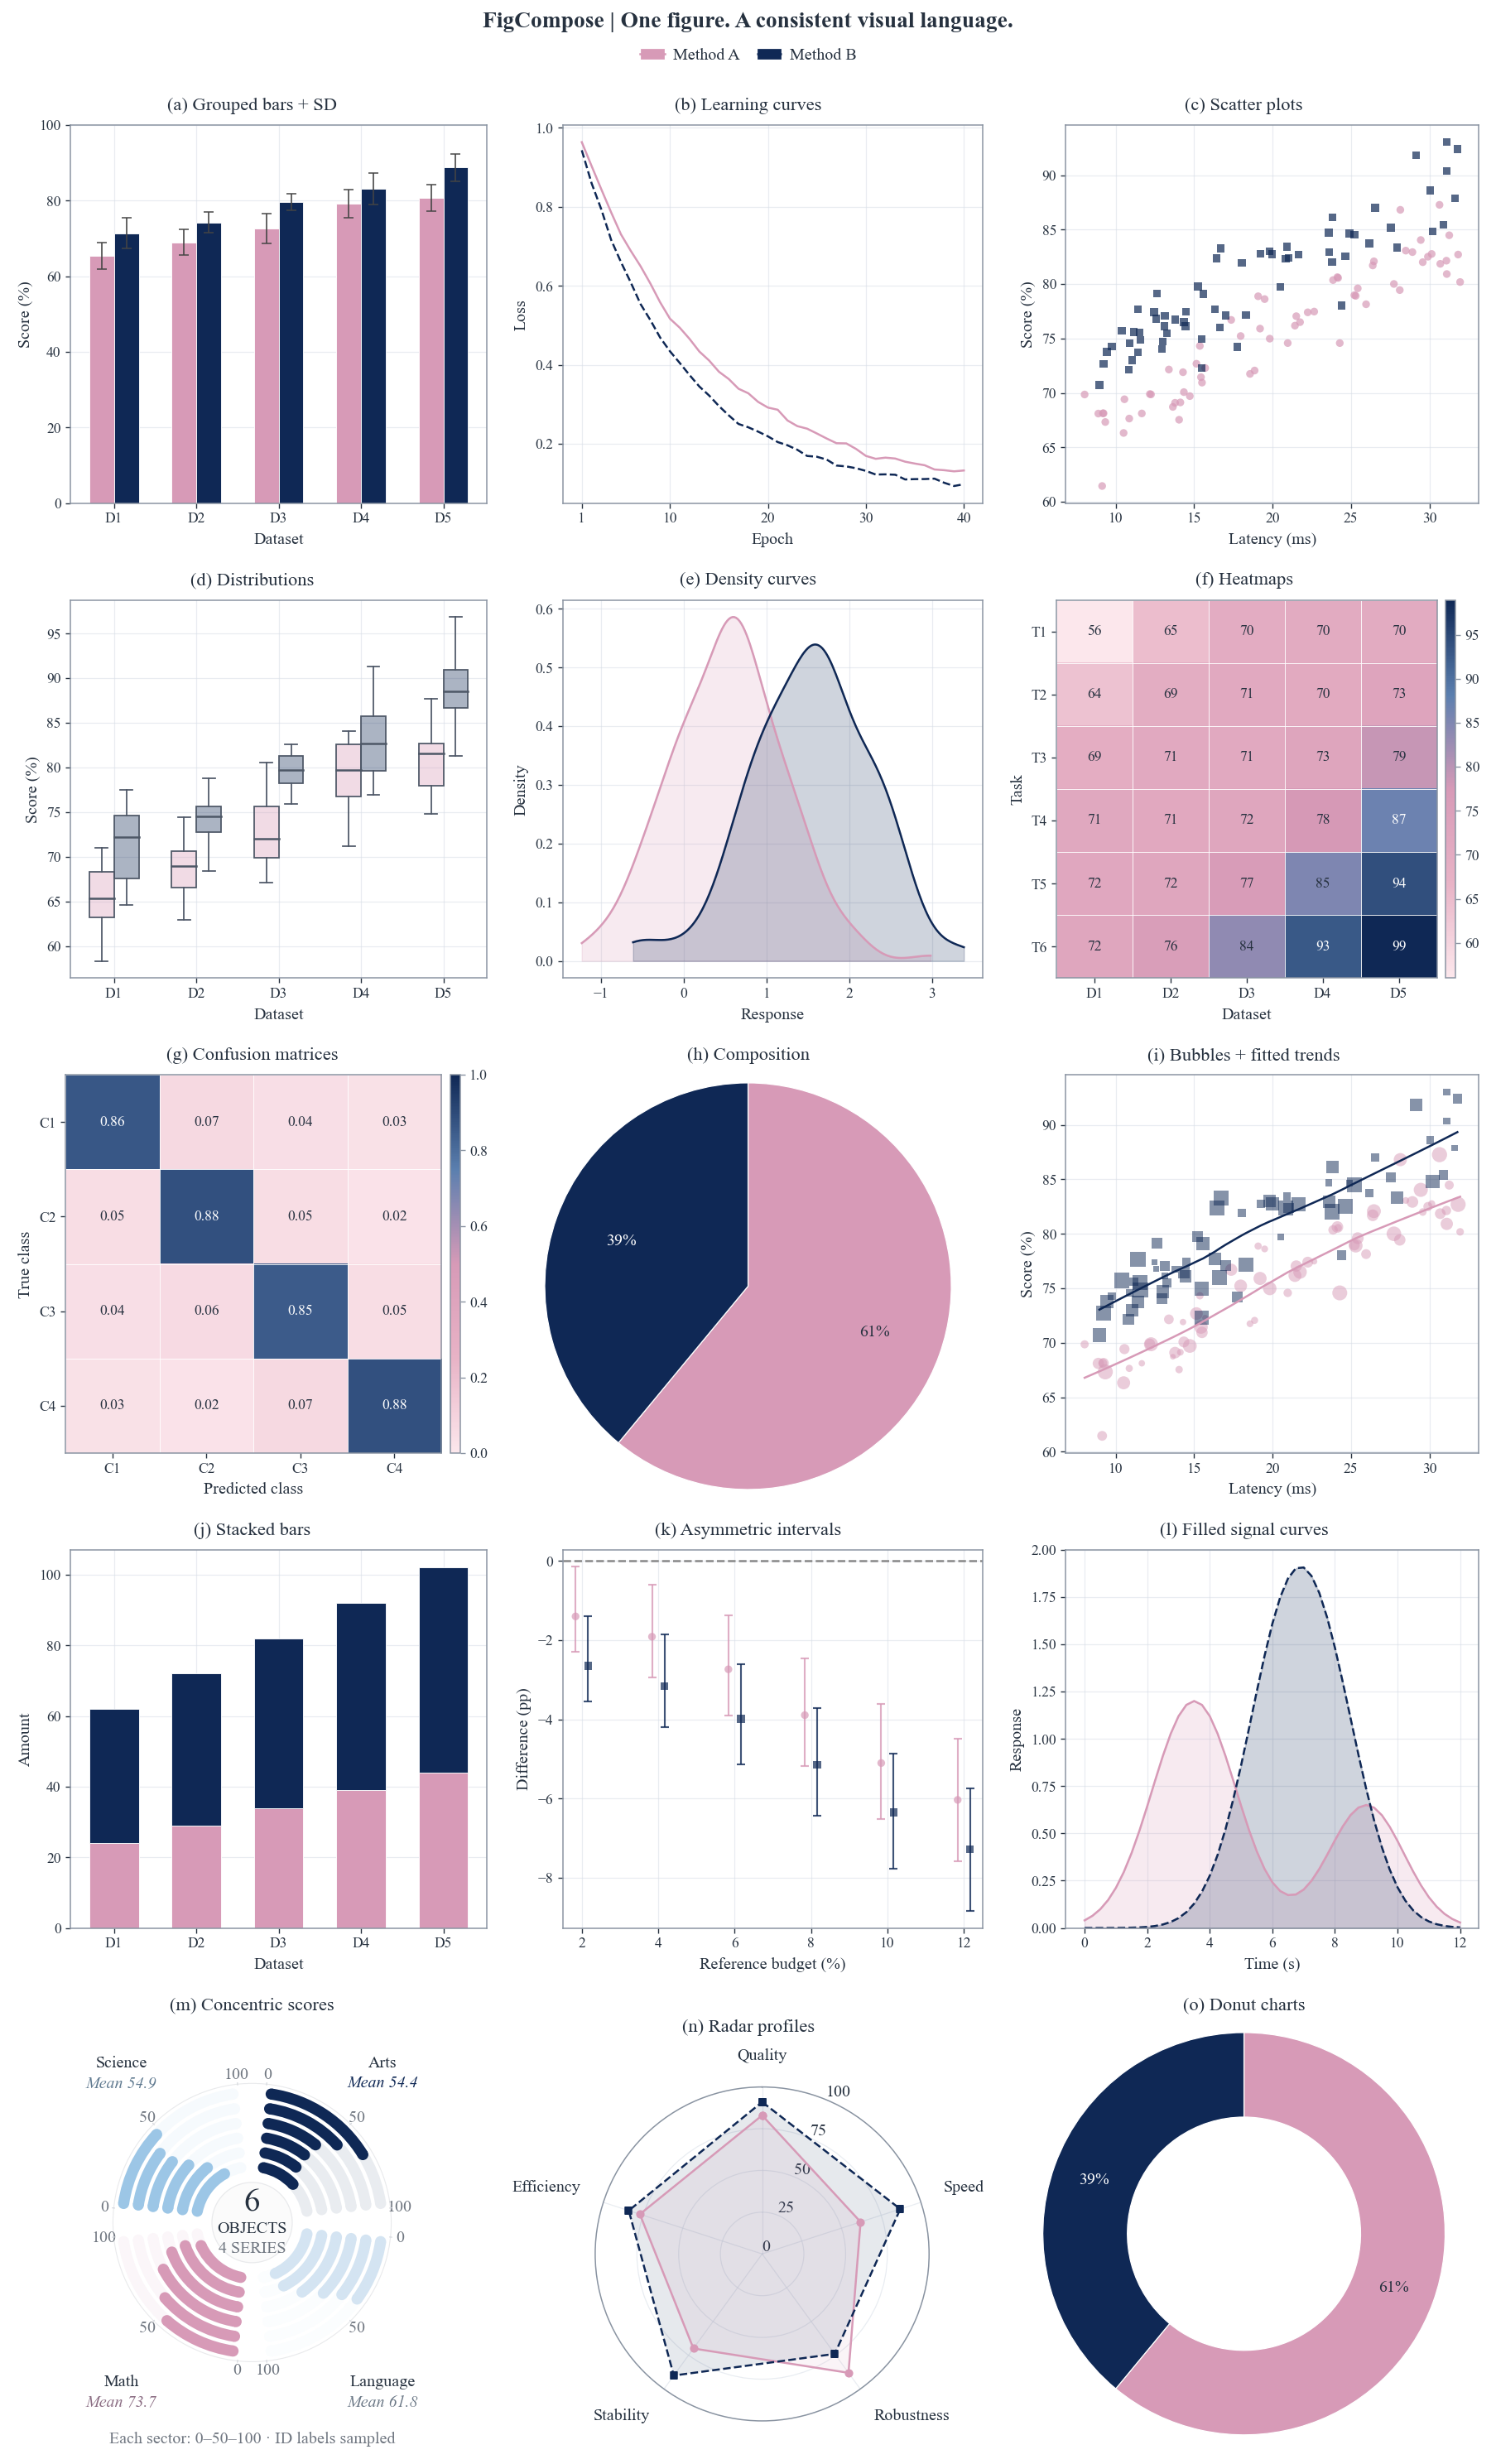
- figcompose-0.1.2/examples/clustered_heatmap/data.csv +33 -0
- figcompose-0.1.2/examples/clustered_heatmap/figure.png +0 -0
- figcompose-0.1.2/examples/clustered_heatmap/figure.svg +6068 -0
- figcompose-0.1.2/examples/clustered_heatmap/generate.py +53 -0
- figcompose-0.1.2/examples/clustered_heatmap/panel.py +157 -0
- figcompose-0.1.2/examples/clustered_heatmap/preview.png +0 -0
- figcompose-0.1.2/examples/clustered_heatmap/style.yaml +20 -0
- figcompose-0.1.2/examples/intervals/README.md +41 -0
- figcompose-0.1.2/examples/intervals/asymmetric_demo.csv +16 -0
- figcompose-0.1.2/examples/intervals/data.csv +16 -0
- figcompose-0.1.2/examples/intervals/figure.png +0 -0
- figcompose-0.1.2/examples/intervals/figure.svg +2403 -0
- figcompose-0.1.2/examples/intervals/generate.py +54 -0
- figcompose-0.1.2/examples/intervals/paired.csv +601 -0
- figcompose-0.1.2/examples/intervals/preview.png +0 -0
- figcompose-0.1.2/examples/intervals/recompute.py +32 -0
- figcompose-0.1.2/examples/intervals/style.yaml +47 -0
- figcompose-0.1.2/examples/mixed_figure/README.md +29 -0
- figcompose-0.1.2/examples/mixed_figure/data.csv +361 -0
- figcompose-0.1.2/examples/mixed_figure/figure.png +0 -0
- figcompose-0.1.2/examples/mixed_figure/figure.svg +4167 -0
- figcompose-0.1.2/examples/mixed_figure/generate.py +62 -0
- figcompose-0.1.2/examples/mixed_figure/preview.png +0 -0
- figcompose-0.1.2/examples/mixed_figure/style.yaml +55 -0
- figcompose-0.1.2/examples/mixed_figure/subset.csv +241 -0
- figcompose-0.1.2/examples/participant_tracks/README.md +37 -0
- figcompose-0.1.2/examples/participant_tracks/data.csv +73 -0
- figcompose-0.1.2/examples/participant_tracks/figure.png +0 -0
- figcompose-0.1.2/examples/participant_tracks/figure.svg +10050 -0
- figcompose-0.1.2/examples/participant_tracks/generate.py +58 -0
- figcompose-0.1.2/examples/participant_tracks/panel.py +174 -0
- figcompose-0.1.2/examples/participant_tracks/preview.png +0 -0
- figcompose-0.1.2/examples/participant_tracks/style.yaml +43 -0
- figcompose-0.1.2/examples/three_dimensional_views/README.md +37 -0
- figcompose-0.1.2/examples/three_dimensional_views/data.csv +419 -0
- figcompose-0.1.2/examples/three_dimensional_views/figure.png +0 -0
- figcompose-0.1.2/examples/three_dimensional_views/figure.svg +7616 -0
- figcompose-0.1.2/examples/three_dimensional_views/generate.py +181 -0
- figcompose-0.1.2/examples/three_dimensional_views/preview.png +0 -0
- figcompose-0.1.2/examples/three_dimensional_views/style.yaml +35 -0
- {figcompose-0.1.1 → figcompose-0.1.2}/pyproject.toml +2 -1
- figcompose-0.1.1/FigCompose.egg-info/PKG-INFO +0 -364
- figcompose-0.1.1/PKG-INFO +0 -364
- figcompose-0.1.1/README.md +0 -333
- figcompose-0.1.1/README.zh-CN.md +0 -316
- {figcompose-0.1.1 → figcompose-0.1.2}/FigCompose.egg-info/dependency_links.txt +0 -0
- {figcompose-0.1.1 → figcompose-0.1.2}/FigCompose.egg-info/requires.txt +0 -0
- {figcompose-0.1.1 → figcompose-0.1.2}/FigCompose.egg-info/top_level.txt +0 -0
- {figcompose-0.1.1 → figcompose-0.1.2}/LICENSE +0 -0
- {figcompose-0.1.1 → figcompose-0.1.2}/data_visuals/charts/bar.py +0 -0
- {figcompose-0.1.1 → figcompose-0.1.2}/data_visuals/charts/box.py +0 -0
- {figcompose-0.1.1 → figcompose-0.1.2}/data_visuals/charts/confusion.py +0 -0
- {figcompose-0.1.1 → figcompose-0.1.2}/data_visuals/charts/heatmap.py +0 -0
- {figcompose-0.1.1 → figcompose-0.1.2}/data_visuals/charts/histogram.py +0 -0
- {figcompose-0.1.1 → figcompose-0.1.2}/data_visuals/charts/line.py +0 -0
- {figcompose-0.1.1 → figcompose-0.1.2}/data_visuals/charts/pie.py +0 -0
- {figcompose-0.1.1 → figcompose-0.1.2}/data_visuals/charts/radar.py +0 -0
- {figcompose-0.1.1 → figcompose-0.1.2}/data_visuals/charts/scatter.py +0 -0
- {figcompose-0.1.1 → figcompose-0.1.2}/data_visuals/compute/__init__.py +0 -0
- {figcompose-0.1.1 → figcompose-0.1.2}/data_visuals/compute/aggregation.py +0 -0
- {figcompose-0.1.1 → figcompose-0.1.2}/data_visuals/compute/preprocess.py +0 -0
- {figcompose-0.1.1 → figcompose-0.1.2}/data_visuals/compute/statistics.py +0 -0
- {figcompose-0.1.1 → figcompose-0.1.2}/data_visuals/core/__init__.py +0 -0
- {figcompose-0.1.1 → figcompose-0.1.2}/data_visuals/core/canvas.py +0 -0
- {figcompose-0.1.1 → figcompose-0.1.2}/data_visuals/core/config.py +0 -0
- {figcompose-0.1.1 → figcompose-0.1.2}/data_visuals/core/facets.py +0 -0
- {figcompose-0.1.1 → figcompose-0.1.2}/data_visuals/core/identity.py +0 -0
- {figcompose-0.1.1 → figcompose-0.1.2}/data_visuals/core/legend.py +0 -0
- {figcompose-0.1.1 → figcompose-0.1.2}/data_visuals/core/panel.py +0 -0
- {figcompose-0.1.1 → figcompose-0.1.2}/data_visuals/core/quality.py +0 -0
- {figcompose-0.1.1 → figcompose-0.1.2}/data_visuals/core/regression.py +0 -0
- {figcompose-0.1.1 → figcompose-0.1.2}/data_visuals/core/spec.py +0 -0
- {figcompose-0.1.1 → figcompose-0.1.2}/data_visuals/data/__init__.py +0 -0
- {figcompose-0.1.1 → figcompose-0.1.2}/data_visuals/data/labels.py +0 -0
- {figcompose-0.1.1 → figcompose-0.1.2}/data_visuals/data/loader.py +0 -0
- {figcompose-0.1.1 → figcompose-0.1.2}/data_visuals/data/schema.py +0 -0
- {figcompose-0.1.1 → figcompose-0.1.2}/data_visuals/data/transform.py +0 -0
- {figcompose-0.1.1 → figcompose-0.1.2}/data_visuals/layout/__init__.py +0 -0
- {figcompose-0.1.1 → figcompose-0.1.2}/data_visuals/layout/auto.py +0 -0
- {figcompose-0.1.1 → figcompose-0.1.2}/data_visuals/layout/grid.py +0 -0
- {figcompose-0.1.1 → figcompose-0.1.2}/data_visuals/layout/manager.py +0 -0
- {figcompose-0.1.1 → figcompose-0.1.2}/data_visuals/layout/panels.py +0 -0
- {figcompose-0.1.1 → figcompose-0.1.2}/data_visuals/layout/placement.py +0 -0
- {figcompose-0.1.1 → figcompose-0.1.2}/data_visuals/layout/shared.py +0 -0
- {figcompose-0.1.1 → figcompose-0.1.2}/data_visuals/layout/sizing.py +0 -0
- {figcompose-0.1.1 → figcompose-0.1.2}/data_visuals/renderer/__init__.py +0 -0
- {figcompose-0.1.1 → figcompose-0.1.2}/data_visuals/renderer/export.py +0 -0
- {figcompose-0.1.1 → figcompose-0.1.2}/data_visuals/renderer/mpl/__init__.py +0 -0
- {figcompose-0.1.1 → figcompose-0.1.2}/data_visuals/renderer/mpl/annotations.py +0 -0
- {figcompose-0.1.1 → figcompose-0.1.2}/data_visuals/renderer/mpl/axes.py +0 -0
- {figcompose-0.1.1 → figcompose-0.1.2}/data_visuals/renderer/mpl/charts/__init__.py +0 -0
- {figcompose-0.1.1 → figcompose-0.1.2}/data_visuals/renderer/mpl/charts/bar.py +0 -0
- {figcompose-0.1.1 → figcompose-0.1.2}/data_visuals/renderer/mpl/charts/box.py +0 -0
- {figcompose-0.1.1 → figcompose-0.1.2}/data_visuals/renderer/mpl/charts/confusion.py +0 -0
- {figcompose-0.1.1 → figcompose-0.1.2}/data_visuals/renderer/mpl/charts/heatmap.py +0 -0
- {figcompose-0.1.1 → figcompose-0.1.2}/data_visuals/renderer/mpl/charts/histogram.py +0 -0
- {figcompose-0.1.1 → figcompose-0.1.2}/data_visuals/renderer/mpl/charts/line.py +0 -0
- {figcompose-0.1.1 → figcompose-0.1.2}/data_visuals/renderer/mpl/charts/radar.py +0 -0
- {figcompose-0.1.1 → figcompose-0.1.2}/data_visuals/renderer/mpl/charts/scatter.py +0 -0
- {figcompose-0.1.1 → figcompose-0.1.2}/data_visuals/renderer/mpl/custom.py +0 -0
- {figcompose-0.1.1 → figcompose-0.1.2}/data_visuals/renderer/mpl/export.py +0 -0
- {figcompose-0.1.1 → figcompose-0.1.2}/data_visuals/renderer/mpl/facets.py +0 -0
- {figcompose-0.1.1 → figcompose-0.1.2}/data_visuals/renderer/mpl/legends.py +0 -0
- {figcompose-0.1.1 → figcompose-0.1.2}/data_visuals/renderer/mpl/quality.py +0 -0
- {figcompose-0.1.1 → figcompose-0.1.2}/data_visuals/renderer/mpl/styling.py +0 -0
- {figcompose-0.1.1 → figcompose-0.1.2}/data_visuals/themes/__init__.py +0 -0
- {figcompose-0.1.1 → figcompose-0.1.2}/data_visuals/themes/general.json +0 -0
- {figcompose-0.1.1 → figcompose-0.1.2}/data_visuals/themes/modern.json +0 -0
- {figcompose-0.1.1 → figcompose-0.1.2}/data_visuals/utils/__init__.py +0 -0
- {figcompose-0.1.1 → figcompose-0.1.2}/setup.cfg +0 -0
|
@@ -0,0 +1,254 @@
|
|
|
1
|
+
Metadata-Version: 2.4
|
|
2
|
+
Name: FigCompose
|
|
3
|
+
Version: 0.1.2
|
|
4
|
+
Summary: FigCompose — rule-driven publication-quality visualization engine for researchers
|
|
5
|
+
Author: FigCompose contributors
|
|
6
|
+
License-Expression: Apache-2.0
|
|
7
|
+
Project-URL: Homepage, https://github.com/frederickc8896-Fabulous/FigCompose
|
|
8
|
+
Project-URL: Repository, https://github.com/frederickc8896-Fabulous/FigCompose
|
|
9
|
+
Project-URL: Issues, https://github.com/frederickc8896-Fabulous/FigCompose/issues
|
|
10
|
+
Keywords: visualization,matplotlib,research,paper,publication
|
|
11
|
+
Classifier: Development Status :: 3 - Alpha
|
|
12
|
+
Classifier: Intended Audience :: Science/Research
|
|
13
|
+
Classifier: Topic :: Scientific/Engineering :: Visualization
|
|
14
|
+
Classifier: Framework :: Matplotlib
|
|
15
|
+
Classifier: Programming Language :: Python :: 3.10
|
|
16
|
+
Classifier: Programming Language :: Python :: 3.11
|
|
17
|
+
Classifier: Programming Language :: Python :: 3.12
|
|
18
|
+
Requires-Python: >=3.10
|
|
19
|
+
Description-Content-Type: text/markdown
|
|
20
|
+
License-File: LICENSE
|
|
21
|
+
Requires-Dist: numpy>=1.23.5
|
|
22
|
+
Requires-Dist: cycler>=0.10
|
|
23
|
+
Requires-Dist: pandas>=2.0
|
|
24
|
+
Requires-Dist: matplotlib>=3.7
|
|
25
|
+
Requires-Dist: pyyaml>=6.0
|
|
26
|
+
Requires-Dist: scipy>=1.10
|
|
27
|
+
Requires-Dist: statsmodels>=0.14
|
|
28
|
+
Provides-Extra: dev
|
|
29
|
+
Requires-Dist: pytest>=7; extra == "dev"
|
|
30
|
+
Requires-Dist: pytest-cov; extra == "dev"
|
|
31
|
+
Dynamic: license-file
|
|
32
|
+
|
|
33
|
+
# FigCompose
|
|
34
|
+
|
|
35
|
+
<p>
|
|
36
|
+
<img src="https://raw.githubusercontent.com/frederickc8896-Fabulous/FigCompose/main/assets/branding/figcompose-logo-v1.png" alt="FigCompose logo" width="460">
|
|
37
|
+
</p>
|
|
38
|
+
|
|
39
|
+
**English** | [简体中文](https://github.com/frederickc8896-Fabulous/FigCompose/blob/main/README.zh-CN.md)
|
|
40
|
+
|
|
41
|
+
[](https://pypi.org/project/FigCompose/)
|
|
42
|
+
[](https://pypi.org/project/FigCompose/)
|
|
43
|
+
[](https://github.com/frederickc8896-Fabulous/FigCompose/blob/main/LICENSE)
|
|
44
|
+
|
|
45
|
+
**Choose your data and charts. Let FigCompose handle the figure layout.**
|
|
46
|
+
|
|
47
|
+
|
|
48
|
+
|
|
49
|
+
**11 built-in chart types, 15 panels, one consistent configuration.** Generated directly with FigCompose 0.1.2 using synthetic data.
|
|
50
|
+
[View SVG](https://github.com/frederickc8896-Fabulous/FigCompose/blob/main/assets/readme/hero_gallery.svg) · [Reproduce this figure](https://github.com/frederickc8896-Fabulous/FigCompose/blob/main/assets/readme/hero.py)
|
|
51
|
+
|
|
52
|
+
Start with a CSV or DataFrame, choose metrics, chart types and a style, and keep fonts, colors, legends and spacing consistent throughout the figure.
|
|
53
|
+
When results change, reuse the same visual settings with less manual adjustment.
|
|
54
|
+
|
|
55
|
+
- **Less tweaking, less repeated work**: arrange common charts and decoration spacing automatically, reducing repeated font, legend and margin adjustments.
|
|
56
|
+
- **Built-in curated palettes**: 13 categorical palettes and 5 continuous scales, with warm, cool and mixed color combinations.
|
|
57
|
+
- **Consistent colors across your paper**: register your series to retain each model's colors, markers and line styles across CSVs. When a model is absent, the others keep their identities.
|
|
58
|
+
- **Different charts, one layout**: combine bars, lines, scatter plots, heatmaps and more in one figure with consistent fonts, colors and shared legends.
|
|
59
|
+
- **Export at publication dimensions**: set the width in mm or inches and let height adapt to the content. Font sizes use pt; export to PDF, SVG or PNG.
|
|
60
|
+
- **Keep Matplotlib's flexibility**: custom diagrams, polar plots and 3D plots can join the same layout framework. Figure checks help find overflow and tick collisions.
|
|
61
|
+
|
|
62
|
+
[Quick start](#quick-start) · [Chart types](#supported-charts) · [Paper configuration](#one-configuration-for-an-entire-paper) · [Color catalog](#color-catalog) · [Detailed usage](https://github.com/frederickc8896-Fabulous/FigCompose/blob/main/REFERENCE.md)
|
|
63
|
+
|
|
64
|
+
## Installation
|
|
65
|
+
|
|
66
|
+
Requires Python 3.10+:
|
|
67
|
+
|
|
68
|
+
```bash
|
|
69
|
+
python -m pip install FigCompose
|
|
70
|
+
```
|
|
71
|
+
|
|
72
|
+
The package is named **FigCompose**; Python imports use `data_visuals`.
|
|
73
|
+
**FigCompose 0.1.2** includes the circular-bar chart and all 13 palettes shown here. Upgrade older installations with `python -m pip install --upgrade FigCompose`.
|
|
74
|
+
The default font is **Times New Roman**, supplied by your system; other serif fonts are used as fallbacks.
|
|
75
|
+
|
|
76
|
+
<details>
|
|
77
|
+
<summary>Install the latest source or update an existing installation</summary>
|
|
78
|
+
|
|
79
|
+
Install the source to use the latest chart types and palettes:
|
|
80
|
+
|
|
81
|
+
```bash
|
|
82
|
+
git clone https://github.com/frederickc8896-Fabulous/FigCompose.git
|
|
83
|
+
cd FigCompose
|
|
84
|
+
python -m pip install -e .
|
|
85
|
+
```
|
|
86
|
+
|
|
87
|
+
Update an existing source installation from the repository directory:
|
|
88
|
+
|
|
89
|
+
```bash
|
|
90
|
+
git pull --ff-only
|
|
91
|
+
python -m pip install -e .
|
|
92
|
+
```
|
|
93
|
+
|
|
94
|
+
Update a PyPI installation:
|
|
95
|
+
|
|
96
|
+
```bash
|
|
97
|
+
python -m pip install --upgrade FigCompose
|
|
98
|
+
```
|
|
99
|
+
|
|
100
|
+
</details>
|
|
101
|
+
|
|
102
|
+
## Quick start
|
|
103
|
+
|
|
104
|
+
This example runs as written. For your own data, replace `data` with a CSV path such as `"results.csv"`, with a header row, then select the corresponding column names.
|
|
105
|
+
|
|
106
|
+
```python
|
|
107
|
+
import pandas as pd
|
|
108
|
+
from data_visuals import plot
|
|
109
|
+
|
|
110
|
+
data = pd.DataFrame({
|
|
111
|
+
"dataset": ["A", "A", "B", "B"],
|
|
112
|
+
"model": ["Base", "Ours", "Base", "Ours"],
|
|
113
|
+
"accuracy": [0.78, 0.86, 0.81, 0.89],
|
|
114
|
+
"latency": [14.0, 10.0, 15.0, 11.0],
|
|
115
|
+
})
|
|
116
|
+
|
|
117
|
+
fig = plot(
|
|
118
|
+
data, # Or "results.csv"
|
|
119
|
+
x="dataset", group="model",
|
|
120
|
+
plots=[
|
|
121
|
+
{"kind": "bar", "metric": "accuracy", "title": "(a) Accuracy",
|
|
122
|
+
"chart_opts": {"ylabel": "Accuracy (%)", "yformat": ".0%"}},
|
|
123
|
+
{"kind": "line", "metric": "latency", "title": "(b) Latency",
|
|
124
|
+
"chart_opts": {"ylabel": "Latency (ms)", "yformat": ".0f"}},
|
|
125
|
+
],
|
|
126
|
+
canvas={"width": 180},
|
|
127
|
+
style="modern", palette="curated-5-warm",
|
|
128
|
+
title="Model comparison",
|
|
129
|
+
legend={"scope": "shared", "ncols": 2},
|
|
130
|
+
)
|
|
131
|
+
fig.render("figure.pdf")
|
|
132
|
+
fig.render("figure.png", dpi=300)
|
|
133
|
+
```
|
|
134
|
+
|
|
135
|
+
For everyday use, focus on these settings:
|
|
136
|
+
|
|
137
|
+
| Setting | What to choose |
|
|
138
|
+
|---|---|
|
|
139
|
+
| `data` | A CSV path or DataFrame |
|
|
140
|
+
| `x` / `group` | X-axis and grouping columns, such as dataset and model |
|
|
141
|
+
| `plots` | One entry per panel, selecting a chart `kind` and `metric` |
|
|
142
|
+
| `canvas` | The whole figure's width, in mm by default; omit height to solve it automatically |
|
|
143
|
+
| `style` / `palette` | A visual style and palette, such as `modern` / `curated-5-warm` |
|
|
144
|
+
|
|
145
|
+
Use `cols=2` to limit panels per row. Shared legends default to below the main title and above the panels; position, columns and font size remain adjustable.
|
|
146
|
+
For proportions, `.0%` displays 0–1 as percentages; use `{x:.0f}%` for values already on a 0–100 scale.
|
|
147
|
+
A fixed width and height will not silently shrink fonts; if the content cannot fit, you are prompted to adjust the dimensions.
|
|
148
|
+
|
|
149
|
+
### Ask AI to write the call
|
|
150
|
+
|
|
151
|
+
Give your AI assistant the column names, data units and what you want to show, and ask it to use FigCompose's concise API. For example:
|
|
152
|
+
|
|
153
|
+
> Use FigCompose (`from data_visuals import plot`) to read `results.csv`. Its columns are `dataset`, `model`, `accuracy` (0–1) and `latency` (ms). Group by model and draw an accuracy bar chart and a latency line chart, with two panels per row. Set the figure width to 180 mm with automatic height, use the `modern` style and `curated-5-warm` palette, place the shared legend below the title, and export PDF and 300 dpi PNG.
|
|
154
|
+
|
|
155
|
+
For more complex settings, give your assistant the [API reference](https://github.com/frederickc8896-Fabulous/FigCompose/blob/main/REFERENCE.md) as well.
|
|
156
|
+
|
|
157
|
+
## Ready-to-run examples
|
|
158
|
+
|
|
159
|
+
Download or clone the repository, install FigCompose 0.1.2+, and run a complete example. Each folder includes its actual CSV, saved style, code and expected image.
|
|
160
|
+
|
|
161
|
+
| Start here | What you can reproduce |
|
|
162
|
+
|---|---|
|
|
163
|
+
| [Mixed figure](https://github.com/frederickc8896-Fabulous/FigCompose/tree/main/examples/mixed_figure) | Four charts with stable method identities across two CSVs |
|
|
164
|
+
| [Differences and intervals](https://github.com/frederickc8896-Fabulous/FigCompose/tree/main/examples/intervals) | Paired estimates, confidence intervals and supplied asymmetric bounds |
|
|
165
|
+
| [Concentric scores](https://github.com/frederickc8896-Fabulous/FigCompose/tree/main/examples/circular_scores) | The native circular-bar chart, with 40 scores and independent scales |
|
|
166
|
+
|
|
167
|
+
Run, for example, `python examples/circular_scores/generate.py --out output/circular`.
|
|
168
|
+
[Browse all eight examples](https://github.com/frederickc8896-Fabulous/FigCompose/blob/main/examples/README.md), including ready-made custom templates for participant tracks, circular clustering, 2D/3D comparisons, chord diagrams and alluvial flows.
|
|
169
|
+
|
|
170
|
+
## Supported charts
|
|
171
|
+
|
|
172
|
+
| Chart | `kind` | Common uses |
|
|
173
|
+
|---|---|---|
|
|
174
|
+
| Bar | `bar` | Grouped, horizontal, stacked and percentage-stacked bars; error bars |
|
|
175
|
+
| Line | `line` | Trends, markers, step lines and area fill |
|
|
176
|
+
| Scatter | `scatter` | Points, bubbles and precomputed differences with intervals |
|
|
177
|
+
| Box | `box` | Grouped distributions, horizontal boxes and outliers |
|
|
178
|
+
| Histogram | `histogram` | Distributions, density curves and cumulative distributions |
|
|
179
|
+
| Heatmap | `heatmap` | Metric matrices and value annotations |
|
|
180
|
+
| Confusion matrix | `confusion` | Counts, supplied quantities and row normalization |
|
|
181
|
+
| Pie / donut | `pie` / `donut` | Category shares |
|
|
182
|
+
| Radar | `radar` | Comparing profiles across metrics |
|
|
183
|
+
| Concentric circular bars | `circular_bar` | Independent metric scores for multiple objects and group means |
|
|
184
|
+
|
|
185
|
+
For repeated observations, bars, lines, radar plots and heatmaps default to means within their respective groups. Pie and donut charts sum values by category, or count rows when the value column is omitted; scatter plots retain observations.
|
|
186
|
+
Circular bars use independent score scales rather than shares of a total. Repeated object/metric pairs require an explicit aggregation choice.
|
|
187
|
+
See the [API reference](https://github.com/frederickc8896-Fabulous/FigCompose/blob/main/REFERENCE.md) for statistical definitions, data formats and custom Matplotlib panel examples.
|
|
188
|
+
|
|
189
|
+
## One configuration for an entire paper
|
|
190
|
+
|
|
191
|
+
Save fonts, palettes, metric display names and model identities once, then use the same `paper.yaml` for subsequent figures.
|
|
192
|
+
Continuing with `data` from the quick start, the complete data and a subset without the baseline retain the same model colors and markers:
|
|
193
|
+
|
|
194
|
+
```python
|
|
195
|
+
from data_visuals import FigureConfig, plot
|
|
196
|
+
|
|
197
|
+
paper = FigureConfig(
|
|
198
|
+
canvas={"width": 180}, theme="modern", palette="curated-5-warm",
|
|
199
|
+
font_family="Times New Roman",
|
|
200
|
+
legend={"scope": "shared", "ncols": 2},
|
|
201
|
+
fields={"accuracy": {"label": "Accuracy", "unit": "%", "format": ".0%"}},
|
|
202
|
+
series={"model": [
|
|
203
|
+
{"id": "Base", "label": "Baseline", "marker": "o", "linestyle": "--"},
|
|
204
|
+
{"id": "Ours", "label": "Our method", "marker": "D", "linestyle": "-"},
|
|
205
|
+
]},
|
|
206
|
+
)
|
|
207
|
+
paper.save("paper.yaml")
|
|
208
|
+
|
|
209
|
+
for name, frame in [("all", data), ("subset", data[data.model != "Base"])]:
|
|
210
|
+
plot(frame, config=paper, x="dataset", group="model",
|
|
211
|
+
plots=[{"kind": "line", "metric": "accuracy"}],
|
|
212
|
+
title="Model comparison").render(f"{name}.pdf")
|
|
213
|
+
|
|
214
|
+
# In a later script: paper = FigureConfig.load("paper.yaml")
|
|
215
|
+
```
|
|
216
|
+
|
|
217
|
+
To check a figure, run this on `fig` from the quick start:
|
|
218
|
+
|
|
219
|
+
```python
|
|
220
|
+
report = fig.check(debug="layout_check.png")
|
|
221
|
+
print(report.summary())
|
|
222
|
+
```
|
|
223
|
+
|
|
224
|
+
The inspection image highlights text overflow, tick collisions and small fonts; normal exports contain no inspection marks. Checks and layout snapshots help review presentation; researchers still choose the chart types, statistical definitions and scientific message.
|
|
225
|
+
|
|
226
|
+
## More usage
|
|
227
|
+
|
|
228
|
+
The [API reference](https://github.com/frederickc8896-Fabulous/FigCompose/blob/main/REFERENCE.md) covers axes, legends, paper configurations, circular bars, custom Matplotlib panels and layout snapshots for advanced use or for your AI assistant to consult.
|
|
229
|
+
FigCompose is currently in Alpha; interfaces are still evolving.
|
|
230
|
+
|
|
231
|
+
## License
|
|
232
|
+
|
|
233
|
+
FigCompose is licensed under the [Apache License 2.0](https://github.com/frederickc8896-Fabulous/FigCompose/blob/main/LICENSE).
|
|
234
|
+
|
|
235
|
+
## Color catalog
|
|
236
|
+
|
|
237
|
+
### Categorical colors and figure presets
|
|
238
|
+
|
|
239
|
+
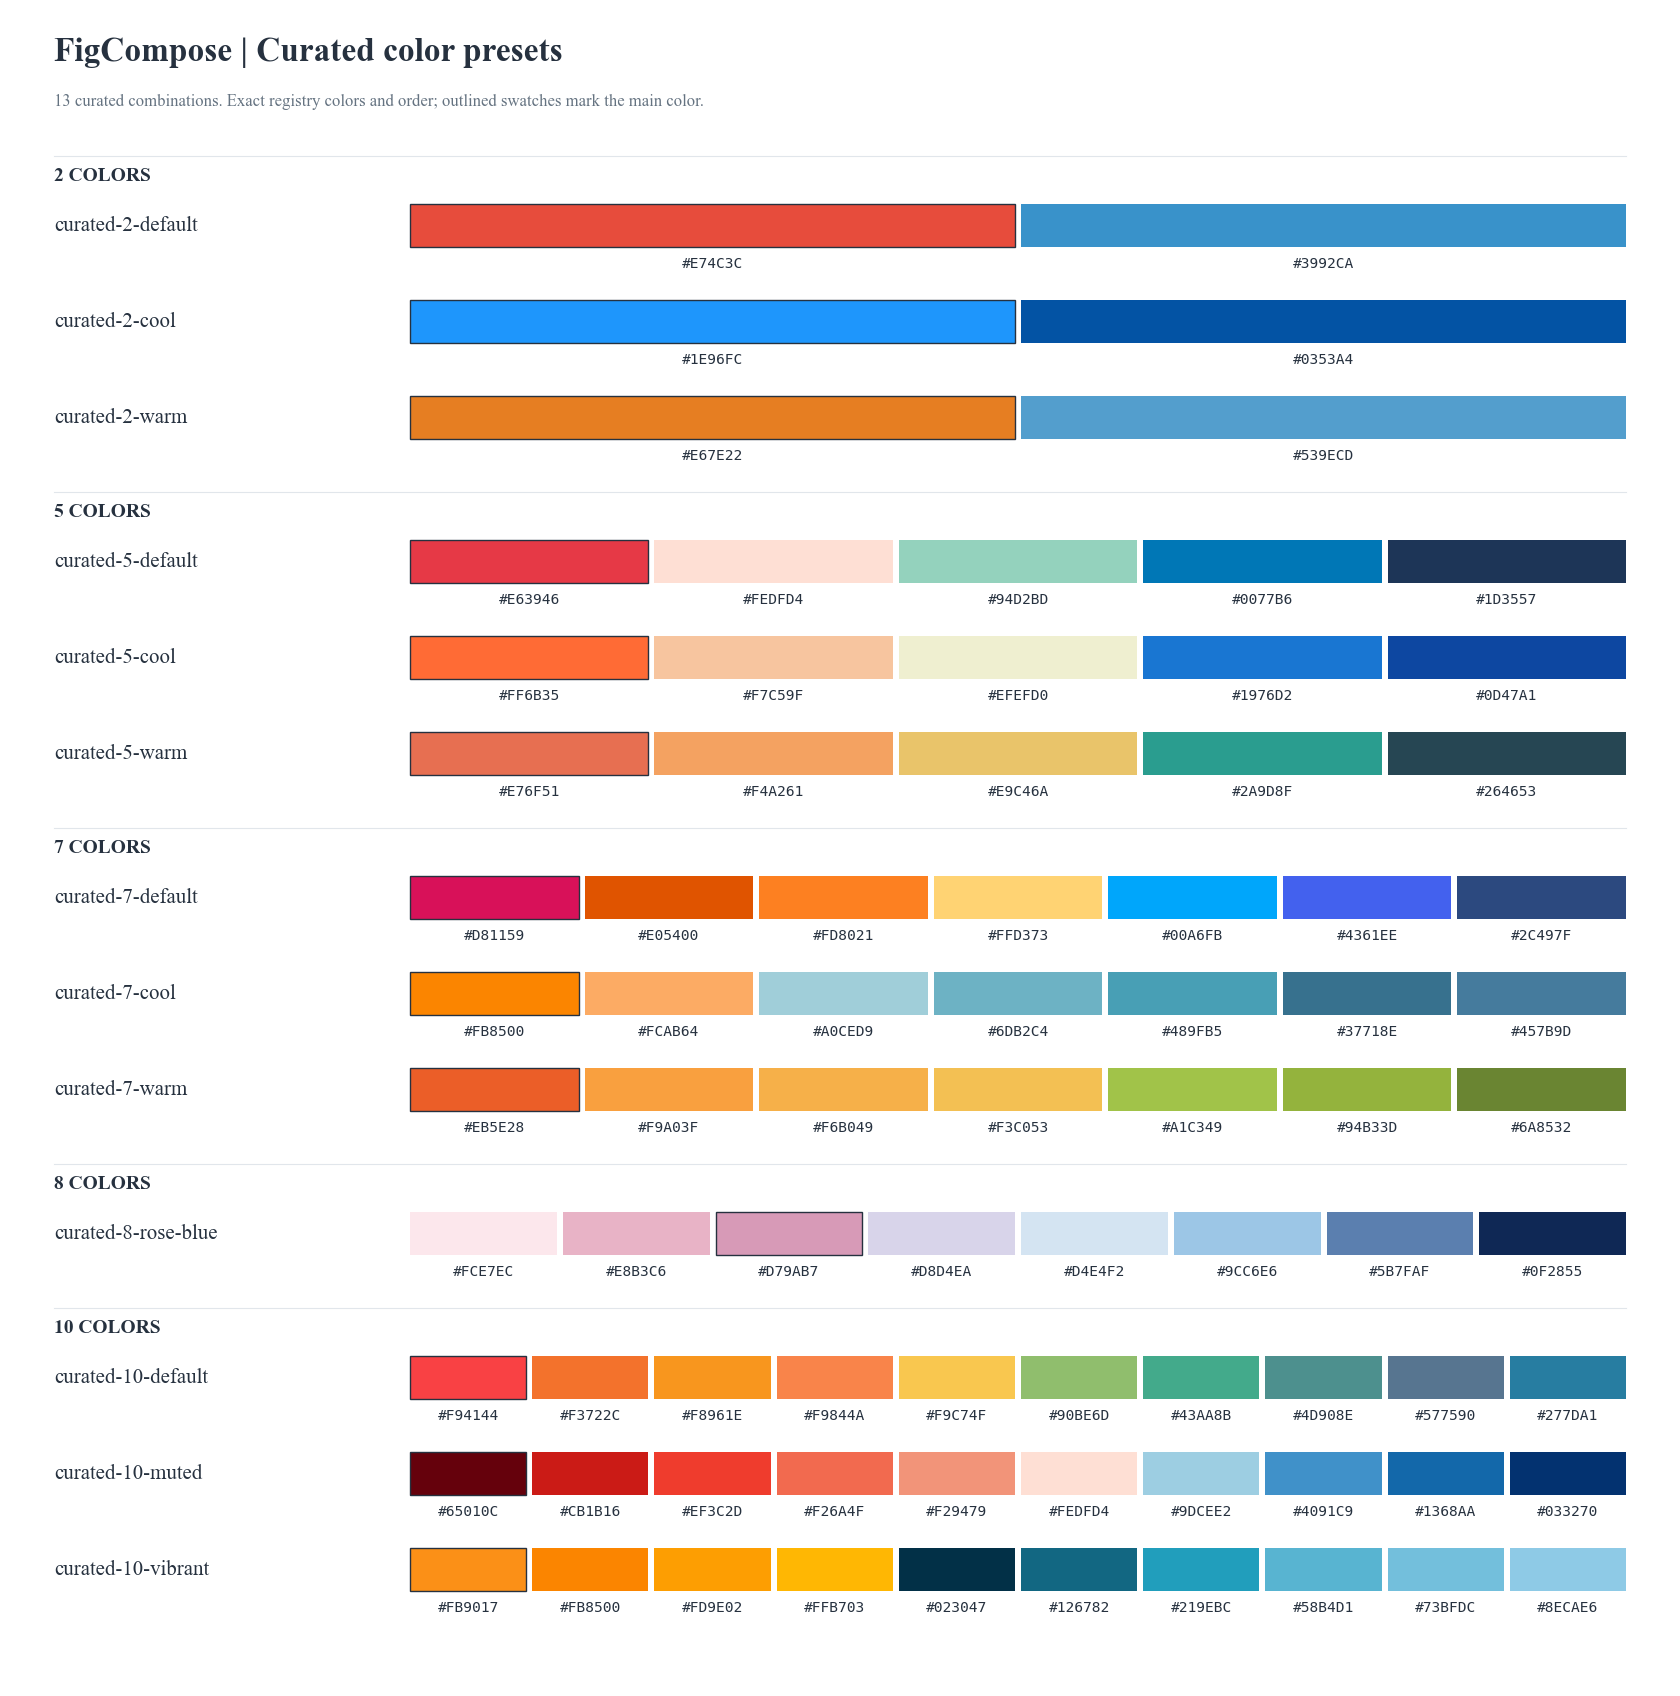
FigCompose includes **13 curated palettes**, preserving their original hex values and order. Pass a full name, such as `palette="curated-5-warm"`.
|
|
240
|
+
The numbers 2 / 5 / 7 / 8 / 10 indicate category capacity; choose a larger preset if needed. Outlined swatches mark each palette's main color.
|
|
241
|
+
|
|
242
|
+
The eight-color `curated-8-rose-blue` palette has **`#D79AB7`** as its main color and is included in FigCompose 0.1.2 and later.
|
|
243
|
+
|
|
244
|
+
|
|
245
|
+
|
|
246
|
+
[View SVG catalog](https://github.com/frederickc8896-Fabulous/FigCompose/blob/main/assets/readme/color_presets.svg) · List names with `from data_visuals import list_color_presets; print(list_color_presets())`.
|
|
247
|
+
|
|
248
|
+
### Continuous color scales
|
|
249
|
+
|
|
250
|
+
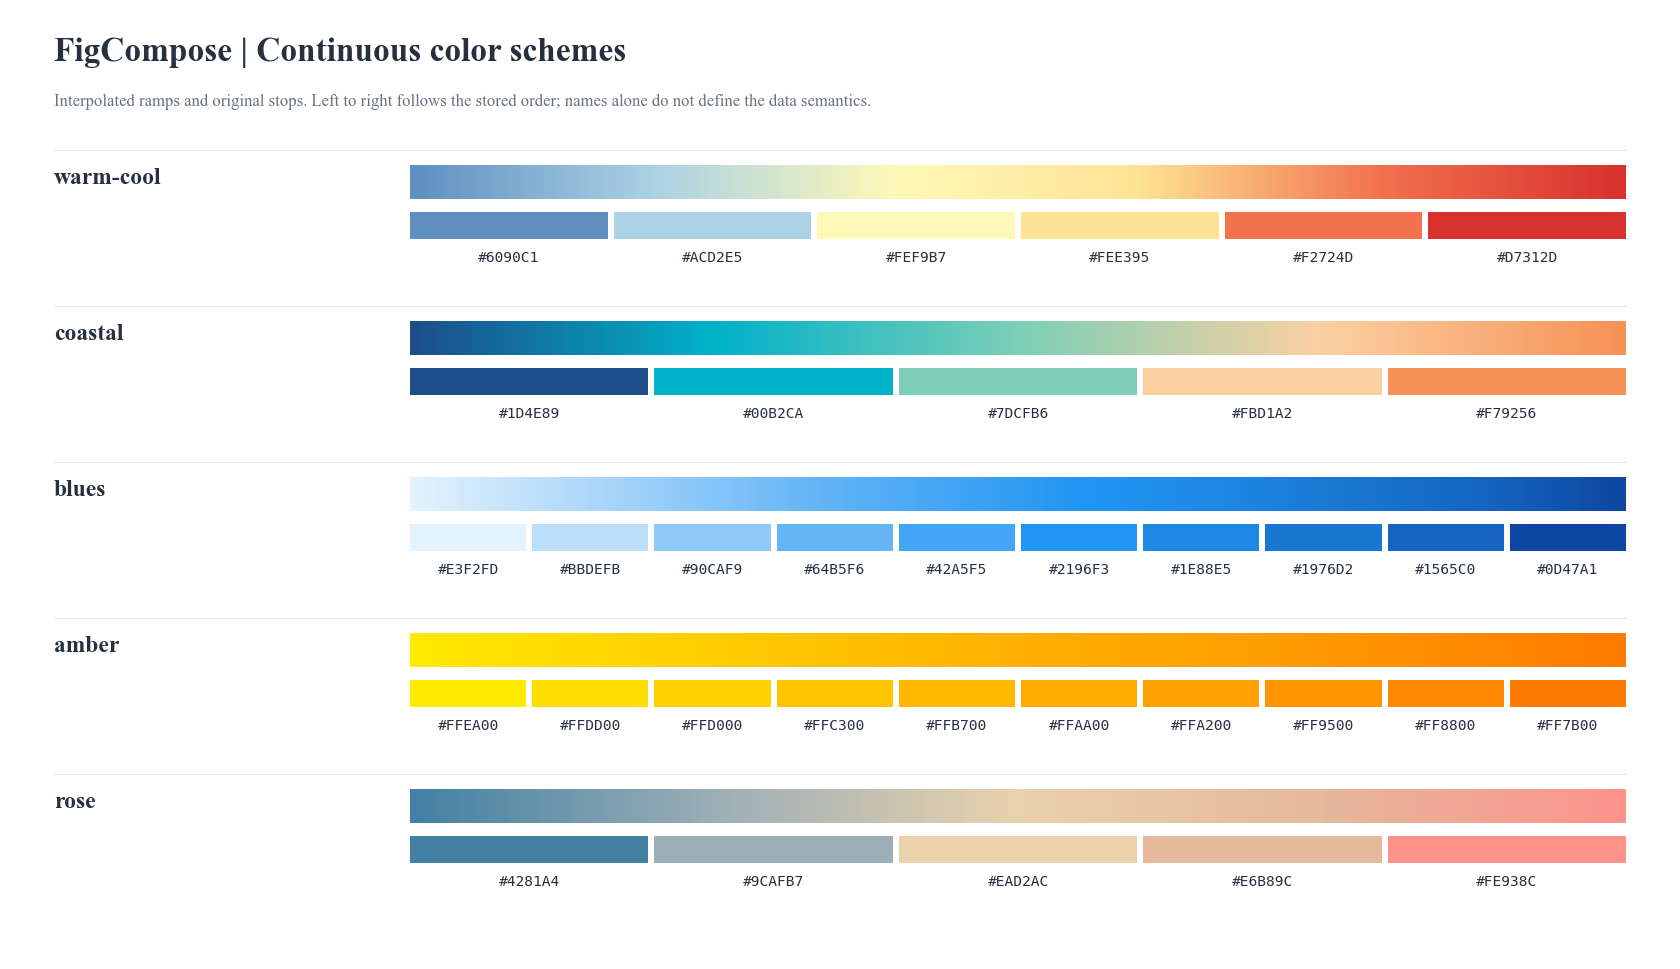
Heatmaps and confusion matrices default to the scale paired with the preset. Choose from these **5 scales** per panel with options such as `chart_opts={"color_scheme": "blues"}`.
|
|
251
|
+
|
|
252
|
+
|
|
253
|
+
|
|
254
|
+
[View SVG catalog](https://github.com/frederickc8896-Fabulous/FigCompose/blob/main/assets/readme/color_schemes.svg)
|
|
@@ -2,6 +2,7 @@ LICENSE
|
|
|
2
2
|
MANIFEST.in
|
|
3
3
|
README.md
|
|
4
4
|
README.zh-CN.md
|
|
5
|
+
REFERENCE.md
|
|
5
6
|
pyproject.toml
|
|
6
7
|
FigCompose.egg-info/PKG-INFO
|
|
7
8
|
FigCompose.egg-info/SOURCES.txt
|
|
@@ -13,6 +14,7 @@ data_visuals/api.py
|
|
|
13
14
|
data_visuals/charts/__init__.py
|
|
14
15
|
data_visuals/charts/bar.py
|
|
15
16
|
data_visuals/charts/box.py
|
|
17
|
+
data_visuals/charts/circular_bar.py
|
|
16
18
|
data_visuals/charts/confusion.py
|
|
17
19
|
data_visuals/charts/heatmap.py
|
|
18
20
|
data_visuals/charts/histogram.py
|
|
@@ -22,6 +24,7 @@ data_visuals/charts/radar.py
|
|
|
22
24
|
data_visuals/charts/scatter.py
|
|
23
25
|
data_visuals/compute/__init__.py
|
|
24
26
|
data_visuals/compute/aggregation.py
|
|
27
|
+
data_visuals/compute/circular.py
|
|
25
28
|
data_visuals/compute/preprocess.py
|
|
26
29
|
data_visuals/compute/statistics.py
|
|
27
30
|
data_visuals/core/__init__.py
|
|
@@ -61,11 +64,13 @@ data_visuals/renderer/mpl/custom.py
|
|
|
61
64
|
data_visuals/renderer/mpl/export.py
|
|
62
65
|
data_visuals/renderer/mpl/facets.py
|
|
63
66
|
data_visuals/renderer/mpl/legends.py
|
|
67
|
+
data_visuals/renderer/mpl/presentation.py
|
|
64
68
|
data_visuals/renderer/mpl/quality.py
|
|
65
69
|
data_visuals/renderer/mpl/styling.py
|
|
66
70
|
data_visuals/renderer/mpl/charts/__init__.py
|
|
67
71
|
data_visuals/renderer/mpl/charts/bar.py
|
|
68
72
|
data_visuals/renderer/mpl/charts/box.py
|
|
73
|
+
data_visuals/renderer/mpl/charts/circular_bar.py
|
|
69
74
|
data_visuals/renderer/mpl/charts/confusion.py
|
|
70
75
|
data_visuals/renderer/mpl/charts/heatmap.py
|
|
71
76
|
data_visuals/renderer/mpl/charts/helpers.py
|
|
@@ -79,4 +84,68 @@ data_visuals/themes/__init__.py
|
|
|
79
84
|
data_visuals/themes/general.json
|
|
80
85
|
data_visuals/themes/modern.json
|
|
81
86
|
data_visuals/utils/__init__.py
|
|
82
|
-
data_visuals/utils/colors.py
|
|
87
|
+
data_visuals/utils/colors.py
|
|
88
|
+
examples/README.md
|
|
89
|
+
examples/_export.py
|
|
90
|
+
examples/alluvial_flows/README.md
|
|
91
|
+
examples/alluvial_flows/data.csv
|
|
92
|
+
examples/alluvial_flows/figure.png
|
|
93
|
+
examples/alluvial_flows/figure.svg
|
|
94
|
+
examples/alluvial_flows/generate.py
|
|
95
|
+
examples/alluvial_flows/preview.png
|
|
96
|
+
examples/alluvial_flows/style.yaml
|
|
97
|
+
examples/chord_connections/README.md
|
|
98
|
+
examples/chord_connections/data.csv
|
|
99
|
+
examples/chord_connections/figure.png
|
|
100
|
+
examples/chord_connections/figure.svg
|
|
101
|
+
examples/chord_connections/generate.py
|
|
102
|
+
examples/chord_connections/preview.png
|
|
103
|
+
examples/chord_connections/style.yaml
|
|
104
|
+
examples/circular_scores/README.md
|
|
105
|
+
examples/circular_scores/data.csv
|
|
106
|
+
examples/circular_scores/figure.png
|
|
107
|
+
examples/circular_scores/figure.svg
|
|
108
|
+
examples/circular_scores/generate.py
|
|
109
|
+
examples/circular_scores/preview.png
|
|
110
|
+
examples/circular_scores/style.yaml
|
|
111
|
+
examples/clustered_heatmap/README.md
|
|
112
|
+
examples/clustered_heatmap/data.csv
|
|
113
|
+
examples/clustered_heatmap/figure.png
|
|
114
|
+
examples/clustered_heatmap/figure.svg
|
|
115
|
+
examples/clustered_heatmap/generate.py
|
|
116
|
+
examples/clustered_heatmap/panel.py
|
|
117
|
+
examples/clustered_heatmap/preview.png
|
|
118
|
+
examples/clustered_heatmap/style.yaml
|
|
119
|
+
examples/intervals/README.md
|
|
120
|
+
examples/intervals/asymmetric_demo.csv
|
|
121
|
+
examples/intervals/data.csv
|
|
122
|
+
examples/intervals/figure.png
|
|
123
|
+
examples/intervals/figure.svg
|
|
124
|
+
examples/intervals/generate.py
|
|
125
|
+
examples/intervals/paired.csv
|
|
126
|
+
examples/intervals/preview.png
|
|
127
|
+
examples/intervals/recompute.py
|
|
128
|
+
examples/intervals/style.yaml
|
|
129
|
+
examples/mixed_figure/README.md
|
|
130
|
+
examples/mixed_figure/data.csv
|
|
131
|
+
examples/mixed_figure/figure.png
|
|
132
|
+
examples/mixed_figure/figure.svg
|
|
133
|
+
examples/mixed_figure/generate.py
|
|
134
|
+
examples/mixed_figure/preview.png
|
|
135
|
+
examples/mixed_figure/style.yaml
|
|
136
|
+
examples/mixed_figure/subset.csv
|
|
137
|
+
examples/participant_tracks/README.md
|
|
138
|
+
examples/participant_tracks/data.csv
|
|
139
|
+
examples/participant_tracks/figure.png
|
|
140
|
+
examples/participant_tracks/figure.svg
|
|
141
|
+
examples/participant_tracks/generate.py
|
|
142
|
+
examples/participant_tracks/panel.py
|
|
143
|
+
examples/participant_tracks/preview.png
|
|
144
|
+
examples/participant_tracks/style.yaml
|
|
145
|
+
examples/three_dimensional_views/README.md
|
|
146
|
+
examples/three_dimensional_views/data.csv
|
|
147
|
+
examples/three_dimensional_views/figure.png
|
|
148
|
+
examples/three_dimensional_views/figure.svg
|
|
149
|
+
examples/three_dimensional_views/generate.py
|
|
150
|
+
examples/three_dimensional_views/preview.png
|
|
151
|
+
examples/three_dimensional_views/style.yaml
|
|
@@ -0,0 +1,254 @@
|
|
|
1
|
+
Metadata-Version: 2.4
|
|
2
|
+
Name: FigCompose
|
|
3
|
+
Version: 0.1.2
|
|
4
|
+
Summary: FigCompose — rule-driven publication-quality visualization engine for researchers
|
|
5
|
+
Author: FigCompose contributors
|
|
6
|
+
License-Expression: Apache-2.0
|
|
7
|
+
Project-URL: Homepage, https://github.com/frederickc8896-Fabulous/FigCompose
|
|
8
|
+
Project-URL: Repository, https://github.com/frederickc8896-Fabulous/FigCompose
|
|
9
|
+
Project-URL: Issues, https://github.com/frederickc8896-Fabulous/FigCompose/issues
|
|
10
|
+
Keywords: visualization,matplotlib,research,paper,publication
|
|
11
|
+
Classifier: Development Status :: 3 - Alpha
|
|
12
|
+
Classifier: Intended Audience :: Science/Research
|
|
13
|
+
Classifier: Topic :: Scientific/Engineering :: Visualization
|
|
14
|
+
Classifier: Framework :: Matplotlib
|
|
15
|
+
Classifier: Programming Language :: Python :: 3.10
|
|
16
|
+
Classifier: Programming Language :: Python :: 3.11
|
|
17
|
+
Classifier: Programming Language :: Python :: 3.12
|
|
18
|
+
Requires-Python: >=3.10
|
|
19
|
+
Description-Content-Type: text/markdown
|
|
20
|
+
License-File: LICENSE
|
|
21
|
+
Requires-Dist: numpy>=1.23.5
|
|
22
|
+
Requires-Dist: cycler>=0.10
|
|
23
|
+
Requires-Dist: pandas>=2.0
|
|
24
|
+
Requires-Dist: matplotlib>=3.7
|
|
25
|
+
Requires-Dist: pyyaml>=6.0
|
|
26
|
+
Requires-Dist: scipy>=1.10
|
|
27
|
+
Requires-Dist: statsmodels>=0.14
|
|
28
|
+
Provides-Extra: dev
|
|
29
|
+
Requires-Dist: pytest>=7; extra == "dev"
|
|
30
|
+
Requires-Dist: pytest-cov; extra == "dev"
|
|
31
|
+
Dynamic: license-file
|
|
32
|
+
|
|
33
|
+
# FigCompose
|
|
34
|
+
|
|
35
|
+
<p>
|
|
36
|
+
<img src="https://raw.githubusercontent.com/frederickc8896-Fabulous/FigCompose/main/assets/branding/figcompose-logo-v1.png" alt="FigCompose logo" width="460">
|
|
37
|
+
</p>
|
|
38
|
+
|
|
39
|
+
**English** | [简体中文](https://github.com/frederickc8896-Fabulous/FigCompose/blob/main/README.zh-CN.md)
|
|
40
|
+
|
|
41
|
+
[](https://pypi.org/project/FigCompose/)
|
|
42
|
+
[](https://pypi.org/project/FigCompose/)
|
|
43
|
+
[](https://github.com/frederickc8896-Fabulous/FigCompose/blob/main/LICENSE)
|
|
44
|
+
|
|
45
|
+
**Choose your data and charts. Let FigCompose handle the figure layout.**
|
|
46
|
+
|
|
47
|
+

|
|
48
|
+
|
|
49
|
+
**11 built-in chart types, 15 panels, one consistent configuration.** Generated directly with FigCompose 0.1.2 using synthetic data.
|
|
50
|
+
[View SVG](https://github.com/frederickc8896-Fabulous/FigCompose/blob/main/assets/readme/hero_gallery.svg) · [Reproduce this figure](https://github.com/frederickc8896-Fabulous/FigCompose/blob/main/assets/readme/hero.py)
|
|
51
|
+
|
|
52
|
+
Start with a CSV or DataFrame, choose metrics, chart types and a style, and keep fonts, colors, legends and spacing consistent throughout the figure.
|
|
53
|
+
When results change, reuse the same visual settings with less manual adjustment.
|
|
54
|
+
|
|
55
|
+
- **Less tweaking, less repeated work**: arrange common charts and decoration spacing automatically, reducing repeated font, legend and margin adjustments.
|
|
56
|
+
- **Built-in curated palettes**: 13 categorical palettes and 5 continuous scales, with warm, cool and mixed color combinations.
|
|
57
|
+
- **Consistent colors across your paper**: register your series to retain each model's colors, markers and line styles across CSVs. When a model is absent, the others keep their identities.
|
|
58
|
+
- **Different charts, one layout**: combine bars, lines, scatter plots, heatmaps and more in one figure with consistent fonts, colors and shared legends.
|
|
59
|
+
- **Export at publication dimensions**: set the width in mm or inches and let height adapt to the content. Font sizes use pt; export to PDF, SVG or PNG.
|
|
60
|
+
- **Keep Matplotlib's flexibility**: custom diagrams, polar plots and 3D plots can join the same layout framework. Figure checks help find overflow and tick collisions.
|
|
61
|
+
|
|
62
|
+
[Quick start](#quick-start) · [Chart types](#supported-charts) · [Paper configuration](#one-configuration-for-an-entire-paper) · [Color catalog](#color-catalog) · [Detailed usage](https://github.com/frederickc8896-Fabulous/FigCompose/blob/main/REFERENCE.md)
|
|
63
|
+
|
|
64
|
+
## Installation
|
|
65
|
+
|
|
66
|
+
Requires Python 3.10+:
|
|
67
|
+
|
|
68
|
+
```bash
|
|
69
|
+
python -m pip install FigCompose
|
|
70
|
+
```
|
|
71
|
+
|
|
72
|
+
The package is named **FigCompose**; Python imports use `data_visuals`.
|
|
73
|
+
**FigCompose 0.1.2** includes the circular-bar chart and all 13 palettes shown here. Upgrade older installations with `python -m pip install --upgrade FigCompose`.
|
|
74
|
+
The default font is **Times New Roman**, supplied by your system; other serif fonts are used as fallbacks.
|
|
75
|
+
|
|
76
|
+
<details>
|
|
77
|
+
<summary>Install the latest source or update an existing installation</summary>
|
|
78
|
+
|
|
79
|
+
Install the source to use the latest chart types and palettes:
|
|
80
|
+
|
|
81
|
+
```bash
|
|
82
|
+
git clone https://github.com/frederickc8896-Fabulous/FigCompose.git
|
|
83
|
+
cd FigCompose
|
|
84
|
+
python -m pip install -e .
|
|
85
|
+
```
|
|
86
|
+
|
|
87
|
+
Update an existing source installation from the repository directory:
|
|
88
|
+
|
|
89
|
+
```bash
|
|
90
|
+
git pull --ff-only
|
|
91
|
+
python -m pip install -e .
|
|
92
|
+
```
|
|
93
|
+
|
|
94
|
+
Update a PyPI installation:
|
|
95
|
+
|
|
96
|
+
```bash
|
|
97
|
+
python -m pip install --upgrade FigCompose
|
|
98
|
+
```
|
|
99
|
+
|
|
100
|
+
</details>
|
|
101
|
+
|
|
102
|
+
## Quick start
|
|
103
|
+
|
|
104
|
+
This example runs as written. For your own data, replace `data` with a CSV path such as `"results.csv"`, with a header row, then select the corresponding column names.
|
|
105
|
+
|
|
106
|
+
```python
|
|
107
|
+
import pandas as pd
|
|
108
|
+
from data_visuals import plot
|
|
109
|
+
|
|
110
|
+
data = pd.DataFrame({
|
|
111
|
+
"dataset": ["A", "A", "B", "B"],
|
|
112
|
+
"model": ["Base", "Ours", "Base", "Ours"],
|
|
113
|
+
"accuracy": [0.78, 0.86, 0.81, 0.89],
|
|
114
|
+
"latency": [14.0, 10.0, 15.0, 11.0],
|
|
115
|
+
})
|
|
116
|
+
|
|
117
|
+
fig = plot(
|
|
118
|
+
data, # Or "results.csv"
|
|
119
|
+
x="dataset", group="model",
|
|
120
|
+
plots=[
|
|
121
|
+
{"kind": "bar", "metric": "accuracy", "title": "(a) Accuracy",
|
|
122
|
+
"chart_opts": {"ylabel": "Accuracy (%)", "yformat": ".0%"}},
|
|
123
|
+
{"kind": "line", "metric": "latency", "title": "(b) Latency",
|
|
124
|
+
"chart_opts": {"ylabel": "Latency (ms)", "yformat": ".0f"}},
|
|
125
|
+
],
|
|
126
|
+
canvas={"width": 180},
|
|
127
|
+
style="modern", palette="curated-5-warm",
|
|
128
|
+
title="Model comparison",
|
|
129
|
+
legend={"scope": "shared", "ncols": 2},
|
|
130
|
+
)
|
|
131
|
+
fig.render("figure.pdf")
|
|
132
|
+
fig.render("figure.png", dpi=300)
|
|
133
|
+
```
|
|
134
|
+
|
|
135
|
+
For everyday use, focus on these settings:
|
|
136
|
+
|
|
137
|
+
| Setting | What to choose |
|
|
138
|
+
|---|---|
|
|
139
|
+
| `data` | A CSV path or DataFrame |
|
|
140
|
+
| `x` / `group` | X-axis and grouping columns, such as dataset and model |
|
|
141
|
+
| `plots` | One entry per panel, selecting a chart `kind` and `metric` |
|
|
142
|
+
| `canvas` | The whole figure's width, in mm by default; omit height to solve it automatically |
|
|
143
|
+
| `style` / `palette` | A visual style and palette, such as `modern` / `curated-5-warm` |
|
|
144
|
+
|
|
145
|
+
Use `cols=2` to limit panels per row. Shared legends default to below the main title and above the panels; position, columns and font size remain adjustable.
|
|
146
|
+
For proportions, `.0%` displays 0–1 as percentages; use `{x:.0f}%` for values already on a 0–100 scale.
|
|
147
|
+
A fixed width and height will not silently shrink fonts; if the content cannot fit, you are prompted to adjust the dimensions.
|
|
148
|
+
|
|
149
|
+
### Ask AI to write the call
|
|
150
|
+
|
|
151
|
+
Give your AI assistant the column names, data units and what you want to show, and ask it to use FigCompose's concise API. For example:
|
|
152
|
+
|
|
153
|
+
> Use FigCompose (`from data_visuals import plot`) to read `results.csv`. Its columns are `dataset`, `model`, `accuracy` (0–1) and `latency` (ms). Group by model and draw an accuracy bar chart and a latency line chart, with two panels per row. Set the figure width to 180 mm with automatic height, use the `modern` style and `curated-5-warm` palette, place the shared legend below the title, and export PDF and 300 dpi PNG.
|
|
154
|
+
|
|
155
|
+
For more complex settings, give your assistant the [API reference](https://github.com/frederickc8896-Fabulous/FigCompose/blob/main/REFERENCE.md) as well.
|
|
156
|
+
|
|
157
|
+
## Ready-to-run examples
|
|
158
|
+
|
|
159
|
+
Download or clone the repository, install FigCompose 0.1.2+, and run a complete example. Each folder includes its actual CSV, saved style, code and expected image.
|
|
160
|
+
|
|
161
|
+
| Start here | What you can reproduce |
|
|
162
|
+
|---|---|
|
|
163
|
+
| [Mixed figure](https://github.com/frederickc8896-Fabulous/FigCompose/tree/main/examples/mixed_figure) | Four charts with stable method identities across two CSVs |
|
|
164
|
+
| [Differences and intervals](https://github.com/frederickc8896-Fabulous/FigCompose/tree/main/examples/intervals) | Paired estimates, confidence intervals and supplied asymmetric bounds |
|
|
165
|
+
| [Concentric scores](https://github.com/frederickc8896-Fabulous/FigCompose/tree/main/examples/circular_scores) | The native circular-bar chart, with 40 scores and independent scales |
|
|
166
|
+
|
|
167
|
+
Run, for example, `python examples/circular_scores/generate.py --out output/circular`.
|
|
168
|
+
[Browse all eight examples](https://github.com/frederickc8896-Fabulous/FigCompose/blob/main/examples/README.md), including ready-made custom templates for participant tracks, circular clustering, 2D/3D comparisons, chord diagrams and alluvial flows.
|
|
169
|
+
|
|
170
|
+
## Supported charts
|
|
171
|
+
|
|
172
|
+
| Chart | `kind` | Common uses |
|
|
173
|
+
|---|---|---|
|
|
174
|
+
| Bar | `bar` | Grouped, horizontal, stacked and percentage-stacked bars; error bars |
|
|
175
|
+
| Line | `line` | Trends, markers, step lines and area fill |
|
|
176
|
+
| Scatter | `scatter` | Points, bubbles and precomputed differences with intervals |
|
|
177
|
+
| Box | `box` | Grouped distributions, horizontal boxes and outliers |
|
|
178
|
+
| Histogram | `histogram` | Distributions, density curves and cumulative distributions |
|
|
179
|
+
| Heatmap | `heatmap` | Metric matrices and value annotations |
|
|
180
|
+
| Confusion matrix | `confusion` | Counts, supplied quantities and row normalization |
|
|
181
|
+
| Pie / donut | `pie` / `donut` | Category shares |
|
|
182
|
+
| Radar | `radar` | Comparing profiles across metrics |
|
|
183
|
+
| Concentric circular bars | `circular_bar` | Independent metric scores for multiple objects and group means |
|
|
184
|
+
|
|
185
|
+
For repeated observations, bars, lines, radar plots and heatmaps default to means within their respective groups. Pie and donut charts sum values by category, or count rows when the value column is omitted; scatter plots retain observations.
|
|
186
|
+
Circular bars use independent score scales rather than shares of a total. Repeated object/metric pairs require an explicit aggregation choice.
|
|
187
|
+
See the [API reference](https://github.com/frederickc8896-Fabulous/FigCompose/blob/main/REFERENCE.md) for statistical definitions, data formats and custom Matplotlib panel examples.
|
|
188
|
+
|
|
189
|
+
## One configuration for an entire paper
|
|
190
|
+
|
|
191
|
+
Save fonts, palettes, metric display names and model identities once, then use the same `paper.yaml` for subsequent figures.
|
|
192
|
+
Continuing with `data` from the quick start, the complete data and a subset without the baseline retain the same model colors and markers:
|
|
193
|
+
|
|
194
|
+
```python
|
|
195
|
+
from data_visuals import FigureConfig, plot
|
|
196
|
+
|
|
197
|
+
paper = FigureConfig(
|
|
198
|
+
canvas={"width": 180}, theme="modern", palette="curated-5-warm",
|
|
199
|
+
font_family="Times New Roman",
|
|
200
|
+
legend={"scope": "shared", "ncols": 2},
|
|
201
|
+
fields={"accuracy": {"label": "Accuracy", "unit": "%", "format": ".0%"}},
|
|
202
|
+
series={"model": [
|
|
203
|
+
{"id": "Base", "label": "Baseline", "marker": "o", "linestyle": "--"},
|
|
204
|
+
{"id": "Ours", "label": "Our method", "marker": "D", "linestyle": "-"},
|
|
205
|
+
]},
|
|
206
|
+
)
|
|
207
|
+
paper.save("paper.yaml")
|
|
208
|
+
|
|
209
|
+
for name, frame in [("all", data), ("subset", data[data.model != "Base"])]:
|
|
210
|
+
plot(frame, config=paper, x="dataset", group="model",
|
|
211
|
+
plots=[{"kind": "line", "metric": "accuracy"}],
|
|
212
|
+
title="Model comparison").render(f"{name}.pdf")
|
|
213
|
+
|
|
214
|
+
# In a later script: paper = FigureConfig.load("paper.yaml")
|
|
215
|
+
```
|
|
216
|
+
|
|
217
|
+
To check a figure, run this on `fig` from the quick start:
|
|
218
|
+
|
|
219
|
+
```python
|
|
220
|
+
report = fig.check(debug="layout_check.png")
|
|
221
|
+
print(report.summary())
|
|
222
|
+
```
|
|
223
|
+
|
|
224
|
+
The inspection image highlights text overflow, tick collisions and small fonts; normal exports contain no inspection marks. Checks and layout snapshots help review presentation; researchers still choose the chart types, statistical definitions and scientific message.
|
|
225
|
+
|
|
226
|
+
## More usage
|
|
227
|
+
|
|
228
|
+
The [API reference](https://github.com/frederickc8896-Fabulous/FigCompose/blob/main/REFERENCE.md) covers axes, legends, paper configurations, circular bars, custom Matplotlib panels and layout snapshots for advanced use or for your AI assistant to consult.
|
|
229
|
+
FigCompose is currently in Alpha; interfaces are still evolving.
|
|
230
|
+
|
|
231
|
+
## License
|
|
232
|
+
|
|
233
|
+
FigCompose is licensed under the [Apache License 2.0](https://github.com/frederickc8896-Fabulous/FigCompose/blob/main/LICENSE).
|
|
234
|
+
|
|
235
|
+
## Color catalog
|
|
236
|
+
|
|
237
|
+
### Categorical colors and figure presets
|
|
238
|
+
|
|
239
|
+
FigCompose includes **13 curated palettes**, preserving their original hex values and order. Pass a full name, such as `palette="curated-5-warm"`.
|
|
240
|
+
The numbers 2 / 5 / 7 / 8 / 10 indicate category capacity; choose a larger preset if needed. Outlined swatches mark each palette's main color.
|
|
241
|
+
|
|
242
|
+
The eight-color `curated-8-rose-blue` palette has **`#D79AB7`** as its main color and is included in FigCompose 0.1.2 and later.
|
|
243
|
+
|
|
244
|
+

|
|
245
|
+
|
|
246
|
+
[View SVG catalog](https://github.com/frederickc8896-Fabulous/FigCompose/blob/main/assets/readme/color_presets.svg) · List names with `from data_visuals import list_color_presets; print(list_color_presets())`.
|
|
247
|
+
|
|
248
|
+
### Continuous color scales
|
|
249
|
+
|
|
250
|
+
Heatmaps and confusion matrices default to the scale paired with the preset. Choose from these **5 scales** per panel with options such as `chart_opts={"color_scheme": "blues"}`.
|
|
251
|
+
|
|
252
|
+

|
|
253
|
+
|
|
254
|
+
[View SVG catalog](https://github.com/frederickc8896-Fabulous/FigCompose/blob/main/assets/readme/color_schemes.svg)
|