FigCompose 0.1.1__tar.gz
This diff represents the content of publicly available package versions that have been released to one of the supported registries. The information contained in this diff is provided for informational purposes only and reflects changes between package versions as they appear in their respective public registries.
- figcompose-0.1.1/FigCompose.egg-info/PKG-INFO +364 -0
- figcompose-0.1.1/FigCompose.egg-info/SOURCES.txt +82 -0
- figcompose-0.1.1/FigCompose.egg-info/dependency_links.txt +1 -0
- figcompose-0.1.1/FigCompose.egg-info/requires.txt +11 -0
- figcompose-0.1.1/FigCompose.egg-info/top_level.txt +1 -0
- figcompose-0.1.1/LICENSE +202 -0
- figcompose-0.1.1/MANIFEST.in +21 -0
- figcompose-0.1.1/PKG-INFO +364 -0
- figcompose-0.1.1/README.md +333 -0
- figcompose-0.1.1/README.zh-CN.md +316 -0
- figcompose-0.1.1/data_visuals/__init__.py +18 -0
- figcompose-0.1.1/data_visuals/api.py +159 -0
- figcompose-0.1.1/data_visuals/charts/__init__.py +340 -0
- figcompose-0.1.1/data_visuals/charts/bar.py +367 -0
- figcompose-0.1.1/data_visuals/charts/box.py +180 -0
- figcompose-0.1.1/data_visuals/charts/confusion.py +125 -0
- figcompose-0.1.1/data_visuals/charts/heatmap.py +181 -0
- figcompose-0.1.1/data_visuals/charts/histogram.py +120 -0
- figcompose-0.1.1/data_visuals/charts/line.py +160 -0
- figcompose-0.1.1/data_visuals/charts/pie.py +129 -0
- figcompose-0.1.1/data_visuals/charts/radar.py +95 -0
- figcompose-0.1.1/data_visuals/charts/scatter.py +153 -0
- figcompose-0.1.1/data_visuals/compute/__init__.py +59 -0
- figcompose-0.1.1/data_visuals/compute/aggregation.py +174 -0
- figcompose-0.1.1/data_visuals/compute/preprocess.py +113 -0
- figcompose-0.1.1/data_visuals/compute/statistics.py +396 -0
- figcompose-0.1.1/data_visuals/core/__init__.py +37 -0
- figcompose-0.1.1/data_visuals/core/canvas.py +67 -0
- figcompose-0.1.1/data_visuals/core/config.py +227 -0
- figcompose-0.1.1/data_visuals/core/facets.py +37 -0
- figcompose-0.1.1/data_visuals/core/figure.py +1295 -0
- figcompose-0.1.1/data_visuals/core/identity.py +197 -0
- figcompose-0.1.1/data_visuals/core/legend.py +130 -0
- figcompose-0.1.1/data_visuals/core/metadata.py +159 -0
- figcompose-0.1.1/data_visuals/core/panel.py +197 -0
- figcompose-0.1.1/data_visuals/core/quality.py +191 -0
- figcompose-0.1.1/data_visuals/core/regression.py +370 -0
- figcompose-0.1.1/data_visuals/core/spec.py +278 -0
- figcompose-0.1.1/data_visuals/data/__init__.py +80 -0
- figcompose-0.1.1/data_visuals/data/labels.py +126 -0
- figcompose-0.1.1/data_visuals/data/loader.py +139 -0
- figcompose-0.1.1/data_visuals/data/schema.py +305 -0
- figcompose-0.1.1/data_visuals/data/transform.py +286 -0
- figcompose-0.1.1/data_visuals/layout/__init__.py +106 -0
- figcompose-0.1.1/data_visuals/layout/auto.py +295 -0
- figcompose-0.1.1/data_visuals/layout/grid.py +562 -0
- figcompose-0.1.1/data_visuals/layout/manager.py +694 -0
- figcompose-0.1.1/data_visuals/layout/panels.py +36 -0
- figcompose-0.1.1/data_visuals/layout/physical.py +344 -0
- figcompose-0.1.1/data_visuals/layout/placement.py +107 -0
- figcompose-0.1.1/data_visuals/layout/shared.py +156 -0
- figcompose-0.1.1/data_visuals/layout/sizing.py +402 -0
- figcompose-0.1.1/data_visuals/renderer/__init__.py +5 -0
- figcompose-0.1.1/data_visuals/renderer/export.py +84 -0
- figcompose-0.1.1/data_visuals/renderer/mpl/__init__.py +23 -0
- figcompose-0.1.1/data_visuals/renderer/mpl/annotations.py +104 -0
- figcompose-0.1.1/data_visuals/renderer/mpl/axes.py +176 -0
- figcompose-0.1.1/data_visuals/renderer/mpl/canvas.py +1085 -0
- figcompose-0.1.1/data_visuals/renderer/mpl/charts/__init__.py +7 -0
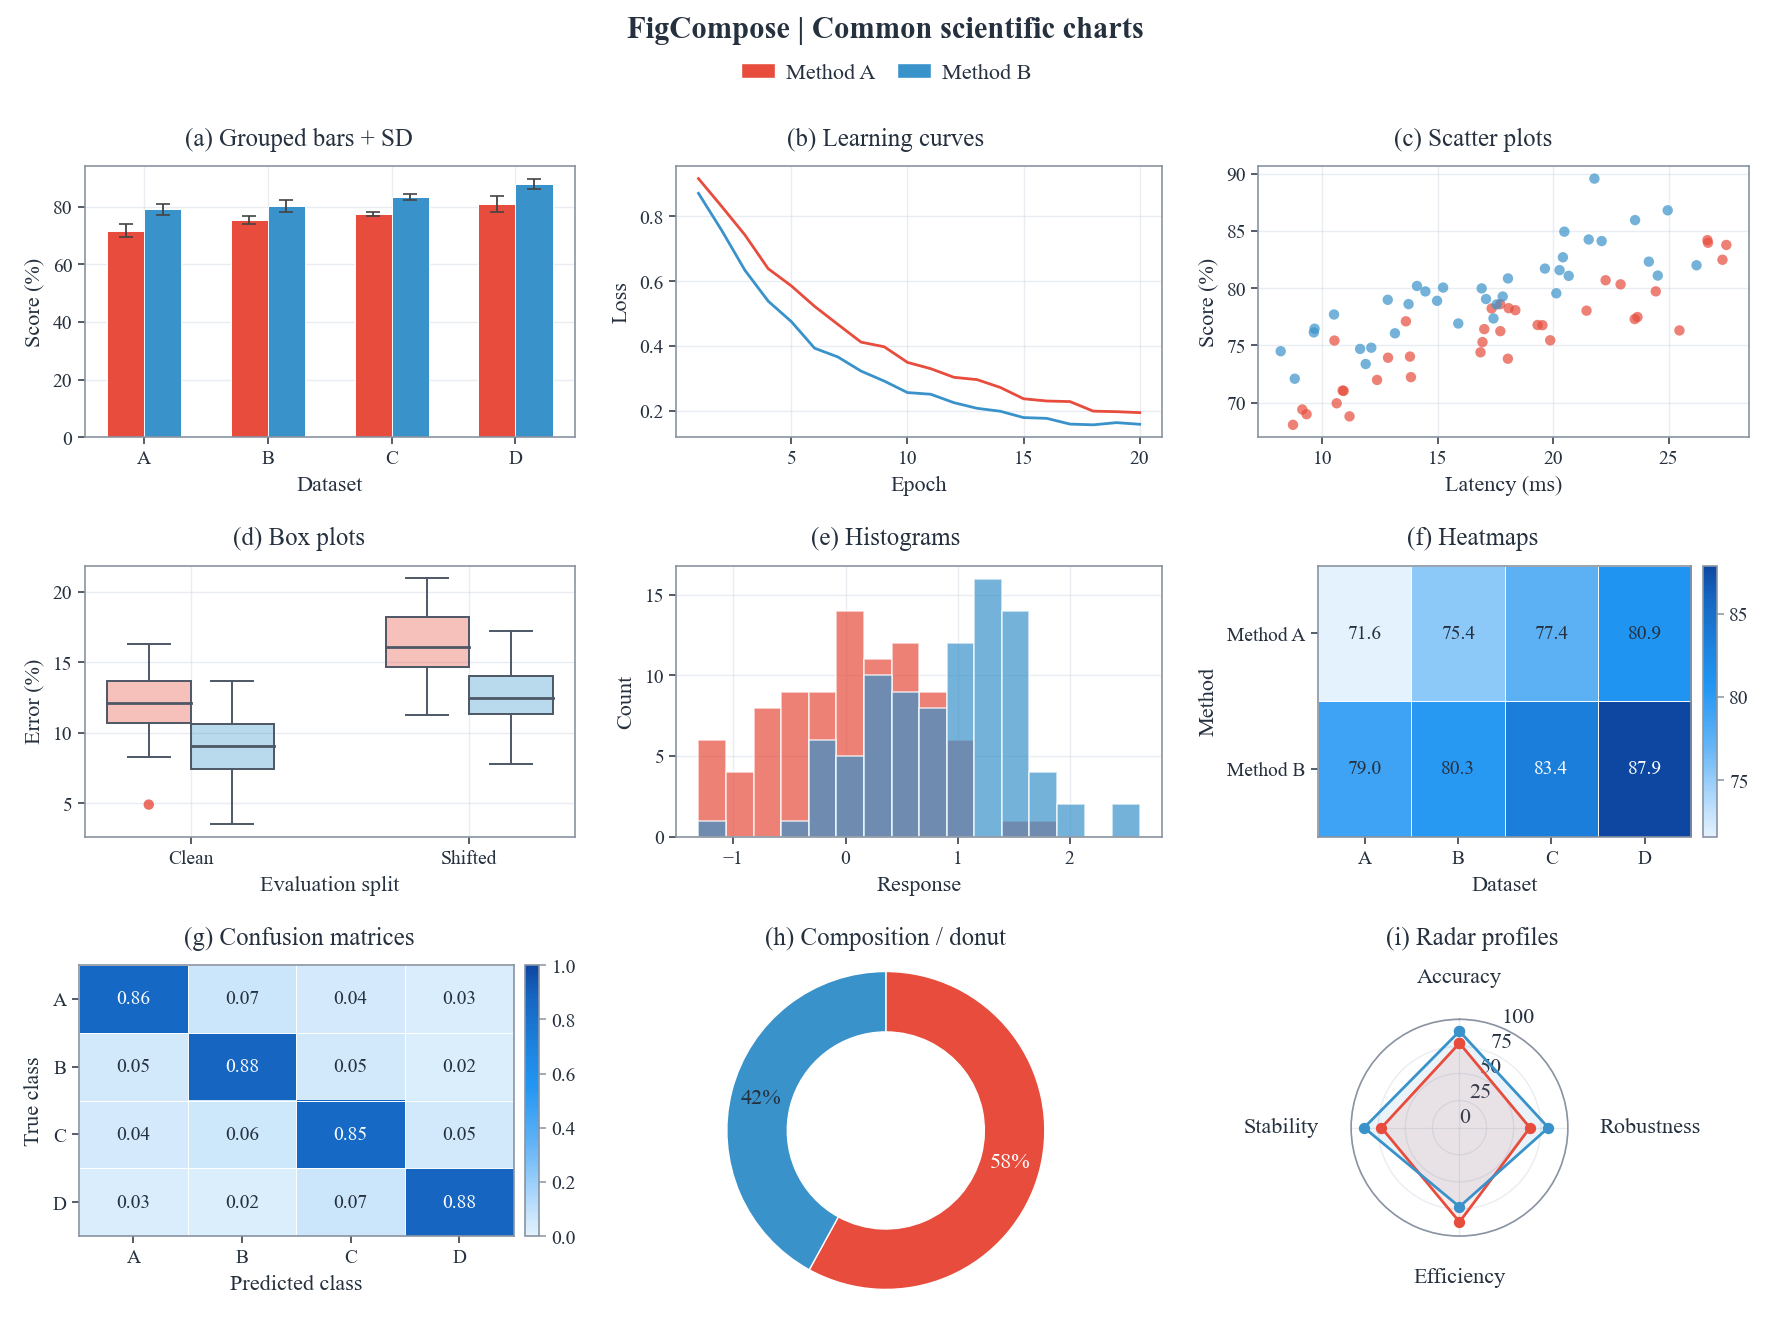
- figcompose-0.1.1/data_visuals/renderer/mpl/charts/bar.py +105 -0
- figcompose-0.1.1/data_visuals/renderer/mpl/charts/box.py +101 -0
- figcompose-0.1.1/data_visuals/renderer/mpl/charts/confusion.py +30 -0
- figcompose-0.1.1/data_visuals/renderer/mpl/charts/heatmap.py +26 -0
- figcompose-0.1.1/data_visuals/renderer/mpl/charts/helpers.py +228 -0
- figcompose-0.1.1/data_visuals/renderer/mpl/charts/histogram.py +58 -0
- figcompose-0.1.1/data_visuals/renderer/mpl/charts/line.py +93 -0
- figcompose-0.1.1/data_visuals/renderer/mpl/charts/pie.py +101 -0
- figcompose-0.1.1/data_visuals/renderer/mpl/charts/radar.py +75 -0
- figcompose-0.1.1/data_visuals/renderer/mpl/charts/registry.py +41 -0
- figcompose-0.1.1/data_visuals/renderer/mpl/charts/scatter.py +291 -0
- figcompose-0.1.1/data_visuals/renderer/mpl/config.py +281 -0
- figcompose-0.1.1/data_visuals/renderer/mpl/custom.py +256 -0
- figcompose-0.1.1/data_visuals/renderer/mpl/export.py +73 -0
- figcompose-0.1.1/data_visuals/renderer/mpl/facets.py +141 -0
- figcompose-0.1.1/data_visuals/renderer/mpl/legends.py +311 -0
- figcompose-0.1.1/data_visuals/renderer/mpl/quality.py +552 -0
- figcompose-0.1.1/data_visuals/renderer/mpl/styling.py +56 -0
- figcompose-0.1.1/data_visuals/themes/__init__.py +131 -0
- figcompose-0.1.1/data_visuals/themes/general.json +121 -0
- figcompose-0.1.1/data_visuals/themes/modern.json +122 -0
- figcompose-0.1.1/data_visuals/utils/__init__.py +34 -0
- figcompose-0.1.1/data_visuals/utils/colors.py +402 -0
- figcompose-0.1.1/pyproject.toml +50 -0
- figcompose-0.1.1/setup.cfg +4 -0
|
@@ -0,0 +1,364 @@
|
|
|
1
|
+
Metadata-Version: 2.4
|
|
2
|
+
Name: FigCompose
|
|
3
|
+
Version: 0.1.1
|
|
4
|
+
Summary: FigCompose — rule-driven publication-quality visualization engine for researchers
|
|
5
|
+
Author: FigCompose contributors
|
|
6
|
+
License-Expression: Apache-2.0
|
|
7
|
+
Project-URL: Homepage, https://github.com/frederickc8896-Fabulous/FigCompose
|
|
8
|
+
Project-URL: Repository, https://github.com/frederickc8896-Fabulous/FigCompose
|
|
9
|
+
Project-URL: Issues, https://github.com/frederickc8896-Fabulous/FigCompose/issues
|
|
10
|
+
Keywords: visualization,matplotlib,research,paper,publication
|
|
11
|
+
Classifier: Development Status :: 3 - Alpha
|
|
12
|
+
Classifier: Intended Audience :: Science/Research
|
|
13
|
+
Classifier: Topic :: Scientific/Engineering :: Visualization
|
|
14
|
+
Classifier: Programming Language :: Python :: 3.10
|
|
15
|
+
Classifier: Programming Language :: Python :: 3.11
|
|
16
|
+
Classifier: Programming Language :: Python :: 3.12
|
|
17
|
+
Requires-Python: >=3.10
|
|
18
|
+
Description-Content-Type: text/markdown
|
|
19
|
+
License-File: LICENSE
|
|
20
|
+
Requires-Dist: numpy>=1.23.5
|
|
21
|
+
Requires-Dist: cycler>=0.10
|
|
22
|
+
Requires-Dist: pandas>=2.0
|
|
23
|
+
Requires-Dist: matplotlib>=3.7
|
|
24
|
+
Requires-Dist: pyyaml>=6.0
|
|
25
|
+
Requires-Dist: scipy>=1.10
|
|
26
|
+
Requires-Dist: statsmodels>=0.14
|
|
27
|
+
Provides-Extra: dev
|
|
28
|
+
Requires-Dist: pytest>=7; extra == "dev"
|
|
29
|
+
Requires-Dist: pytest-cov; extra == "dev"
|
|
30
|
+
Dynamic: license-file
|
|
31
|
+
|
|
32
|
+
# FigCompose
|
|
33
|
+
|
|
34
|
+
<p>
|
|
35
|
+
<img src="https://raw.githubusercontent.com/frederickc8896-Fabulous/FigCompose/main/assets/branding/figcompose-logo-v1.png" alt="FigCompose logo" width="460">
|
|
36
|
+
</p>
|
|
37
|
+
|
|
38
|
+
**English** | [简体中文](https://github.com/frederickc8896-Fabulous/FigCompose/blob/main/README.zh-CN.md)
|
|
39
|
+
|
|
40
|
+
Compose publication figures with Matplotlib.
|
|
41
|
+
|
|
42
|
+
Choose a CSV, metrics, chart types and a style to produce a figure with consistent layout and colors.
|
|
43
|
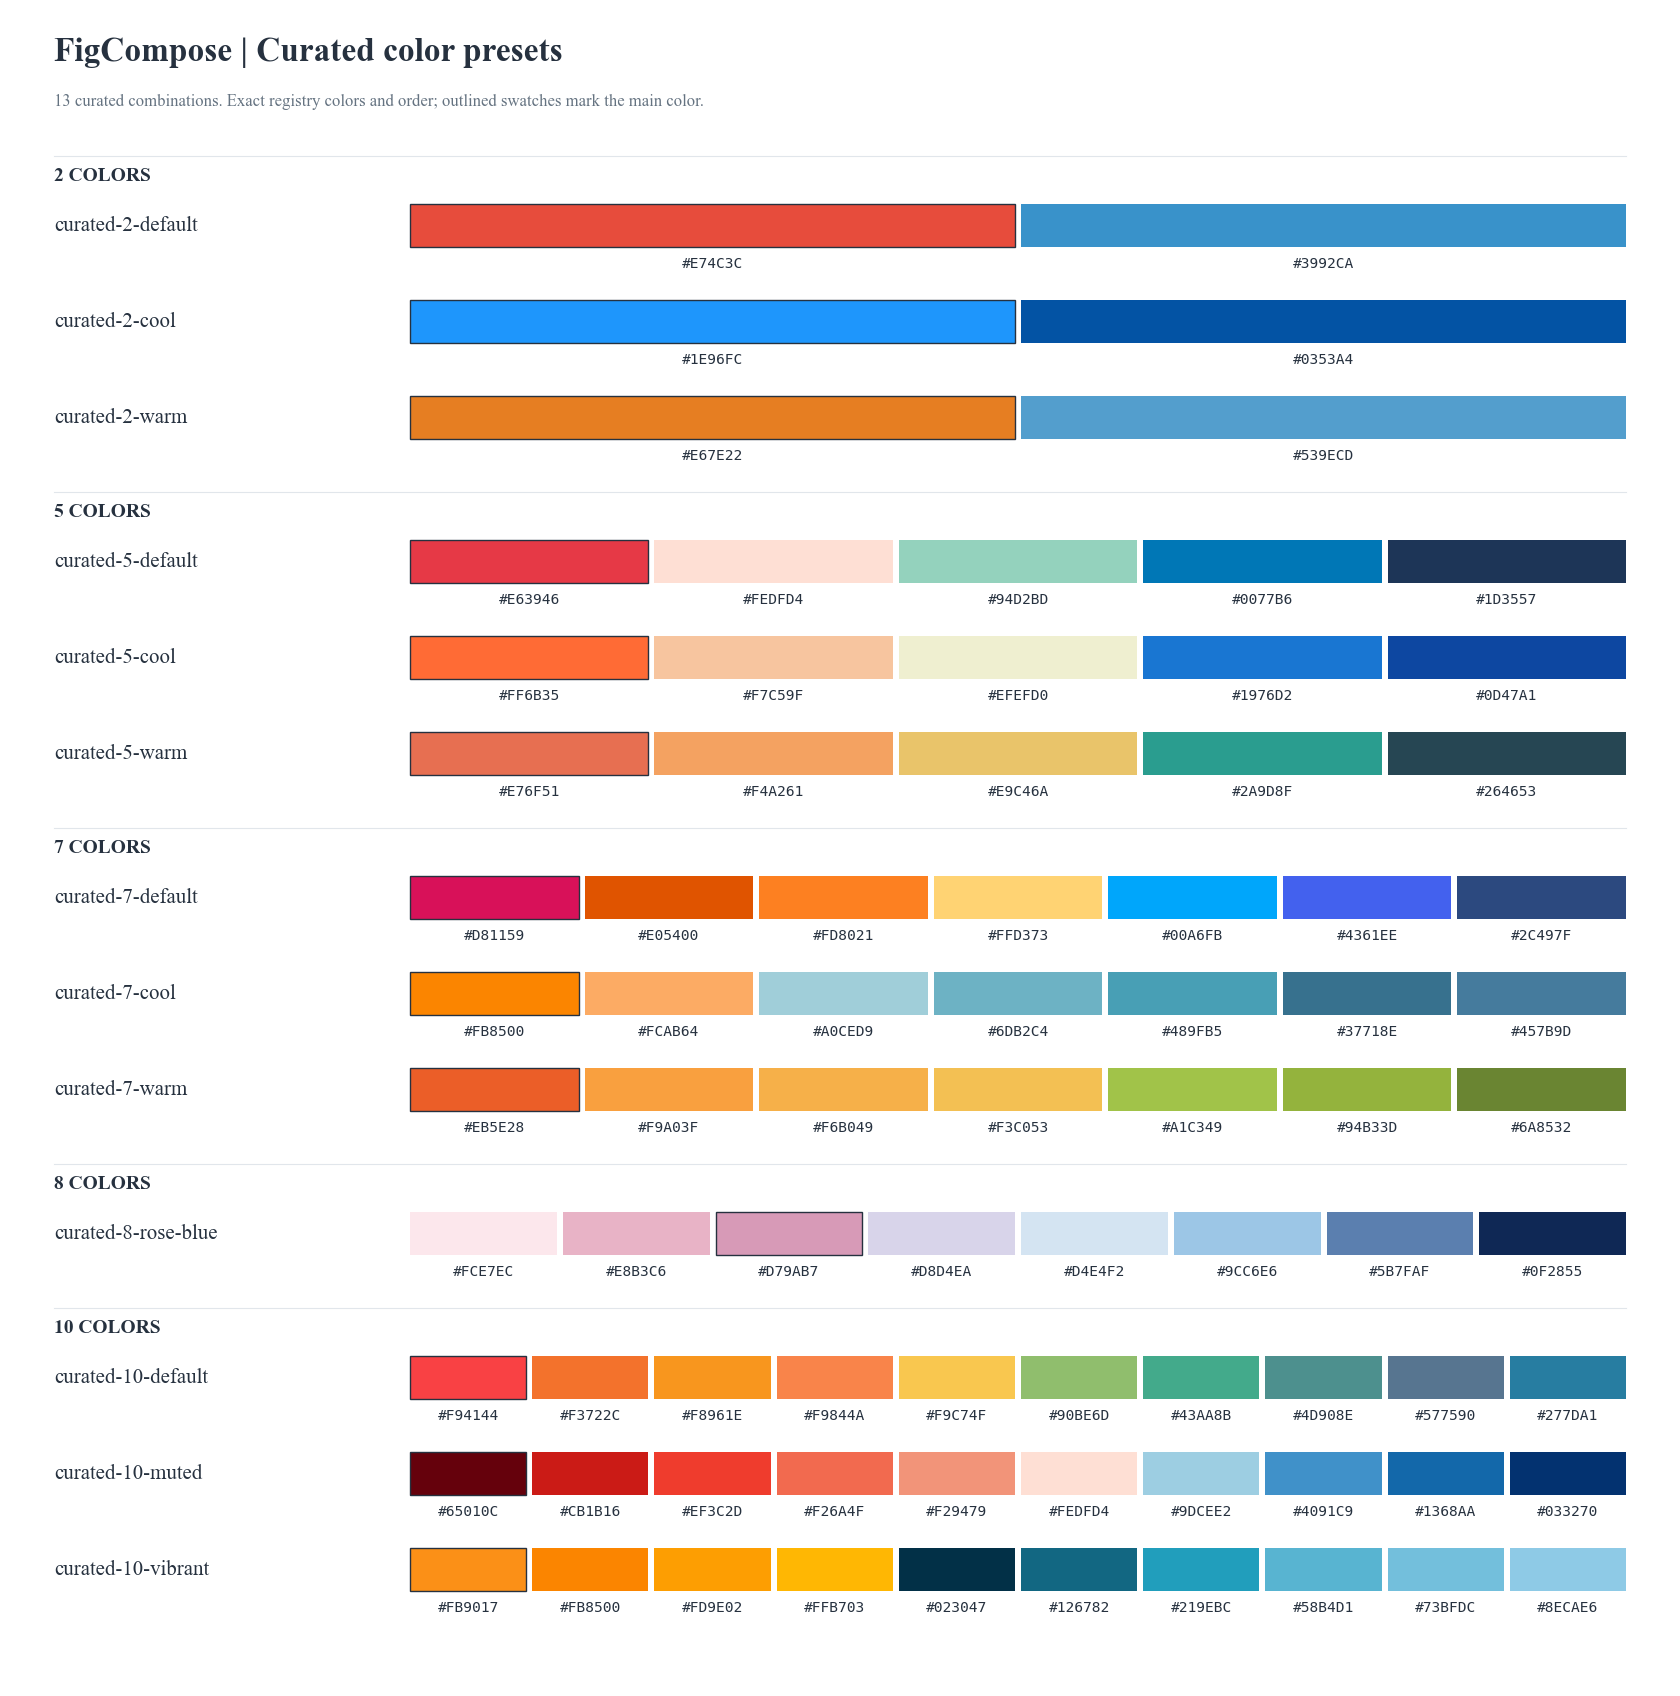
+
FigCompose manages physical dimensions, font sizes, categorical colors, shared legends and spacing
|
|
44
|
+
for the whole figure, reducing repeated style and spacing adjustments when combining chart types.
|
|
45
|
+
|
|
46
|
+
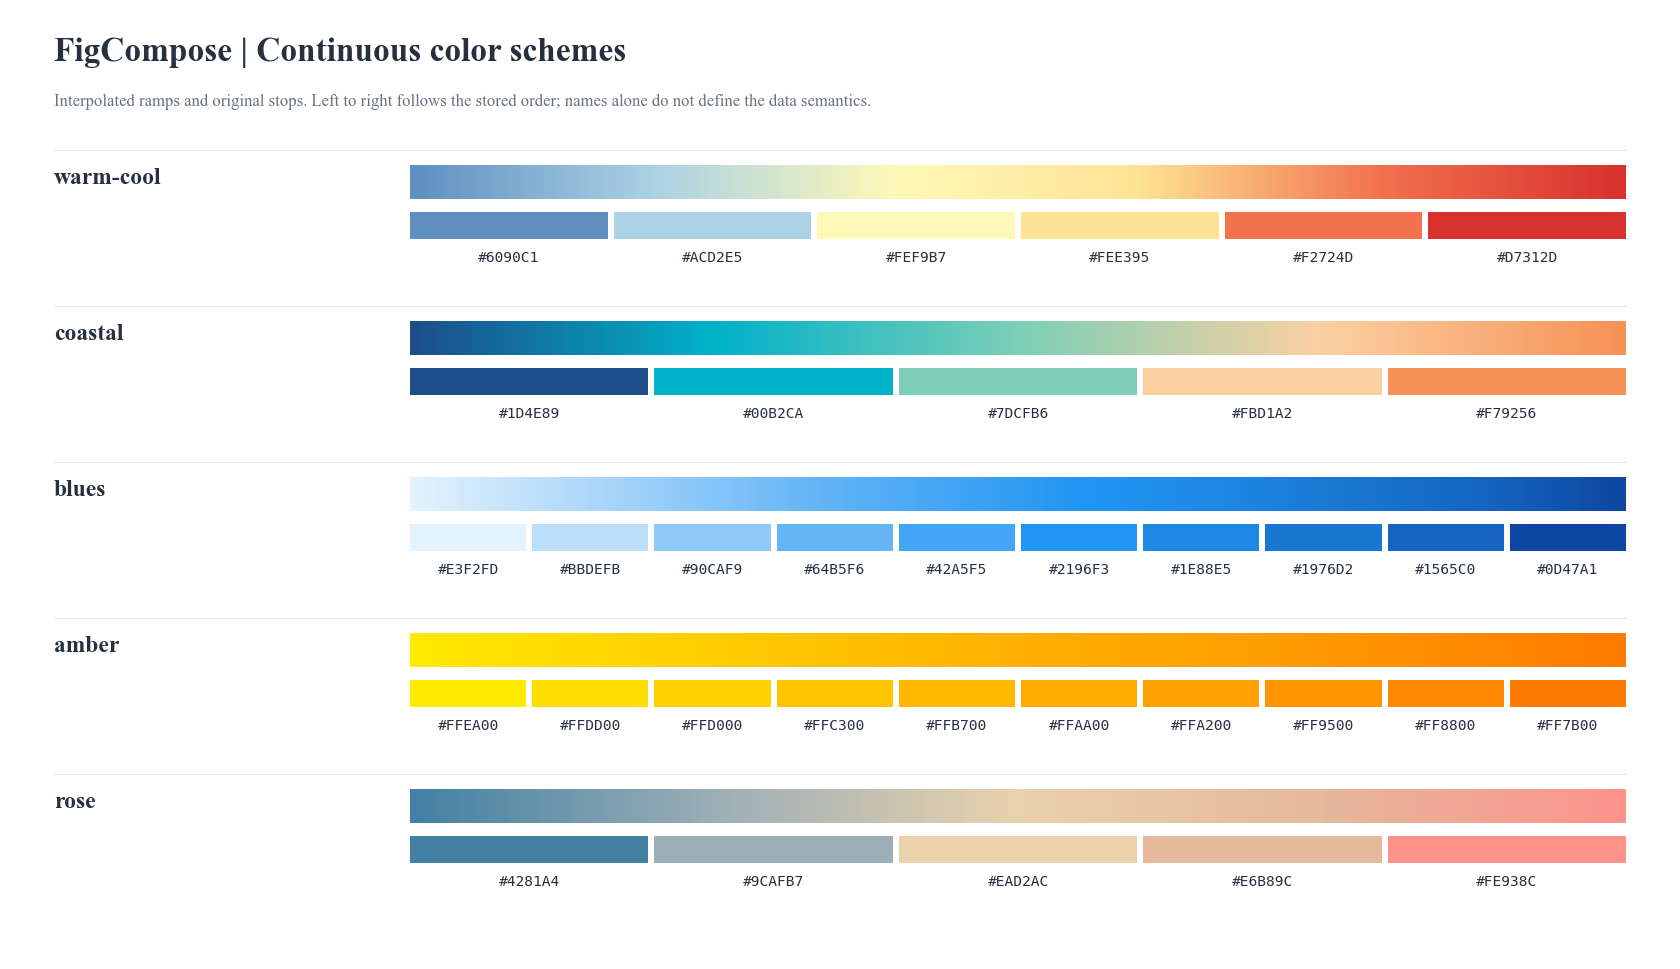
- **Describe a complete figure**: use a CSV or DataFrame, select metrics, chart types and a style, and arrange one or several panels automatically.
|
|
47
|
+
- **Consistent physical layout**: mm / in canvases, fixed font sizes in pt, shared legends and measured margins, with PDF / SVG / PNG export.
|
|
48
|
+
- **Reuse settings across a paper**: save fonts, a choice of 12 curated palettes, field display metadata and series identities. When a model is absent from another CSV, the remaining models retain their colors and markers.
|
|
49
|
+
- **Measure and compare**: locate overflowing text, tick collisions and font-size issues, then save layout snapshots to check later changes.
|
|
50
|
+
- **Extend with native Matplotlib**: 10 built-in chart types can share a figure with custom diagrams, polar plots and 3D plots.
|
|
51
|
+
|
|
52
|
+
This project is in Alpha; interfaces are still evolving. The project and distribution are named **FigCompose**;
|
|
53
|
+
the Python import path remains `data_visuals` for compatibility.
|
|
54
|
+
|
|
55
|
+
[Quick start](#quick-start) · [Paper configuration](#one-configuration-for-an-entire-paper) · [Chart types](#chart-types-and-aggregation) · [Figure checks](#figure-checks-and-layout-snapshots) · [Custom panels](#custom-matplotlib-panels) · [Color catalog](#color-catalog)
|
|
56
|
+
|
|
57
|
+
## Gallery
|
|
58
|
+
|
|
59
|
+
|
|
60
|
+
|
|
61
|
+
All nine panels use FigCompose's declarative API, sharing fonts, method colors and a figure-level legend.
|
|
62
|
+
The data are synthetic, generated with a fixed random seed. Pie charts and the variants listed below are also supported.
|
|
63
|
+
[Vector image](https://github.com/frederickc8896-Fabulous/FigCompose/blob/main/assets/readme/traditional_charts.svg) · [Generation script](https://github.com/frederickc8896-Fabulous/FigCompose/blob/main/assets/readme/generate.py)
|
|
64
|
+
|
|
65
|
+
## Installation
|
|
66
|
+
|
|
67
|
+
Requires Python 3.10+.
|
|
68
|
+
|
|
69
|
+
```bash
|
|
70
|
+
python -m pip install FigCompose
|
|
71
|
+
```
|
|
72
|
+
|
|
73
|
+
The distribution name is `FigCompose`; import it with `from data_visuals import plot`.
|
|
74
|
+
Upgrade with `python -m pip install --upgrade FigCompose`.
|
|
75
|
+
|
|
76
|
+
For source development, clone the repository and use an editable install:
|
|
77
|
+
|
|
78
|
+
```bash
|
|
79
|
+
git clone https://github.com/frederickc8896-Fabulous/FigCompose.git
|
|
80
|
+
cd FigCompose
|
|
81
|
+
python -m pip install -e .
|
|
82
|
+
```
|
|
83
|
+
|
|
84
|
+
The default font is **Times New Roman**, supplied by your operating system; other serif fonts are used as fallbacks.
|
|
85
|
+
Matching fonts and dependency versions are needed to reproduce layouts precisely across devices.
|
|
86
|
+
The current interface is a Python API.
|
|
87
|
+
|
|
88
|
+
## Quick start
|
|
89
|
+
|
|
90
|
+
This example runs as written. To use your own data, replace `data` with a CSV path such as
|
|
91
|
+
`"results.csv"`; the file should have a header row. Then select the corresponding column names.
|
|
92
|
+
|
|
93
|
+
```python
|
|
94
|
+
import pandas as pd
|
|
95
|
+
from data_visuals import plot
|
|
96
|
+
|
|
97
|
+
data = pd.DataFrame({
|
|
98
|
+
"dataset": ["A", "A", "B", "B"],
|
|
99
|
+
"model": ["Base", "Ours", "Base", "Ours"],
|
|
100
|
+
"accuracy": [0.78, 0.86, 0.81, 0.89],
|
|
101
|
+
"latency": [14.0, 10.0, 15.0, 11.0],
|
|
102
|
+
})
|
|
103
|
+
|
|
104
|
+
fig = plot(
|
|
105
|
+
data, # Or "results.csv"
|
|
106
|
+
x="dataset", group="model",
|
|
107
|
+
plots=[
|
|
108
|
+
{"kind": "bar", "metric": "accuracy", "title": "(a) Accuracy",
|
|
109
|
+
"chart_opts": {"ylabel": "Accuracy (%)", "yformat": ".0%"}},
|
|
110
|
+
{"kind": "line", "metric": "latency", "title": "(b) Latency",
|
|
111
|
+
"chart_opts": {"ylabel": "Latency (ms)", "yformat": ".0f"}},
|
|
112
|
+
],
|
|
113
|
+
canvas={"width": 180},
|
|
114
|
+
style="modern", palette="curated-5-warm",
|
|
115
|
+
title="Model comparison",
|
|
116
|
+
legend={"scope": "shared", "ncols": 2},
|
|
117
|
+
)
|
|
118
|
+
fig.render("figure.pdf")
|
|
119
|
+
fig.render("figure.png", dpi=300)
|
|
120
|
+
```
|
|
121
|
+
|
|
122
|
+
- Each entry in `plots` describes one panel; the list length determines the panel count. Use `cols=2` to allow at most two panels per row.
|
|
123
|
+
- `x/group` provide default columns that individual panels can override. Set `group=None` in a panel to disable its grouping.
|
|
124
|
+
- `canvas` sets the physical size of the entire figure. The default width is 180 mm; omit height to measure the content and solve for height automatically. Use `unit="in"` for inches.
|
|
125
|
+
`{"width": 180, "height": 110}` fixes both dimensions; a layout error is reported if the content cannot fit.
|
|
126
|
+
- `style` supports `general` and `modern`; `palette` selects colors independently.
|
|
127
|
+
Import `list_color_presets` from `data_visuals` to list all 12 curated palettes.
|
|
128
|
+
- Export to `.pdf`, `.svg` or `.png`. DPI changes PNG pixel density without changing physical dimensions or layout.
|
|
129
|
+
- Pass CSV reading settings through `csv_options`, for example `{"encoding": "utf-8-sig", "delimiter": ","}`.
|
|
130
|
+
|
|
131
|
+
The main entry points are `plot()` to declare content, `FigureConfig` to reuse paper settings,
|
|
132
|
+
`fig.render()` to export and `fig.check()` to inspect.
|
|
133
|
+
Use `data_visuals.core.Figure` for panels spanning multiple cells, shared-axis grids or native drawing callbacks.
|
|
134
|
+
|
|
135
|
+
## One configuration for an entire paper
|
|
136
|
+
|
|
137
|
+
Use the same `FigureConfig` with `plot(..., config=paper)` and the advanced `Figure(config=paper)` API.
|
|
138
|
+
Declare fonts, palette, canvas, legends, field display metadata and series identities once;
|
|
139
|
+
individual figures can still override the defaults.
|
|
140
|
+
|
|
141
|
+
```python
|
|
142
|
+
import pandas as pd
|
|
143
|
+
from data_visuals import FigureConfig, plot
|
|
144
|
+
|
|
145
|
+
paper = FigureConfig(
|
|
146
|
+
canvas={"width": 180}, # Default unit: mm; height is solved from content
|
|
147
|
+
theme="modern", palette="curated-5-warm",
|
|
148
|
+
font_family="Times New Roman",
|
|
149
|
+
legend={"scope": "shared", "ncols": 3},
|
|
150
|
+
fields={
|
|
151
|
+
"epoch": {"label": "Training epoch", "format": ".0f"},
|
|
152
|
+
"f1": {"label": "F1 score", "unit": "%", "format": ".0%"},
|
|
153
|
+
},
|
|
154
|
+
series={"model": [
|
|
155
|
+
{"id": "base", "label": "Baseline", "marker": "o", "linestyle": "--"},
|
|
156
|
+
{"id": "large", "label": "Large model", "marker": "s", "linestyle": "-."},
|
|
157
|
+
{"id": "ours", "label": "Our method", "marker": "D", "linestyle": "-"},
|
|
158
|
+
]},
|
|
159
|
+
)
|
|
160
|
+
|
|
161
|
+
data = pd.DataFrame({
|
|
162
|
+
"epoch": [1, 2, 1, 2, 1, 2],
|
|
163
|
+
"model": ["base", "base", "large", "large", "ours", "ours"],
|
|
164
|
+
"f1": [0.70, 0.76, 0.78, 0.83, 0.82, 0.89],
|
|
165
|
+
})
|
|
166
|
+
for name, frame in [("all", data), ("subset", data[data.model != "base"])]:
|
|
167
|
+
plot(frame, config=paper, x="epoch", group="model",
|
|
168
|
+
plots=[{"kind": "line", "metric": "f1",
|
|
169
|
+
"chart_opts": {"xticks": [1, 2]}}],
|
|
170
|
+
title="Training comparison").render(f"{name}.pdf")
|
|
171
|
+
|
|
172
|
+
paper.save("paper.yaml") # Also supports .yml / .json
|
|
173
|
+
restored = FigureConfig.load("paper.yaml")
|
|
174
|
+
```
|
|
175
|
+
|
|
176
|
+
- **Field metadata**: `fields` is keyed by original column names. `label` supplies axis labels and automatic panel titles, `unit` is appended to the axis label, and `format` controls numeric display. CSV column names and values remain unchanged.
|
|
177
|
+
`".0%"` displays 0–1 values as percentages; `"{x:.0f}%"` adds a percent sign to values already on a 0–100 scale. The unit alone does not rescale data.
|
|
178
|
+
Matrix value formats also apply to colorbars and annotations; a local `fmt` overrides only matrix annotations. Normalized confusion matrices and percentage-stacked charts do not inherit the original value units.
|
|
179
|
+
- **Series identity**: `series` is keyed by the `group` column. Its list order assigns positions in the original palette; optional `color` fixes an explicit color.
|
|
180
|
+
Lines, scatter and radar plots reuse `marker`; lines and radar plots reuse `linestyle`. A series missing from another CSV keeps its palette position, while legends show only the series present.
|
|
181
|
+
Palette capacity is checked against the complete registered set, including absent series.
|
|
182
|
+
Register the complete set for that column. When the group column is used, unknown IDs, null values and boolean IDs raise errors. Original IDs and display names are stored separately; names such as `ours` do not receive automatic styling.
|
|
183
|
+
- **Override order**: theme defaults → paper configuration → figure call → panel `chart_opts`. Existing `category_colors` override registered colors; panel `series_styles` can override them further.
|
|
184
|
+
Legends remain adjustable in position, columns, order and labels. `legend.order/labels` accept original series IDs.
|
|
185
|
+
- **Configuration files**: JSON / YAML files are validated on loading; unknown fields raise errors. Use YAML for numeric dictionary keys. JSON export rejects configurations whose key types could change.
|
|
186
|
+
|
|
187
|
+
A configuration may describe more fields and series than the current CSV contains. Columns unused by the figure do not take part in computation.
|
|
188
|
+
If several metrics on one axis declare incompatible units or formats, provide an explicit override or separate axes.
|
|
189
|
+
`plot()` selects a style with `style`; the corresponding configuration field is `FigureConfig.theme`.
|
|
190
|
+
|
|
191
|
+
## Chart types and aggregation
|
|
192
|
+
|
|
193
|
+
| Chart | `kind` | Main fields | Default behavior and variants |
|
|
194
|
+
|---|---|---|---|
|
|
195
|
+
| Bar | `bar` | `x`, `metric`, optional `group/error` | Group means; error bars, horizontal bars, stacking and percentage stacking |
|
|
196
|
+
| Line | `line` | `x`, `metric`, optional `group` | Mean of repeated X observations; markers, step lines and area fill |
|
|
197
|
+
| Scatter | `scatter` | `x`, `metric`, optional `group/size` | Retains observations; bubble sizes and precomputed intervals |
|
|
198
|
+
| Box | `box` | `x`, `metric`, optional `group` | Grouped distributions; horizontal boxes and outlier points |
|
|
199
|
+
| Histogram | `histogram` | `metric`, optional `group` | Binning, density curves and cumulative distributions |
|
|
200
|
+
| Heatmap | `heatmap` | `x`, `y`, `metric` | Means grouped along two dimensions; optional value annotations |
|
|
201
|
+
| Confusion matrix | `confusion` | `x`, `y`, optional `metric` | Counts or sums supplied quantities; optional row normalization |
|
|
202
|
+
| Pie / donut | `pie` / `donut` | `group`, optional `metric` | Category sums; counts rows when the value column is omitted |
|
|
203
|
+
| Radar | `radar` | `x`, `metric`, optional `group` | Mean of repeated observations; at least three complete metric axes |
|
|
204
|
+
|
|
205
|
+
`metric` selects Y values for ordinary charts and radar plots, distribution values for histograms,
|
|
206
|
+
and quantities or color values for matrix and pie charts.
|
|
207
|
+
Pie shares must be finite and nonnegative, with a positive total. Radar plots use long-form data;
|
|
208
|
+
they do not normalize values or fill missing metrics automatically.
|
|
209
|
+
|
|
210
|
+
The figure-level `legend` controls shared or local legends, position, columns, font size, frame, order and display labels.
|
|
211
|
+
Panels override it through `chart_opts={"legend": {...}}`; `legend=False` hides legends.
|
|
212
|
+
Shared legends default to the center below the main title and above the panels; an explicit setting such as `position="bottom"` changes the position.
|
|
213
|
+
For example, use `legend={"scope": "shared", "position": "bottom", "ncols": 3, "fontsize": 8}`;
|
|
214
|
+
`chart_opts={"legend": {"position": "upper right"}}` gives an individual panel a local legend.
|
|
215
|
+
Legend font sizes and spacing options such as `gap` use pt.
|
|
216
|
+
Default physical font sizes are 11 pt for the main title, 9 for panel titles, 8 for axis labels,
|
|
217
|
+
7 for ticks and 8 for legends, consistent across single-panel and multi-panel figures.
|
|
218
|
+
|
|
219
|
+
## Axes and compact layout
|
|
220
|
+
|
|
221
|
+
Bar, line, scatter, box and histogram plots share axis settings in `chart_opts`.
|
|
222
|
+
Display labels can differ from CSV column names:
|
|
223
|
+
|
|
224
|
+
| Option | Example and meaning |
|
|
225
|
+
|---|---|
|
|
226
|
+
| `xlabel` / `ylabel` | `"Accuracy (%)"`; an empty string hides the axis label |
|
|
227
|
+
| `xlim` / `ylim` | `[0, 100]`; fixed limits, including reversed limits |
|
|
228
|
+
| `xticks` / `yticks` | `[0, 25, 50, 75, 100]`; fixed tick positions |
|
|
229
|
+
| `xticklabels` / `yticklabels` | Display strings matching the number of corresponding ticks |
|
|
230
|
+
| `xformat` / `yformat` | `".2f"` for two decimal places; `".0%"` to display 0–1 as percentages; `"{x:.0f}%"` to append a percent sign to 0–100 values |
|
|
231
|
+
| `xscale` / `yscale` | `"linear"`, `"log"`, `"symlog"`; categorical axes remain linear |
|
|
232
|
+
|
|
233
|
+
Heatmaps and confusion matrices allow axis label and tick display overrides while preserving categorical matrix limits.
|
|
234
|
+
Radar plots retain their radial `ylim` option. Inapplicable or conflicting axis settings raise errors.
|
|
235
|
+
For horizontal bar and box plots, these options refer to the on-screen X/Y axes.
|
|
236
|
+
|
|
237
|
+
With physical canvases, charts in the same family align their plotting areas. Matrix colorbars and round-chart external labels
|
|
238
|
+
use separate margins in mixed figures; `FigureConfig.facets` preserves strictly equal plotting areas for comparison grids.
|
|
239
|
+
The layout measures decorations and attempts to reclaim excess margins, falling back to the conservative layout if reclamation fails.
|
|
240
|
+
Automatic height considers the actual plotting-area width and height.
|
|
241
|
+
Rendering isolates visual settings from external Matplotlib configuration; native callbacks can still explicitly style their own artists.
|
|
242
|
+
For comparison grids, use `FigureConfig(facets={"sharex": True, "sharey": True})` with a complete rectangular grid.
|
|
243
|
+
Set these options to `False` for independent panel ranges. Explicit `xlim/ylim` remain authoritative;
|
|
244
|
+
conflicting settings on shared axes raise errors.
|
|
245
|
+
|
|
246
|
+
## Figure checks and layout snapshots
|
|
247
|
+
|
|
248
|
+
`fig.check()` measures final text, fonts and plotting areas without adjusting data, font sizes, axis ranges or canvas size.
|
|
249
|
+
It can produce a separate inspection image to locate text overflow, tick overlap, small fonts and related issues:
|
|
250
|
+
|
|
251
|
+
```python
|
|
252
|
+
from pathlib import Path
|
|
253
|
+
import pandas as pd
|
|
254
|
+
from data_visuals import plot
|
|
255
|
+
|
|
256
|
+
fig = plot(
|
|
257
|
+
pd.DataFrame({"epoch": [1, 2, 3], "score": [0.70, 0.81, 0.87]}),
|
|
258
|
+
x="epoch", plots=[{"kind": "line", "metric": "score"}],
|
|
259
|
+
canvas={"width": 90}, title="Training progress",
|
|
260
|
+
)
|
|
261
|
+
report = fig.check(debug="layout_check.png")
|
|
262
|
+
print(report.summary())
|
|
263
|
+
report.raise_for_errors() # Optional; include_warnings=True also requires no warnings
|
|
264
|
+
|
|
265
|
+
baseline = Path("layout_baseline.json")
|
|
266
|
+
if baseline.exists():
|
|
267
|
+
comparison = report.compare(baseline, tolerance=0.5)
|
|
268
|
+
print(comparison.summary())
|
|
269
|
+
comparison.save("layout_changes.json")
|
|
270
|
+
assert comparison.ok, comparison.summary() # Optional: stop on layout changes
|
|
271
|
+
else:
|
|
272
|
+
report.save(baseline) # Establish once; later runs compare the existing file
|
|
273
|
+
```
|
|
274
|
+
|
|
275
|
+
- `min_fontsize=7`, `min_tick_gap=1` and `tolerance=1` all use **pt** and can be overridden in `check()`.
|
|
276
|
+
`report.ok` means there are no errors; `report.errors` and `report.warnings` expose errors and warnings separately.
|
|
277
|
+
Overflow is an error; small fonts, tick overlap and decoration overlap are warnings; font substitution is informational.
|
|
278
|
+
To check for a minimum font size of 8 pt, use `check(min_fontsize=8)`; the default 7 pt ticks will then be reported as warnings.
|
|
279
|
+
- Reports include the actual canvas, panel plotting areas, text bounds, resolved fonts and colors. Debug images mark cells with blue dashed outlines, plotting areas in green, and issues with orange/red boxes. PNG / SVG / PDF are supported; normal exports have no debug overlays.
|
|
280
|
+
- `.compare()` checks recorded physical positions, text, fonts and actual artist styles. The default geometric tolerance is **0.5 pt**; font sizes and colors are compared strictly. DPI is ignored. These are structural layout snapshots rather than pixel screenshot comparisons.
|
|
281
|
+
- After native Matplotlib edits using `mpl_fig = fig.render()`, import `check_figure` from `data_visuals` and call `check_figure(mpl_fig)` to inspect the current result. The caller must then close it with `plt.close(mpl_fig)`. `fig.check()` manages and closes its own temporary figure.
|
|
282
|
+
|
|
283
|
+
Keep baseline files and update them explicitly after review. Check `comparison.ok` to stop subsequent steps when a regression is found.
|
|
284
|
+
Use `FigureReport.load("layout_baseline.json")` to read a saved report.
|
|
285
|
+
|
|
286
|
+
The plotting-area fraction measures allocated rectangles; it is not a whitespace or aesthetic score.
|
|
287
|
+
Checks do not assess statistical conclusions or overlap between data artists, and do not guarantee collision-free
|
|
288
|
+
diagram nodes, connections or projected 3D text. Coverage limits are recorded in the report.
|
|
289
|
+
If the content cannot fit a fixed canvas, a `LayoutError` still reports the size constraints.
|
|
290
|
+
|
|
291
|
+
## Custom Matplotlib panels
|
|
292
|
+
|
|
293
|
+
The advanced `data_visuals.core.Figure` API supports panels spanning cells, width/height ratios and native drawing callbacks.
|
|
294
|
+
A fully custom figure needs no CSV or placeholder DataFrame:
|
|
295
|
+
|
|
296
|
+
```python
|
|
297
|
+
from data_visuals.core import Figure, PanelResult
|
|
298
|
+
|
|
299
|
+
def draw_module(ax, ctx):
|
|
300
|
+
text = ax.text(
|
|
301
|
+
0.5, 0.5, "Encoder", ha="center", va="center",
|
|
302
|
+
bbox={"boxstyle": "round,pad=0.6", "facecolor": ctx.background},
|
|
303
|
+
**ctx.text_kwargs(),
|
|
304
|
+
)
|
|
305
|
+
return PanelResult(artists=[text])
|
|
306
|
+
|
|
307
|
+
paper = Figure(rows=1, cols=1, canvas={"width": 90}, legend=False)
|
|
308
|
+
paper[0, 0].custom(draw_module, min_size=(120, 70), preferred_aspect=2)
|
|
309
|
+
paper.render("model.svg")
|
|
310
|
+
```
|
|
311
|
+
|
|
312
|
+
`.custom()` accepts `projection="polar"`, `"3d"` or a registered Matplotlib projection name.
|
|
313
|
+
Use `axes_options` for native axes constructor arguments, and `axes="on"` to show axes.
|
|
314
|
+
`min_size` uses pt; `box_aspect` is the width/height ratio of the panel's plotting area.
|
|
315
|
+
|
|
316
|
+
Use `ctx.text_kwargs()` and `ctx.color()` for consistent styling. Return measured artists,
|
|
317
|
+
legend handles or a `layout(ax, ctx)` size-update callback through `PanelResult`.
|
|
318
|
+
The framework manages the whole figure; the callback arranges its internal nodes and connections.
|
|
319
|
+
Automatic-size probes and final exports rerun callbacks, so callbacks should rebuild cleanly without external side effects.
|
|
320
|
+
Custom callbacks are runtime objects; Specs containing them cannot be serialized to JSON.
|
|
321
|
+
|
|
322
|
+
## Project scope
|
|
323
|
+
|
|
324
|
+
FigCompose manages reusable styles and figure-level layout. Callers choose data columns, statistical definitions,
|
|
325
|
+
axis ranges and scientific presentation. Custom drawing callbacks also arrange their internal nodes and connections.
|
|
326
|
+
|
|
327
|
+
The repository includes library source, themes, installation metadata, Chinese and English READMEs and their gallery assets.
|
|
328
|
+
Local demos, outputs, tests, detailed documentation and experimental data are ignored.
|
|
329
|
+
The examples above include their own data and run after installing FigCompose.
|
|
330
|
+
Regenerate the README images with `python assets/readme/generate.py`.
|
|
331
|
+
|
|
332
|
+
## License
|
|
333
|
+
|
|
334
|
+
FigCompose is licensed under the [Apache License 2.0](https://github.com/frederickc8896-Fabulous/FigCompose/blob/main/LICENSE).
|
|
335
|
+
|
|
336
|
+
## Color catalog
|
|
337
|
+
|
|
338
|
+
### Categorical colors and figure presets
|
|
339
|
+
|
|
340
|
+
These **12 presets** reference the original combinations in `data_visuals/utils/colors.py`, preserving their hex values and order.
|
|
341
|
+
Pass a full name to `plot()`, such as `palette="curated-5-warm"`; `style` controls typography and layout independently.
|
|
342
|
+
The numbers 2 / 5 / 7 / 10 indicate category capacity: smaller category sets use the first colors;
|
|
343
|
+
choose a larger preset when you exceed the capacity.
|
|
344
|
+
Names such as `cool` and `warm` come from the original configuration; refer to the swatches for the actual color balance.
|
|
345
|
+
|
|
346
|
+
|
|
347
|
+
|
|
348
|
+
[Vector catalog](https://github.com/frederickc8896-Fabulous/FigCompose/blob/main/assets/readme/color_presets.svg). List every preset name with `list_color_presets()`:
|
|
349
|
+
|
|
350
|
+
```python
|
|
351
|
+
from data_visuals import list_color_presets
|
|
352
|
+
|
|
353
|
+
print(list_color_presets())
|
|
354
|
+
```
|
|
355
|
+
|
|
356
|
+
### Continuous color scales
|
|
357
|
+
|
|
358
|
+
Heatmaps and confusion matrices default to the continuous scale paired with the figure's palette.
|
|
359
|
+
Override it per panel, for example with `chart_opts={"color_scheme": "blues"}`.
|
|
360
|
+
All **5 original scales** appear below; gradients correspond to the original color stops.
|
|
361
|
+
|
|
362
|
+
|
|
363
|
+
|
|
364
|
+
[Vector catalog](https://github.com/frederickc8896-Fabulous/FigCompose/blob/main/assets/readme/color_schemes.svg)
|
|
@@ -0,0 +1,82 @@
|
|
|
1
|
+
LICENSE
|
|
2
|
+
MANIFEST.in
|
|
3
|
+
README.md
|
|
4
|
+
README.zh-CN.md
|
|
5
|
+
pyproject.toml
|
|
6
|
+
FigCompose.egg-info/PKG-INFO
|
|
7
|
+
FigCompose.egg-info/SOURCES.txt
|
|
8
|
+
FigCompose.egg-info/dependency_links.txt
|
|
9
|
+
FigCompose.egg-info/requires.txt
|
|
10
|
+
FigCompose.egg-info/top_level.txt
|
|
11
|
+
data_visuals/__init__.py
|
|
12
|
+
data_visuals/api.py
|
|
13
|
+
data_visuals/charts/__init__.py
|
|
14
|
+
data_visuals/charts/bar.py
|
|
15
|
+
data_visuals/charts/box.py
|
|
16
|
+
data_visuals/charts/confusion.py
|
|
17
|
+
data_visuals/charts/heatmap.py
|
|
18
|
+
data_visuals/charts/histogram.py
|
|
19
|
+
data_visuals/charts/line.py
|
|
20
|
+
data_visuals/charts/pie.py
|
|
21
|
+
data_visuals/charts/radar.py
|
|
22
|
+
data_visuals/charts/scatter.py
|
|
23
|
+
data_visuals/compute/__init__.py
|
|
24
|
+
data_visuals/compute/aggregation.py
|
|
25
|
+
data_visuals/compute/preprocess.py
|
|
26
|
+
data_visuals/compute/statistics.py
|
|
27
|
+
data_visuals/core/__init__.py
|
|
28
|
+
data_visuals/core/canvas.py
|
|
29
|
+
data_visuals/core/config.py
|
|
30
|
+
data_visuals/core/facets.py
|
|
31
|
+
data_visuals/core/figure.py
|
|
32
|
+
data_visuals/core/identity.py
|
|
33
|
+
data_visuals/core/legend.py
|
|
34
|
+
data_visuals/core/metadata.py
|
|
35
|
+
data_visuals/core/panel.py
|
|
36
|
+
data_visuals/core/quality.py
|
|
37
|
+
data_visuals/core/regression.py
|
|
38
|
+
data_visuals/core/spec.py
|
|
39
|
+
data_visuals/data/__init__.py
|
|
40
|
+
data_visuals/data/labels.py
|
|
41
|
+
data_visuals/data/loader.py
|
|
42
|
+
data_visuals/data/schema.py
|
|
43
|
+
data_visuals/data/transform.py
|
|
44
|
+
data_visuals/layout/__init__.py
|
|
45
|
+
data_visuals/layout/auto.py
|
|
46
|
+
data_visuals/layout/grid.py
|
|
47
|
+
data_visuals/layout/manager.py
|
|
48
|
+
data_visuals/layout/panels.py
|
|
49
|
+
data_visuals/layout/physical.py
|
|
50
|
+
data_visuals/layout/placement.py
|
|
51
|
+
data_visuals/layout/shared.py
|
|
52
|
+
data_visuals/layout/sizing.py
|
|
53
|
+
data_visuals/renderer/__init__.py
|
|
54
|
+
data_visuals/renderer/export.py
|
|
55
|
+
data_visuals/renderer/mpl/__init__.py
|
|
56
|
+
data_visuals/renderer/mpl/annotations.py
|
|
57
|
+
data_visuals/renderer/mpl/axes.py
|
|
58
|
+
data_visuals/renderer/mpl/canvas.py
|
|
59
|
+
data_visuals/renderer/mpl/config.py
|
|
60
|
+
data_visuals/renderer/mpl/custom.py
|
|
61
|
+
data_visuals/renderer/mpl/export.py
|
|
62
|
+
data_visuals/renderer/mpl/facets.py
|
|
63
|
+
data_visuals/renderer/mpl/legends.py
|
|
64
|
+
data_visuals/renderer/mpl/quality.py
|
|
65
|
+
data_visuals/renderer/mpl/styling.py
|
|
66
|
+
data_visuals/renderer/mpl/charts/__init__.py
|
|
67
|
+
data_visuals/renderer/mpl/charts/bar.py
|
|
68
|
+
data_visuals/renderer/mpl/charts/box.py
|
|
69
|
+
data_visuals/renderer/mpl/charts/confusion.py
|
|
70
|
+
data_visuals/renderer/mpl/charts/heatmap.py
|
|
71
|
+
data_visuals/renderer/mpl/charts/helpers.py
|
|
72
|
+
data_visuals/renderer/mpl/charts/histogram.py
|
|
73
|
+
data_visuals/renderer/mpl/charts/line.py
|
|
74
|
+
data_visuals/renderer/mpl/charts/pie.py
|
|
75
|
+
data_visuals/renderer/mpl/charts/radar.py
|
|
76
|
+
data_visuals/renderer/mpl/charts/registry.py
|
|
77
|
+
data_visuals/renderer/mpl/charts/scatter.py
|
|
78
|
+
data_visuals/themes/__init__.py
|
|
79
|
+
data_visuals/themes/general.json
|
|
80
|
+
data_visuals/themes/modern.json
|
|
81
|
+
data_visuals/utils/__init__.py
|
|
82
|
+
data_visuals/utils/colors.py
|
|
@@ -0,0 +1 @@
|
|
|
1
|
+
|
|
@@ -0,0 +1 @@
|
|
|
1
|
+
data_visuals
|