ComplexHeatmap-py 0.1.0__tar.gz → 0.2.0__tar.gz
This diff represents the content of publicly available package versions that have been released to one of the supported registries. The information contained in this diff is provided for informational purposes only and reflects changes between package versions as they appear in their respective public registries.
- {complexheatmap_py-0.1.0 → complexheatmap_py-0.2.0}/MANIFEST.in +2 -0
- complexheatmap_py-0.2.0/PKG-INFO +207 -0
- complexheatmap_py-0.2.0/README.md +174 -0
- {complexheatmap_py-0.1.0 → complexheatmap_py-0.2.0}/pyproject.toml +4 -3
- complexheatmap_py-0.2.0/src/ComplexHeatmap.pyi +2 -0
- complexheatmap_py-0.2.0/src/ComplexHeatmap_py.egg-info/PKG-INFO +207 -0
- {complexheatmap_py-0.1.0 → complexheatmap_py-0.2.0}/src/ComplexHeatmap_py.egg-info/SOURCES.txt +4 -1
- {complexheatmap_py-0.1.0 → complexheatmap_py-0.2.0}/src/complexheatmap/__init__.py +1 -1
- {complexheatmap_py-0.1.0 → complexheatmap_py-0.2.0}/src/complexheatmap/_options.py +54 -5
- {complexheatmap_py-0.1.0 → complexheatmap_py-0.2.0}/src/complexheatmap/colors.py +44 -9
- {complexheatmap_py-0.1.0 → complexheatmap_py-0.2.0}/src/complexheatmap/data/sample_order.txt +0 -0
- {complexheatmap_py-0.1.0 → complexheatmap_py-0.2.0}/src/complexheatmap/dendrogram.py +47 -39
- {complexheatmap_py-0.1.0 → complexheatmap_py-0.2.0}/src/complexheatmap/density.py +5 -3
- {complexheatmap_py-0.1.0 → complexheatmap_py-0.2.0}/src/complexheatmap/genomic.py +58 -34
- {complexheatmap_py-0.1.0 → complexheatmap_py-0.2.0}/src/complexheatmap/grid.py +154 -64
- {complexheatmap_py-0.1.0 → complexheatmap_py-0.2.0}/src/complexheatmap/heatmap.py +23 -16
- {complexheatmap_py-0.1.0 → complexheatmap_py-0.2.0}/src/complexheatmap/heatmap_list.py +38 -6
- complexheatmap_py-0.2.0/src/complexheatmap/py.typed +0 -0
- {complexheatmap_py-0.1.0 → complexheatmap_py-0.2.0}/src/complexheatmap/three_d.py +25 -12
- {complexheatmap_py-0.1.0 → complexheatmap_py-0.2.0}/src/complexheatmap/utils.py +4 -3
- complexheatmap_py-0.2.0/tests/test_v02_improvements_and_visuals.py +261 -0
- complexheatmap_py-0.1.0/PKG-INFO +0 -96
- complexheatmap_py-0.1.0/README.md +0 -63
- complexheatmap_py-0.1.0/src/ComplexHeatmap_py.egg-info/PKG-INFO +0 -96
- {complexheatmap_py-0.1.0 → complexheatmap_py-0.2.0}/LICENSE +0 -0
- {complexheatmap_py-0.1.0 → complexheatmap_py-0.2.0}/setup.cfg +0 -0
- {complexheatmap_py-0.1.0 → complexheatmap_py-0.2.0}/src/ComplexHeatmap.py +0 -0
- {complexheatmap_py-0.1.0 → complexheatmap_py-0.2.0}/src/ComplexHeatmap_py.egg-info/dependency_links.txt +0 -0
- {complexheatmap_py-0.1.0 → complexheatmap_py-0.2.0}/src/ComplexHeatmap_py.egg-info/requires.txt +0 -0
- {complexheatmap_py-0.1.0 → complexheatmap_py-0.2.0}/src/ComplexHeatmap_py.egg-info/top_level.txt +0 -0
- {complexheatmap_py-0.1.0 → complexheatmap_py-0.2.0}/src/complexheatmap/_base.py +0 -0
- {complexheatmap_py-0.1.0 → complexheatmap_py-0.2.0}/src/complexheatmap/anno_funcs.py +0 -0
- {complexheatmap_py-0.1.0 → complexheatmap_py-0.2.0}/src/complexheatmap/annotations.py +0 -0
- {complexheatmap_py-0.1.0 → complexheatmap_py-0.2.0}/src/complexheatmap/data/dmr_summary/cgi_anno.csv +0 -0
- {complexheatmap_py-0.1.0 → complexheatmap_py-0.2.0}/src/complexheatmap/data/dmr_summary/dist_tss.csv +0 -0
- {complexheatmap_py-0.1.0 → complexheatmap_py-0.2.0}/src/complexheatmap/data/dmr_summary/gene_anno.csv +0 -0
- {complexheatmap_py-0.1.0 → complexheatmap_py-0.2.0}/src/complexheatmap/data/dmr_summary/label.csv +0 -0
- {complexheatmap_py-0.1.0 → complexheatmap_py-0.2.0}/src/complexheatmap/data/dmr_summary/mat_enrich_gf.csv +0 -0
- {complexheatmap_py-0.1.0 → complexheatmap_py-0.2.0}/src/complexheatmap/data/dmr_summary/mat_enrich_st.csv +0 -0
- {complexheatmap_py-0.1.0 → complexheatmap_py-0.2.0}/src/complexheatmap/data/dmr_summary/mat_pct_st.csv +0 -0
- {complexheatmap_py-0.1.0 → complexheatmap_py-0.2.0}/src/complexheatmap/data/dmr_summary/mean_meth.csv +0 -0
- {complexheatmap_py-0.1.0 → complexheatmap_py-0.2.0}/src/complexheatmap/data/dmr_summary/n_corr.csv +0 -0
- {complexheatmap_py-0.1.0 → complexheatmap_py-0.2.0}/src/complexheatmap/data/dmr_summary/n_gr.csv +0 -0
- {complexheatmap_py-0.1.0 → complexheatmap_py-0.2.0}/src/complexheatmap/data/gene_expression.csv +0 -0
- {complexheatmap_py-0.1.0 → complexheatmap_py-0.2.0}/src/complexheatmap/data/gr.csv +0 -0
- {complexheatmap_py-0.1.0 → complexheatmap_py-0.2.0}/src/complexheatmap/data/measles.csv +0 -0
- {complexheatmap_py-0.1.0 → complexheatmap_py-0.2.0}/src/complexheatmap/data/meth/enhancer.csv +0 -0
- {complexheatmap_py-0.1.0 → complexheatmap_py-0.2.0}/src/complexheatmap/data/meth/expr.csv +0 -0
- {complexheatmap_py-0.1.0 → complexheatmap_py-0.2.0}/src/complexheatmap/data/meth/meth.csv +0 -0
- {complexheatmap_py-0.1.0 → complexheatmap_py-0.2.0}/src/complexheatmap/data/meth/row_meta.csv +0 -0
- {complexheatmap_py-0.1.0 → complexheatmap_py-0.2.0}/src/complexheatmap/data/rand_mat.csv +0 -0
- {complexheatmap_py-0.1.0 → complexheatmap_py-0.2.0}/src/complexheatmap/data/random_meth_expr_data/anno.csv +0 -0
- {complexheatmap_py-0.1.0 → complexheatmap_py-0.2.0}/src/complexheatmap/data/random_meth_expr_data/anno_states.csv +0 -0
- {complexheatmap_py-0.1.0 → complexheatmap_py-0.2.0}/src/complexheatmap/data/random_meth_expr_data/mat_expr.csv +0 -0
- {complexheatmap_py-0.1.0 → complexheatmap_py-0.2.0}/src/complexheatmap/data/random_meth_expr_data/mat_meth.csv +0 -0
- {complexheatmap_py-0.1.0 → complexheatmap_py-0.2.0}/src/complexheatmap/data/random_meth_expr_data/row_meta.csv +0 -0
- {complexheatmap_py-0.1.0 → complexheatmap_py-0.2.0}/src/complexheatmap/data/tcga_lung_adenocarcinoma.csv +0 -0
- {complexheatmap_py-0.1.0 → complexheatmap_py-0.2.0}/src/complexheatmap/decorate.py +0 -0
- {complexheatmap_py-0.1.0 → complexheatmap_py-0.2.0}/src/complexheatmap/legend.py +0 -0
- {complexheatmap_py-0.1.0 → complexheatmap_py-0.2.0}/src/complexheatmap/oncoprint.py +0 -0
- {complexheatmap_py-0.1.0 → complexheatmap_py-0.2.0}/src/complexheatmap/text.py +0 -0
- {complexheatmap_py-0.1.0 → complexheatmap_py-0.2.0}/src/complexheatmap/translate.py +0 -0
- {complexheatmap_py-0.1.0 → complexheatmap_py-0.2.0}/src/complexheatmap/units.py +0 -0
- {complexheatmap_py-0.1.0 → complexheatmap_py-0.2.0}/src/complexheatmap/upset.py +0 -0
- {complexheatmap_py-0.1.0 → complexheatmap_py-0.2.0}/tests/test_all_rd_examples.py +0 -0
- {complexheatmap_py-0.1.0 → complexheatmap_py-0.2.0}/tests/test_annotations_and_legends.py +0 -0
- {complexheatmap_py-0.1.0 → complexheatmap_py-0.2.0}/tests/test_clustering_and_alignment.py +0 -0
- {complexheatmap_py-0.1.0 → complexheatmap_py-0.2.0}/tests/test_core_and_colors.py +0 -0
- {complexheatmap_py-0.1.0 → complexheatmap_py-0.2.0}/tests/test_highlevel_and_translate.py +0 -0
- {complexheatmap_py-0.1.0 → complexheatmap_py-0.2.0}/tests/test_upset_and_oncoprint.py +0 -0
|
@@ -0,0 +1,207 @@
|
|
|
1
|
+
Metadata-Version: 2.4
|
|
2
|
+
Name: ComplexHeatmap-py
|
|
3
|
+
Version: 0.2.0
|
|
4
|
+
Summary: Python port of the ComplexHeatmap R/Bioconductor package for making complex heatmaps, annotations, oncoPrints, UpSet plots, and density heatmaps.
|
|
5
|
+
Author-email: Xiaowei Zhan <zhanxw@gmail.com>
|
|
6
|
+
License-Expression: MIT
|
|
7
|
+
Project-URL: Homepage, https://github.com/zhanxw/ComplexHeatmap-py
|
|
8
|
+
Project-URL: Repository, https://github.com/zhanxw/ComplexHeatmap-py
|
|
9
|
+
Project-URL: Issues, https://github.com/zhanxw/ComplexHeatmap-py/issues
|
|
10
|
+
Keywords: heatmap,complexheatmap,bioinformatics,genomics,oncoprint,upset,matplotlib,visualization
|
|
11
|
+
Classifier: Development Status :: 4 - Beta
|
|
12
|
+
Classifier: Intended Audience :: Science/Research
|
|
13
|
+
Classifier: Operating System :: OS Independent
|
|
14
|
+
Classifier: Programming Language :: Python :: 3
|
|
15
|
+
Classifier: Programming Language :: Python :: 3.10
|
|
16
|
+
Classifier: Programming Language :: Python :: 3.11
|
|
17
|
+
Classifier: Programming Language :: Python :: 3.12
|
|
18
|
+
Classifier: Programming Language :: Python :: 3.13
|
|
19
|
+
Classifier: Programming Language :: Python :: 3.14
|
|
20
|
+
Classifier: Topic :: Scientific/Engineering :: Bio-Informatics
|
|
21
|
+
Classifier: Topic :: Scientific/Engineering :: Visualization
|
|
22
|
+
Requires-Python: >=3.10
|
|
23
|
+
Description-Content-Type: text/markdown
|
|
24
|
+
License-File: LICENSE
|
|
25
|
+
Requires-Dist: numpy>=1.24
|
|
26
|
+
Requires-Dist: scipy>=1.10
|
|
27
|
+
Requires-Dist: matplotlib>=3.7
|
|
28
|
+
Requires-Dist: pandas>=2.0
|
|
29
|
+
Requires-Dist: pillow>=10.0
|
|
30
|
+
Provides-Extra: dev
|
|
31
|
+
Requires-Dist: pytest>=7.0; extra == "dev"
|
|
32
|
+
Dynamic: license-file
|
|
33
|
+
|
|
34
|
+
<p align="center">
|
|
35
|
+
<img src="https://raw.githubusercontent.com/zhanxw/ComplexHeatmap-py/main/examples/output/01_logo.png" alt="ComplexHeatmap-py Logo" width="220" />
|
|
36
|
+
</p>
|
|
37
|
+
|
|
38
|
+
# ComplexHeatmap-py
|
|
39
|
+
|
|
40
|
+
Complete standalone Python port of the R/Bioconductor **ComplexHeatmap** (v2.25.3) package, powered by NumPy, SciPy, Pandas, Pillow, and Matplotlib.
|
|
41
|
+
|
|
42
|
+
## Installation
|
|
43
|
+
|
|
44
|
+
```bash
|
|
45
|
+
pip install ComplexHeatmap-py
|
|
46
|
+
```
|
|
47
|
+
|
|
48
|
+
Or install from source:
|
|
49
|
+
|
|
50
|
+
```bash
|
|
51
|
+
git clone https://github.com/zhanxw/ComplexHeatmap-py.git
|
|
52
|
+
cd ComplexHeatmap-py
|
|
53
|
+
pip install -e .
|
|
54
|
+
```
|
|
55
|
+
|
|
56
|
+
Both `import complexheatmap as ch` and `import ComplexHeatmap as ch` are supported.
|
|
57
|
+
|
|
58
|
+
## Quick Example
|
|
59
|
+
|
|
60
|
+
```python
|
|
61
|
+
import matplotlib
|
|
62
|
+
matplotlib.use("Agg")
|
|
63
|
+
import numpy as np
|
|
64
|
+
import pandas as pd
|
|
65
|
+
import complexheatmap as ch
|
|
66
|
+
|
|
67
|
+
ch.ht_opt(kmeans_seed=123)
|
|
68
|
+
rng = np.random.default_rng(123)
|
|
69
|
+
mat = pd.DataFrame(
|
|
70
|
+
rng.standard_normal((12, 10)),
|
|
71
|
+
index=[f"gene_{i}" for i in range(12)],
|
|
72
|
+
columns=[f"sample_{j}" for j in range(10)],
|
|
73
|
+
)
|
|
74
|
+
|
|
75
|
+
ha_top = ch.HeatmapAnnotation(
|
|
76
|
+
Group=["Ctrl"] * 5 + ["Treat"] * 5,
|
|
77
|
+
Score=ch.anno_barplot(rng.uniform(0, 1, 10)),
|
|
78
|
+
col={"Group": {"Ctrl": "#4DAF4A", "Treat": "#E41A1C"}},
|
|
79
|
+
)
|
|
80
|
+
|
|
81
|
+
ht1 = ch.Heatmap(mat, name="Expr", row_km=2, top_annotation=ha_top, border=True)
|
|
82
|
+
ht2 = ch.Heatmap(mat.iloc[:, :4] * 2, name="Delta")
|
|
83
|
+
res = ch.draw(ht1 + ht2, width=9.0, height=6.5, dpi=150)
|
|
84
|
+
|
|
85
|
+
# Post-draw decoration (just like R's decorate_heatmap_body)
|
|
86
|
+
with ch.decorate_heatmap_body("Expr", row_slice=1, column_slice=1):
|
|
87
|
+
ch.grid.rect(gp=ch.gpar(fill="transparent", col="gold", lwd=2))
|
|
88
|
+
|
|
89
|
+
res._device.fig.savefig("heatmap.png", dpi=150, facecolor="white")
|
|
90
|
+
```
|
|
91
|
+
|
|
92
|
+
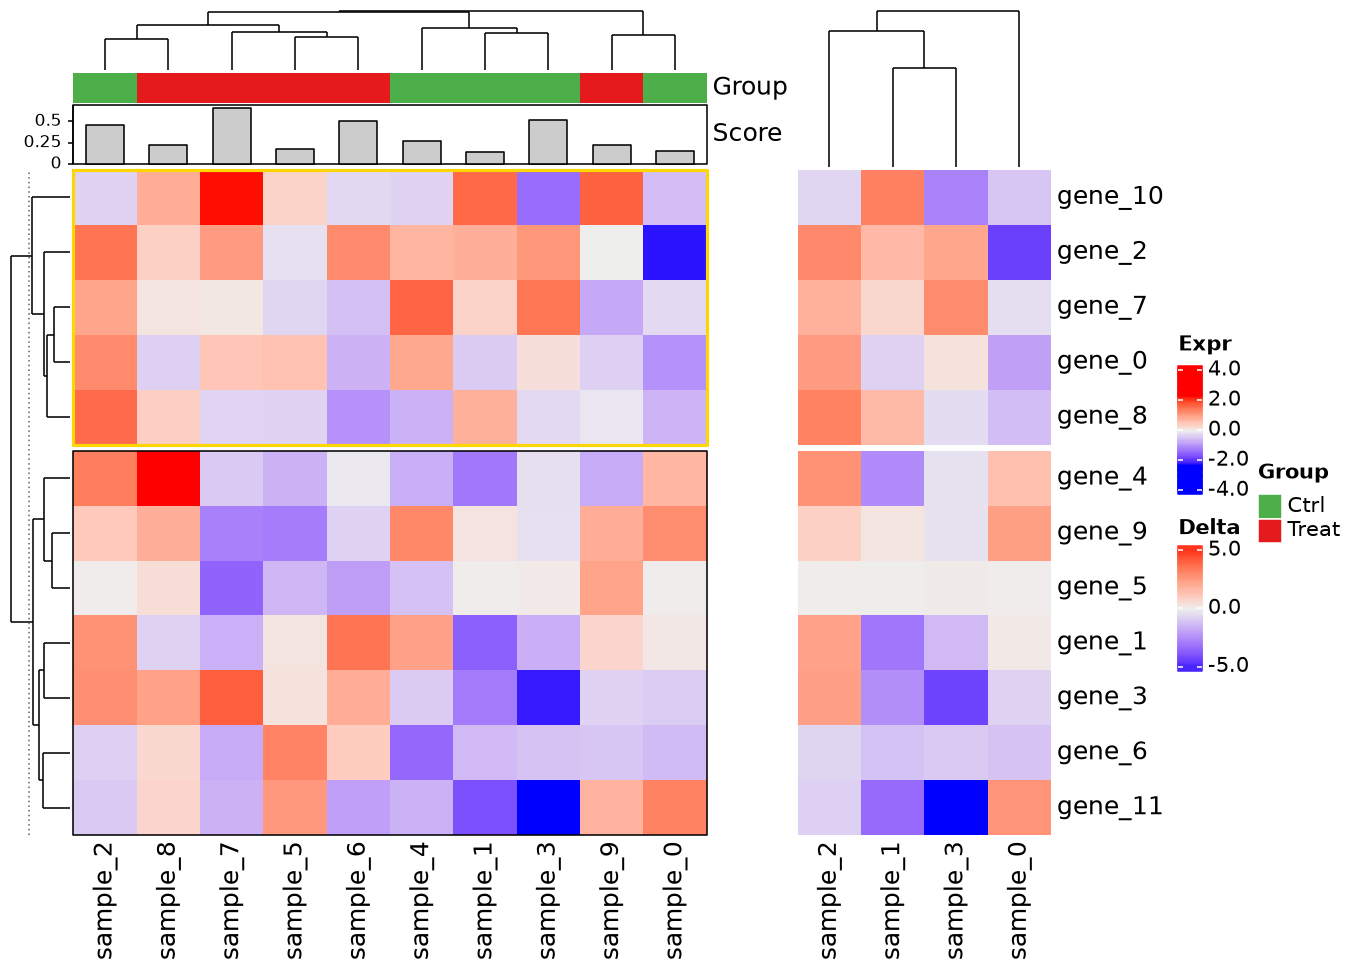
|
|
93
|
+
|
|
94
|
+
## Gallery of Examples & Output Figures
|
|
95
|
+
|
|
96
|
+
All figures below are generated directly by [`examples/showcase_gallery.py`](https://github.com/zhanxw/ComplexHeatmap-py/blob/main/examples/showcase_gallery.py).
|
|
97
|
+
|
|
98
|
+
### 1. Split Heatmap with Colored Dendrograms & Block Annotations
|
|
99
|
+
|
|
100
|
+
```python
|
|
101
|
+
dend_r = ch.color_branches(ch.hclust(ch.dist(mat)), k=2, col=["#E41A1C", "#377EB8"])
|
|
102
|
+
dend_c = ch.color_branches(ch.hclust(ch.dist(mat.T)), k=3, col=["#4DAF4A", "#984EA3", "#FF7F00"])
|
|
103
|
+
ht = ch.Heatmap(
|
|
104
|
+
mat, name="Z-score",
|
|
105
|
+
cluster_rows=dend_r, row_split=2,
|
|
106
|
+
cluster_columns=dend_c, column_split=3,
|
|
107
|
+
top_annotation=top_ha, left_annotation=left_ha, border=True,
|
|
108
|
+
)
|
|
109
|
+
ht.draw(save="02_single_heatmap_split.png")
|
|
110
|
+
```
|
|
111
|
+
|
|
112
|
+
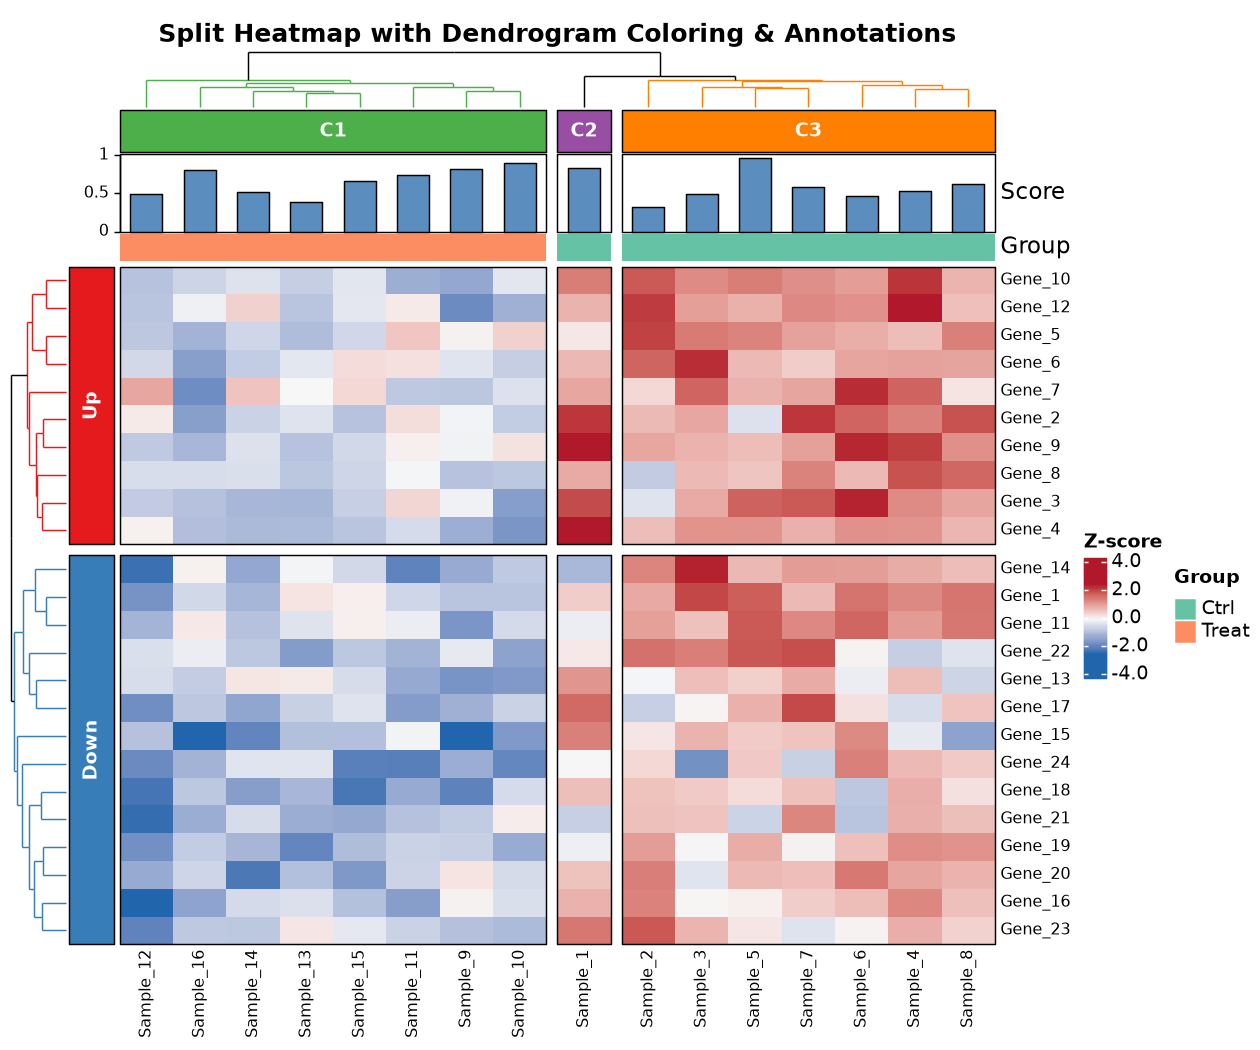
|
|
113
|
+
|
|
114
|
+
### 2. Multi-Track Annotations Zoo (`anno_points`, `anno_lines`, `anno_barplot`, `anno_boxplot`, `anno_density`, `anno_horizon`, `anno_mark`, `anno_textbox`)
|
|
115
|
+
|
|
116
|
+
```python
|
|
117
|
+
top_ha = ch.HeatmapAnnotation(
|
|
118
|
+
Simple=list("AB" * 10),
|
|
119
|
+
Points=ch.anno_points(pts),
|
|
120
|
+
Lines=ch.anno_lines(line_vals, add_points=True),
|
|
121
|
+
Bars=ch.anno_barplot(bar_vals),
|
|
122
|
+
Boxplot=ch.anno_boxplot(box_mat),
|
|
123
|
+
)
|
|
124
|
+
right_ha = ch.rowAnnotation(
|
|
125
|
+
Density=ch.anno_density(mat.to_numpy(), type="violin"),
|
|
126
|
+
Horizon=ch.anno_horizon(horizon_series),
|
|
127
|
+
Markers=ch.anno_mark(at=[2, 8, 15, 24, 33, 38], labels=["TP53", "KRAS", "EGFR", "MYC", "BRAF", "PTEN"]),
|
|
128
|
+
Text=ch.anno_textbox(sp, pathways_dict),
|
|
129
|
+
)
|
|
130
|
+
ch.Heatmap(mat, row_split=sp, top_annotation=top_ha, right_annotation=right_ha).draw(...)
|
|
131
|
+
```
|
|
132
|
+
|
|
133
|
+
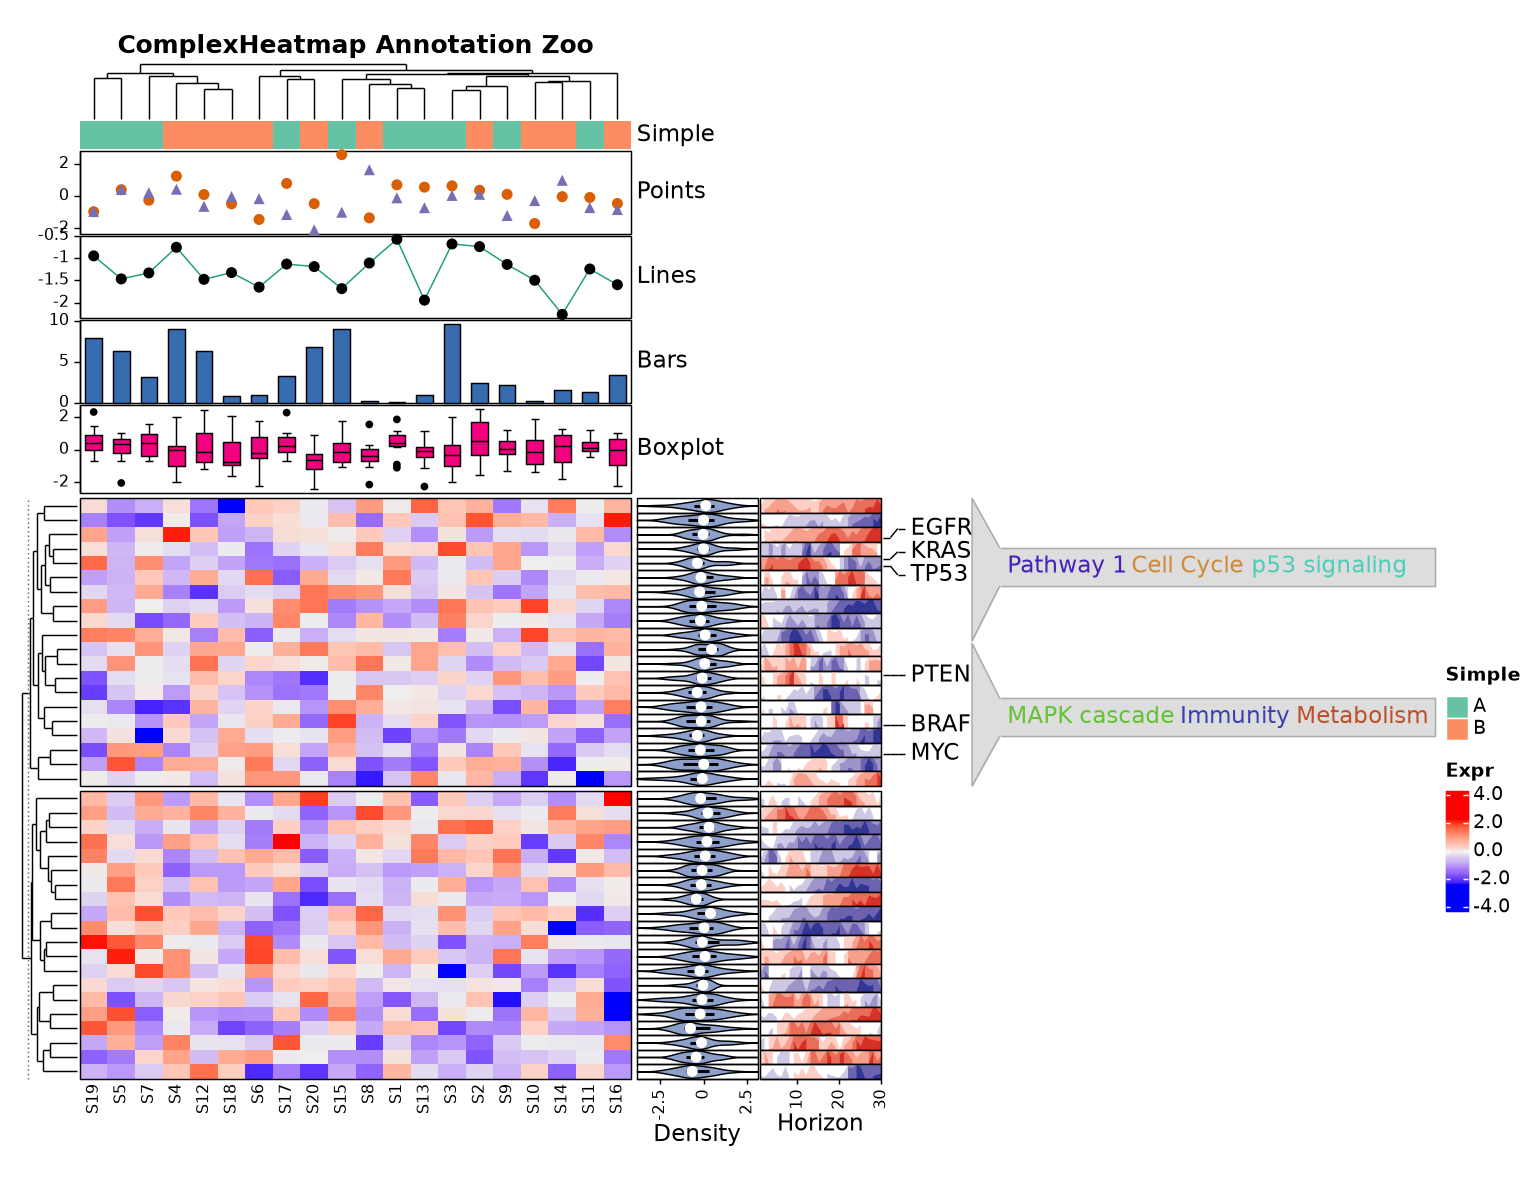
|
|
134
|
+
|
|
135
|
+
### 3. Measles Incidence Heatmap & Post-Draw Viewport Decoration
|
|
136
|
+
|
|
137
|
+
```python
|
|
138
|
+
mat = ch.load_dataset("measles")
|
|
139
|
+
ht = ch.Heatmap(mat, name="Cases", col=col_fun, cluster_rows=False, cluster_columns=False,
|
|
140
|
+
top_annotation=ha_col, right_annotation=ha_row, border=True)
|
|
141
|
+
ht.draw(width=11.0, height=8.0, dpi=140)
|
|
142
|
+
with ch.decorate_heatmap_body("Cases"):
|
|
143
|
+
ch.grid_segments(ch.unit(pos, "npc"), ch.unit(0, "npc"), ch.unit(pos, "npc"), ch.unit(1, "npc"),
|
|
144
|
+
gp=ch.gpar(lty="dashed", lwd=2))
|
|
145
|
+
ch.grid_text("Vaccine (1961)", x=ch.unit(pos + 0.01, "npc"), y=ch.unit(0.96, "npc"), just=["left", "top"])
|
|
146
|
+
```
|
|
147
|
+
|
|
148
|
+
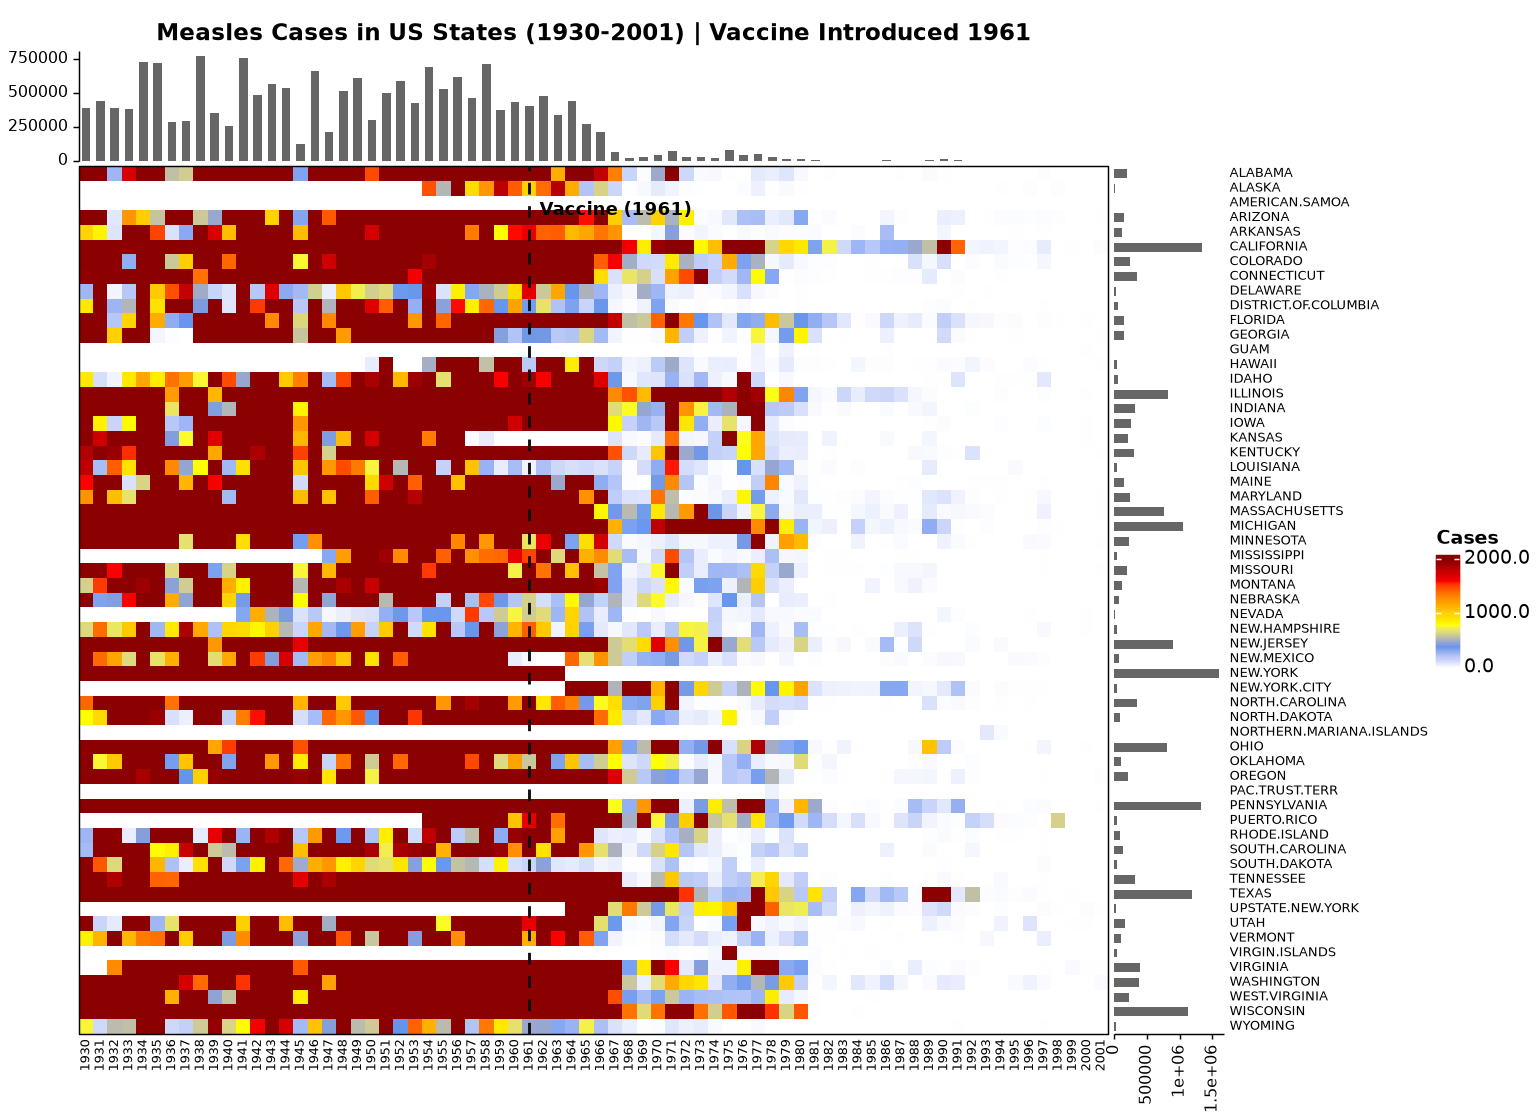
|
|
149
|
+
|
|
150
|
+
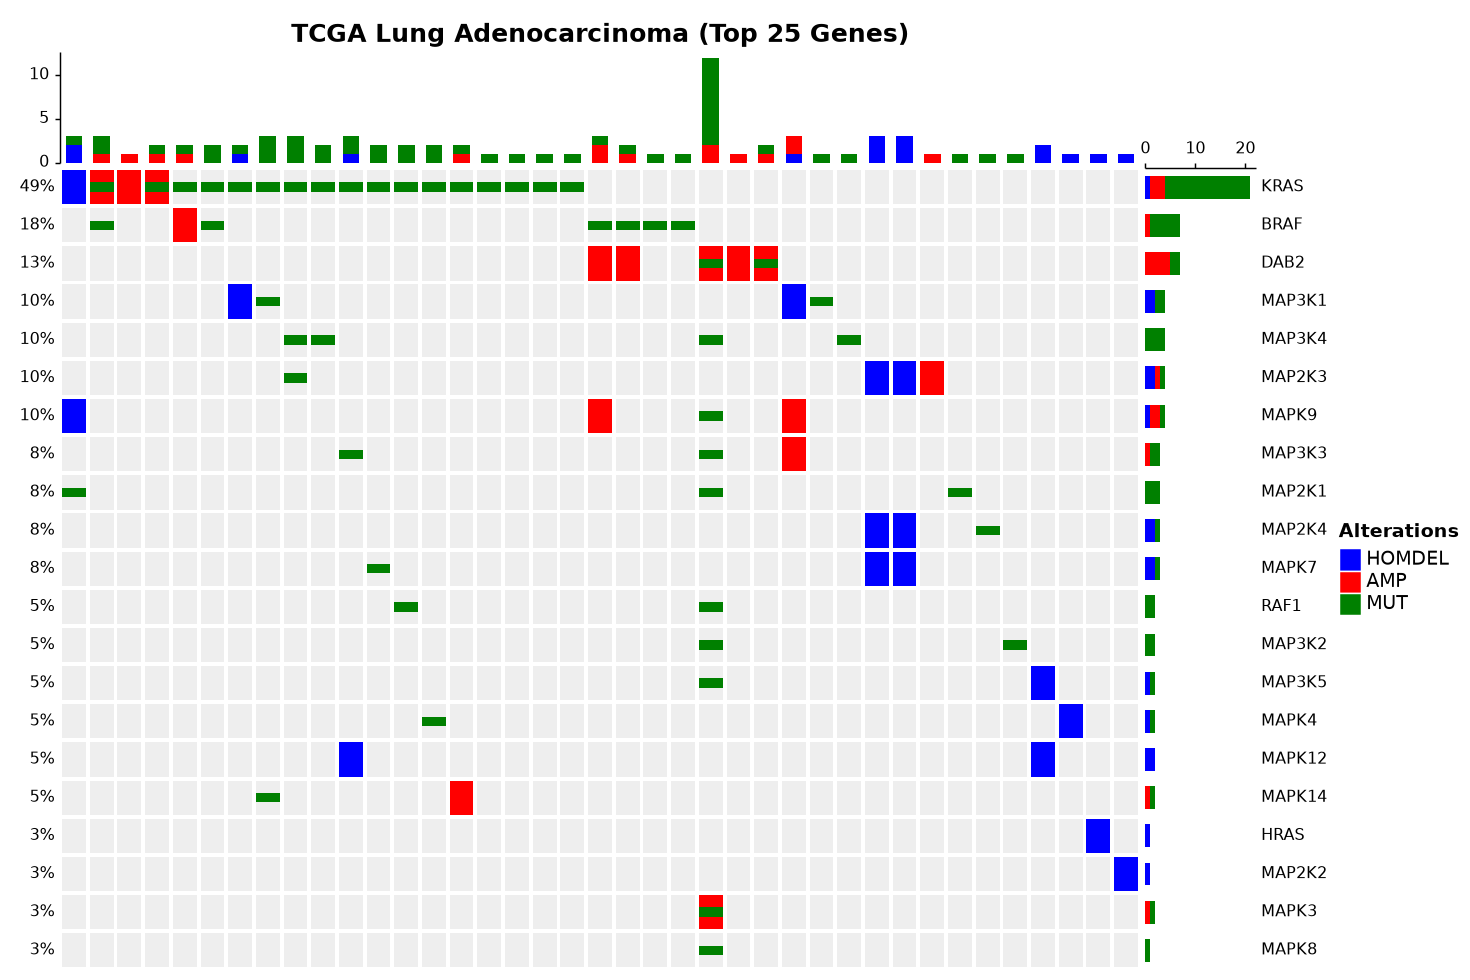
### 4. TCGA OncoPrint (`oncoPrint`)
|
|
151
|
+
|
|
152
|
+
```python
|
|
153
|
+
df = ch.load_dataset("tcga_lung_adenocarcinoma").iloc[:25, :60]
|
|
154
|
+
op = ch.oncoPrint(df, alter_fun=alter_fun, col=alt_col,
|
|
155
|
+
remove_empty_columns=True, remove_empty_rows=True)
|
|
156
|
+
op.draw(save="05_tcga_oncoprint.png")
|
|
157
|
+
```
|
|
158
|
+
|
|
159
|
+
|
|
160
|
+
|
|
161
|
+
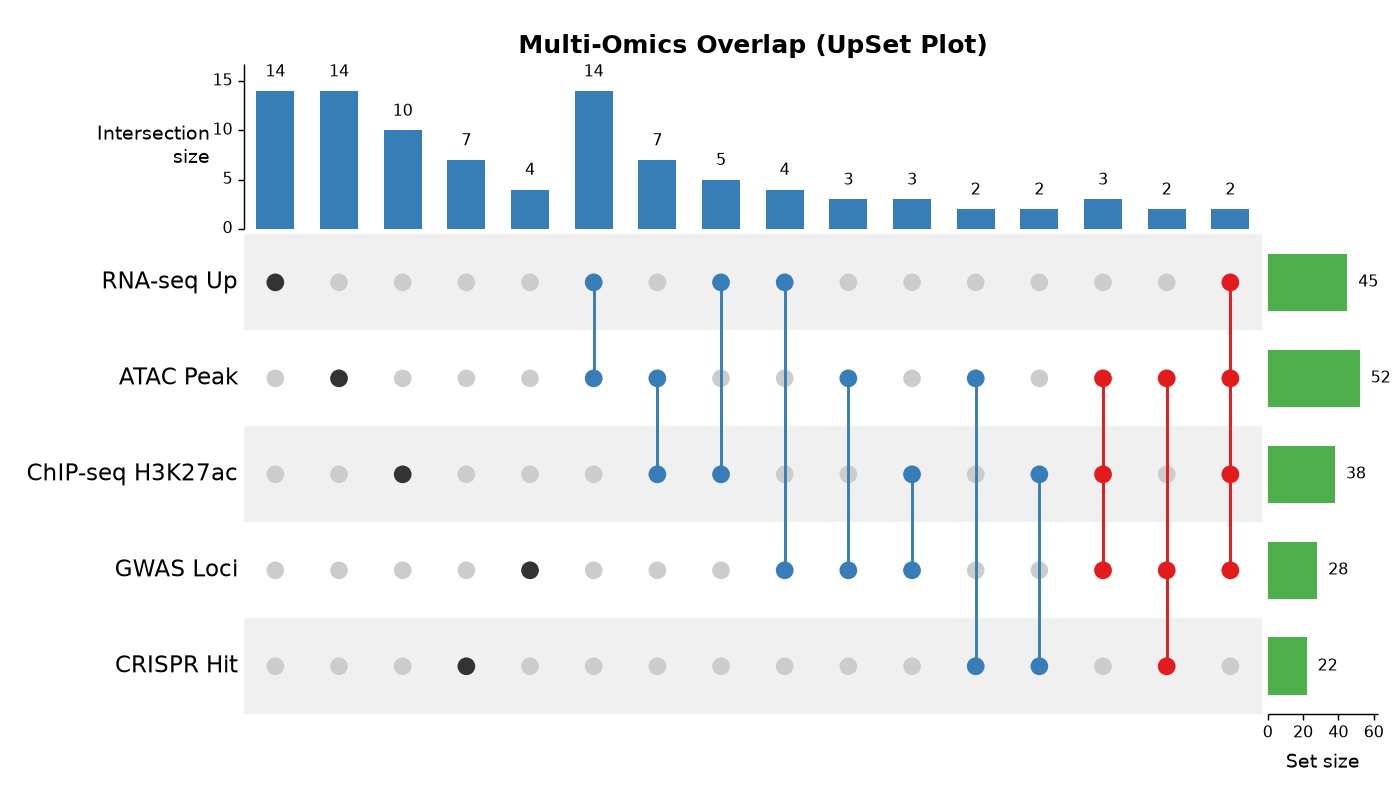
### 5. Multi-Omics UpSet Plot (`make_comb_mat` + `UpSet`)
|
|
162
|
+
|
|
163
|
+
```python
|
|
164
|
+
cm = ch.make_comb_mat(sets)
|
|
165
|
+
cm = cm[:, ch.comb_size(cm) >= 2]
|
|
166
|
+
up = ch.UpSet(
|
|
167
|
+
cm,
|
|
168
|
+
comb_col=["#E41A1C" if d >= 3 else ("#377EB8" if d == 2 else "#333333") for d in ch.comb_degree(cm)],
|
|
169
|
+
top_annotation=ch.upset_top_annotation(cm, add_numbers=True),
|
|
170
|
+
right_annotation=ch.upset_right_annotation(cm, add_numbers=True),
|
|
171
|
+
)
|
|
172
|
+
up.draw(save="06_upset_plot.png")
|
|
173
|
+
```
|
|
174
|
+
|
|
175
|
+
|
|
176
|
+
|
|
177
|
+
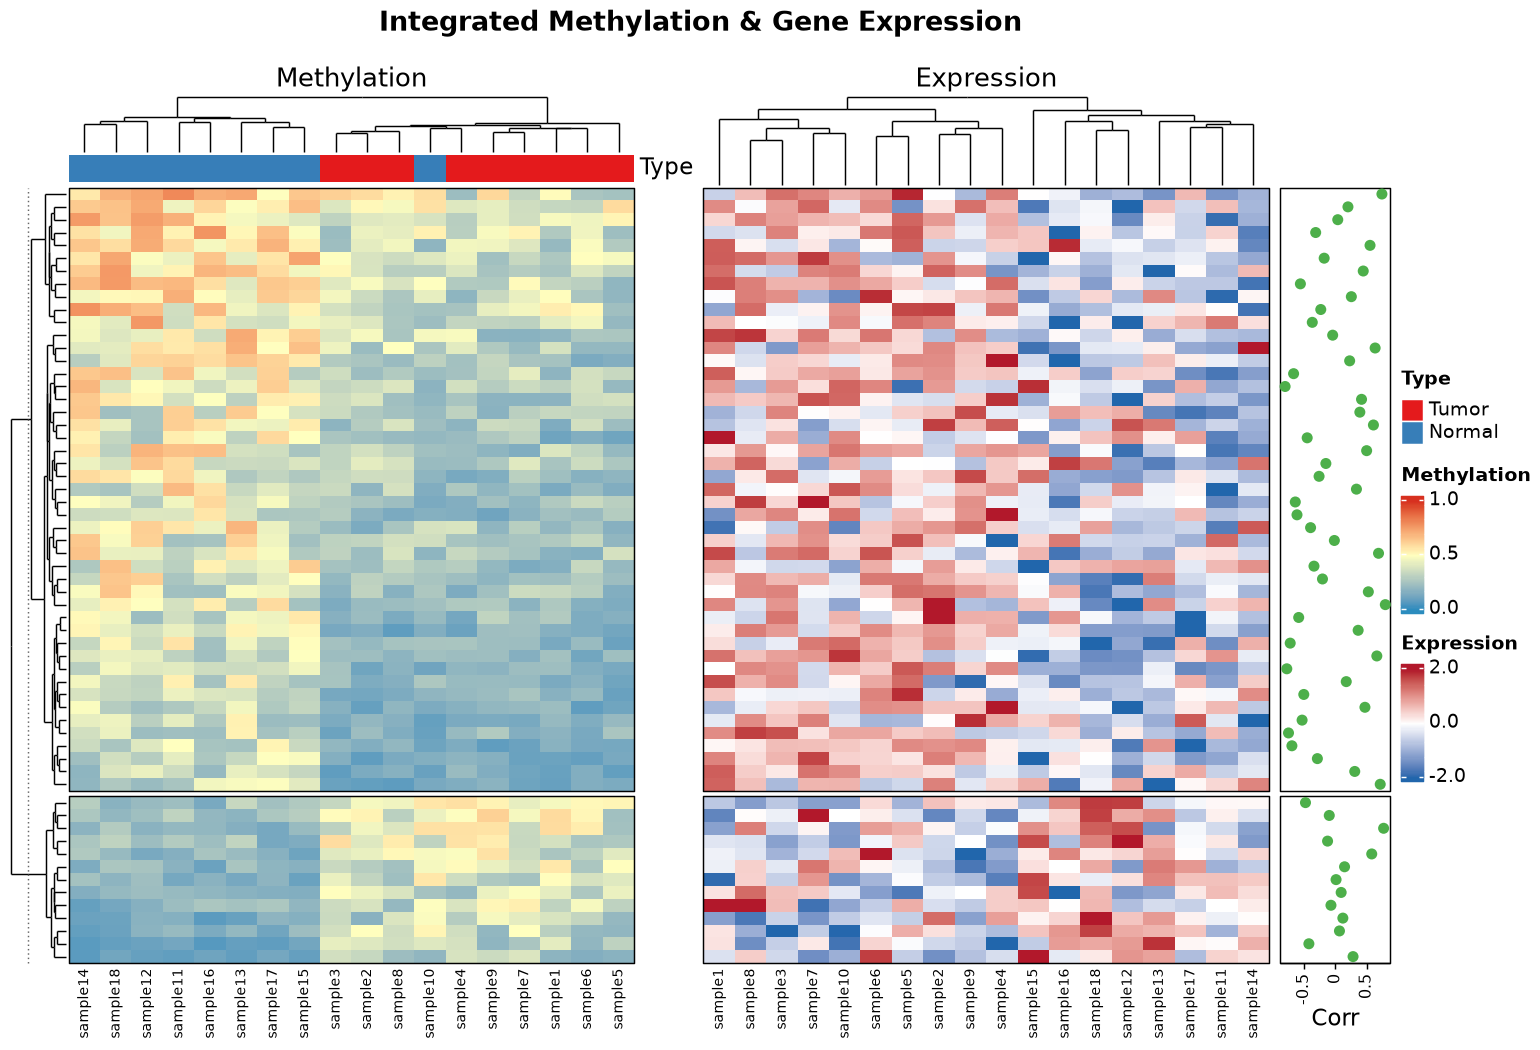
### 6. Integrated Multi-Heatmap List (`+` & `rowAnnotation`)
|
|
178
|
+
|
|
179
|
+
```python
|
|
180
|
+
hl = ht_meth + ht_expr + ch.rowAnnotation(Corr=ch.anno_points(corr_vals))
|
|
181
|
+
ch.draw(hl, column_title="Integrated Methylation & Gene Expression", merge_legends=True)
|
|
182
|
+
```
|
|
183
|
+
|
|
184
|
+
|
|
185
|
+
|
|
186
|
+
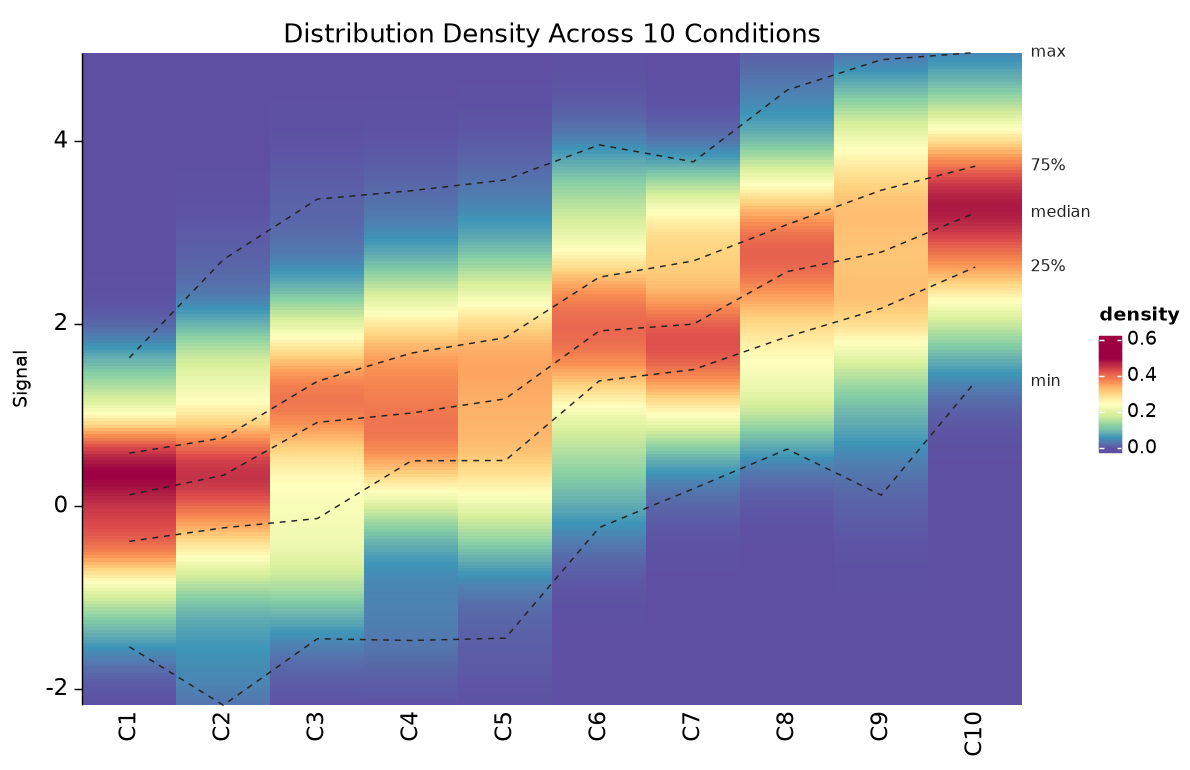
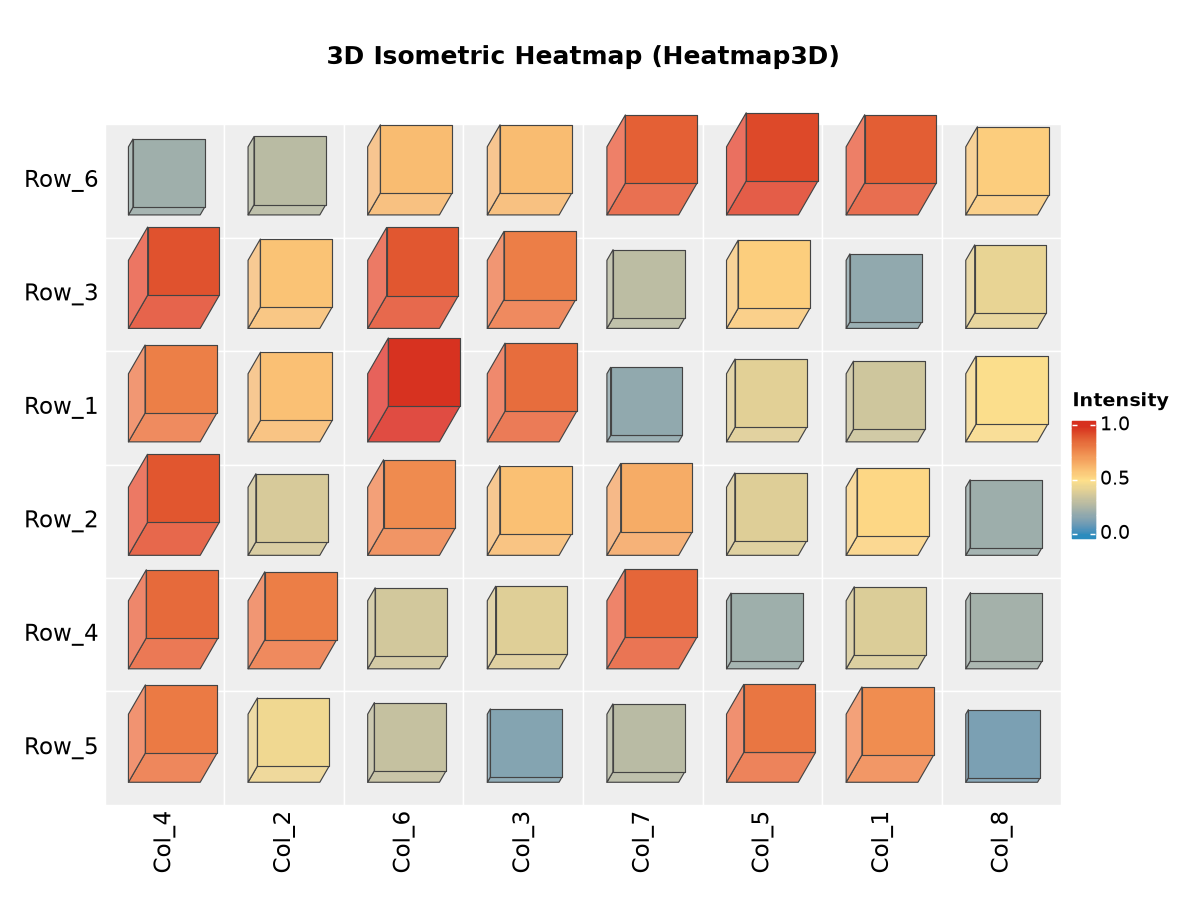
### 7. Density Heatmap & 3D Isometric Heatmap (`densityHeatmap`, `Heatmap3D`)
|
|
187
|
+
|
|
188
|
+
```python
|
|
189
|
+
ch.densityHeatmap(df_d, title="Distribution Density Across 10 Conditions", ylab="Signal").draw(...)
|
|
190
|
+
ch.Heatmap3D(mat_3d, name="Intensity", column_title="3D Isometric Heatmap (Heatmap3D)").draw(...)
|
|
191
|
+
```
|
|
192
|
+
|
|
193
|
+
|
|
194
|
+
|
|
195
|
+
|
|
196
|
+
## Implemented Modules & Features
|
|
197
|
+
|
|
198
|
+
- **Core Graphics & Units (`units.py`, `grid.py`, `text.py`, `colors.py`)**: Vectorized `Unit` arithmetic (`mm`, `cm`, `inches`, `pt`, `npc`, `snpc`, `native`, `lines`, `char`, `grobwidth`/`grobheight`), `gpar`, nested Matplotlib viewports (`Viewport`, `pushViewport`, `popViewport`, `seekViewport`, `grid.*`), `ax=`/`SubFigure` composition, `to_svg()`, `GridText` (`gt_render` rich markup), `textbox_grob`, `smartAlign2`, and `colorRamp2` (LAB/XYZ/sRGB/HSV) + `ColorMapping`.
|
|
199
|
+
- **Clustering & Dendrograms (`dendrogram.py`)**: `dist`, `dist2`, `hclust` (including distinct `ward.D` and `ward.D2` + optional `fastcluster`), `Dendrogram`, `cut_dendrogram`, `adjust_dend_by_x`, `merge_dendrogram`, `color_branches`, `cluster_within_group`, `cluster_between_groups`, `grid_dendrogram`, Path A cutree & Path B slice-first + consensus k-means clustering.
|
|
200
|
+
- **Annotations (`annotations.py`, `anno_funcs.py`)**: All 21 `anno_*` (`anno_simple`, `anno_empty`, `anno_points`, `anno_lines`, `anno_barplot`, `anno_boxplot`, `anno_histogram`, `anno_density`, `anno_joyplot`, `anno_horizon`, `anno_text`, `anno_numeric`, `anno_mark`, `anno_zoom`, `anno_link`, `anno_block`, `anno_summary`, `anno_image`, `anno_customize`, `anno_textbox`, `anno_oncoprint_barplot`) + 6 `row_anno_*` aliases, `HeatmapAnnotation`, `rowAnnotation`, `columnAnnotation`, `SingleAnnotation`, `AnnotationFunction`, `attach_annotation`.
|
|
201
|
+
- **Multi-Heatmap Lists & Legends (`heatmap.py`, `heatmap_list.py`, `legend.py`, `decorate.py`)**: Horizontal (`+`) and vertical (`%v%` / `/`) concatenation, `auto_adjust`, `main_heatmap` alignment, `Legend`/`packLegend` discrete + continuous + unequal-break legends, legend deduplication/`c_ColorMapping`, all 11 `decorate_*` viewport decorators, and slice/subsetting indexing (`ht[i, j]`, `ht_list[i, j]`).
|
|
202
|
+
- **High-Level Genomics & Plots (`oncoprint.py`, `upset.py`, `density.py`, `three_d.py`, `genomic.py`, `translate.py`)**: `oncoPrint` (with memoSort & alteration polygons), `make_comb_mat` / `UpSet` (`distinct`, `intersect`, `union`, genomic intervals, `t(m)`), `densityHeatmap`, `frequencyHeatmap`, `ks_dist`, `bar3D`, `Heatmap3D`, `IRanges`/`GRanges`/`bin_genome`/`normalize_genomic_signals_to_bins`, and drop-in translations `pheatmap`, `heatmap`, `heatmap_2`, `compare_*`.
|
|
203
|
+
- **Examples & Verification**: Complete ports of all **102 executable `.Rd` examples** ([examples/run_all_rd_examples.py](https://github.com/zhanxw/ComplexHeatmap-py/blob/main/examples/run_all_rd_examples.py)), publication gallery ([examples/showcase_gallery.py](https://github.com/zhanxw/ComplexHeatmap-py/blob/main/examples/showcase_gallery.py)), R-to-Python guide ([examples/r_to_python_guide.md](https://github.com/zhanxw/ComplexHeatmap-py/blob/main/examples/r_to_python_guide.md)), and `pytest` suite (`134 passed`).
|
|
204
|
+
|
|
205
|
+
## License & Attribution
|
|
206
|
+
|
|
207
|
+
Released under the [MIT License](https://github.com/zhanxw/ComplexHeatmap-py/blob/main/LICENSE). Ported from the R/Bioconductor [ComplexHeatmap](https://github.com/jokergoo/ComplexHeatmap) package (v2.25.3), Copyright (c) 2020 Zuguang Gu (MIT License).
|
|
@@ -0,0 +1,174 @@
|
|
|
1
|
+
<p align="center">
|
|
2
|
+
<img src="https://raw.githubusercontent.com/zhanxw/ComplexHeatmap-py/main/examples/output/01_logo.png" alt="ComplexHeatmap-py Logo" width="220" />
|
|
3
|
+
</p>
|
|
4
|
+
|
|
5
|
+
# ComplexHeatmap-py
|
|
6
|
+
|
|
7
|
+
Complete standalone Python port of the R/Bioconductor **ComplexHeatmap** (v2.25.3) package, powered by NumPy, SciPy, Pandas, Pillow, and Matplotlib.
|
|
8
|
+
|
|
9
|
+
## Installation
|
|
10
|
+
|
|
11
|
+
```bash
|
|
12
|
+
pip install ComplexHeatmap-py
|
|
13
|
+
```
|
|
14
|
+
|
|
15
|
+
Or install from source:
|
|
16
|
+
|
|
17
|
+
```bash
|
|
18
|
+
git clone https://github.com/zhanxw/ComplexHeatmap-py.git
|
|
19
|
+
cd ComplexHeatmap-py
|
|
20
|
+
pip install -e .
|
|
21
|
+
```
|
|
22
|
+
|
|
23
|
+
Both `import complexheatmap as ch` and `import ComplexHeatmap as ch` are supported.
|
|
24
|
+
|
|
25
|
+
## Quick Example
|
|
26
|
+
|
|
27
|
+
```python
|
|
28
|
+
import matplotlib
|
|
29
|
+
matplotlib.use("Agg")
|
|
30
|
+
import numpy as np
|
|
31
|
+
import pandas as pd
|
|
32
|
+
import complexheatmap as ch
|
|
33
|
+
|
|
34
|
+
ch.ht_opt(kmeans_seed=123)
|
|
35
|
+
rng = np.random.default_rng(123)
|
|
36
|
+
mat = pd.DataFrame(
|
|
37
|
+
rng.standard_normal((12, 10)),
|
|
38
|
+
index=[f"gene_{i}" for i in range(12)],
|
|
39
|
+
columns=[f"sample_{j}" for j in range(10)],
|
|
40
|
+
)
|
|
41
|
+
|
|
42
|
+
ha_top = ch.HeatmapAnnotation(
|
|
43
|
+
Group=["Ctrl"] * 5 + ["Treat"] * 5,
|
|
44
|
+
Score=ch.anno_barplot(rng.uniform(0, 1, 10)),
|
|
45
|
+
col={"Group": {"Ctrl": "#4DAF4A", "Treat": "#E41A1C"}},
|
|
46
|
+
)
|
|
47
|
+
|
|
48
|
+
ht1 = ch.Heatmap(mat, name="Expr", row_km=2, top_annotation=ha_top, border=True)
|
|
49
|
+
ht2 = ch.Heatmap(mat.iloc[:, :4] * 2, name="Delta")
|
|
50
|
+
res = ch.draw(ht1 + ht2, width=9.0, height=6.5, dpi=150)
|
|
51
|
+
|
|
52
|
+
# Post-draw decoration (just like R's decorate_heatmap_body)
|
|
53
|
+
with ch.decorate_heatmap_body("Expr", row_slice=1, column_slice=1):
|
|
54
|
+
ch.grid.rect(gp=ch.gpar(fill="transparent", col="gold", lwd=2))
|
|
55
|
+
|
|
56
|
+
res._device.fig.savefig("heatmap.png", dpi=150, facecolor="white")
|
|
57
|
+
```
|
|
58
|
+
|
|
59
|
+

|
|
60
|
+
|
|
61
|
+
## Gallery of Examples & Output Figures
|
|
62
|
+
|
|
63
|
+
All figures below are generated directly by [`examples/showcase_gallery.py`](https://github.com/zhanxw/ComplexHeatmap-py/blob/main/examples/showcase_gallery.py).
|
|
64
|
+
|
|
65
|
+
### 1. Split Heatmap with Colored Dendrograms & Block Annotations
|
|
66
|
+
|
|
67
|
+
```python
|
|
68
|
+
dend_r = ch.color_branches(ch.hclust(ch.dist(mat)), k=2, col=["#E41A1C", "#377EB8"])
|
|
69
|
+
dend_c = ch.color_branches(ch.hclust(ch.dist(mat.T)), k=3, col=["#4DAF4A", "#984EA3", "#FF7F00"])
|
|
70
|
+
ht = ch.Heatmap(
|
|
71
|
+
mat, name="Z-score",
|
|
72
|
+
cluster_rows=dend_r, row_split=2,
|
|
73
|
+
cluster_columns=dend_c, column_split=3,
|
|
74
|
+
top_annotation=top_ha, left_annotation=left_ha, border=True,
|
|
75
|
+
)
|
|
76
|
+
ht.draw(save="02_single_heatmap_split.png")
|
|
77
|
+
```
|
|
78
|
+
|
|
79
|
+

|
|
80
|
+
|
|
81
|
+
### 2. Multi-Track Annotations Zoo (`anno_points`, `anno_lines`, `anno_barplot`, `anno_boxplot`, `anno_density`, `anno_horizon`, `anno_mark`, `anno_textbox`)
|
|
82
|
+
|
|
83
|
+
```python
|
|
84
|
+
top_ha = ch.HeatmapAnnotation(
|
|
85
|
+
Simple=list("AB" * 10),
|
|
86
|
+
Points=ch.anno_points(pts),
|
|
87
|
+
Lines=ch.anno_lines(line_vals, add_points=True),
|
|
88
|
+
Bars=ch.anno_barplot(bar_vals),
|
|
89
|
+
Boxplot=ch.anno_boxplot(box_mat),
|
|
90
|
+
)
|
|
91
|
+
right_ha = ch.rowAnnotation(
|
|
92
|
+
Density=ch.anno_density(mat.to_numpy(), type="violin"),
|
|
93
|
+
Horizon=ch.anno_horizon(horizon_series),
|
|
94
|
+
Markers=ch.anno_mark(at=[2, 8, 15, 24, 33, 38], labels=["TP53", "KRAS", "EGFR", "MYC", "BRAF", "PTEN"]),
|
|
95
|
+
Text=ch.anno_textbox(sp, pathways_dict),
|
|
96
|
+
)
|
|
97
|
+
ch.Heatmap(mat, row_split=sp, top_annotation=top_ha, right_annotation=right_ha).draw(...)
|
|
98
|
+
```
|
|
99
|
+
|
|
100
|
+

|
|
101
|
+
|
|
102
|
+
### 3. Measles Incidence Heatmap & Post-Draw Viewport Decoration
|
|
103
|
+
|
|
104
|
+
```python
|
|
105
|
+
mat = ch.load_dataset("measles")
|
|
106
|
+
ht = ch.Heatmap(mat, name="Cases", col=col_fun, cluster_rows=False, cluster_columns=False,
|
|
107
|
+
top_annotation=ha_col, right_annotation=ha_row, border=True)
|
|
108
|
+
ht.draw(width=11.0, height=8.0, dpi=140)
|
|
109
|
+
with ch.decorate_heatmap_body("Cases"):
|
|
110
|
+
ch.grid_segments(ch.unit(pos, "npc"), ch.unit(0, "npc"), ch.unit(pos, "npc"), ch.unit(1, "npc"),
|
|
111
|
+
gp=ch.gpar(lty="dashed", lwd=2))
|
|
112
|
+
ch.grid_text("Vaccine (1961)", x=ch.unit(pos + 0.01, "npc"), y=ch.unit(0.96, "npc"), just=["left", "top"])
|
|
113
|
+
```
|
|
114
|
+
|
|
115
|
+

|
|
116
|
+
|
|
117
|
+
### 4. TCGA OncoPrint (`oncoPrint`)
|
|
118
|
+
|
|
119
|
+
```python
|
|
120
|
+
df = ch.load_dataset("tcga_lung_adenocarcinoma").iloc[:25, :60]
|
|
121
|
+
op = ch.oncoPrint(df, alter_fun=alter_fun, col=alt_col,
|
|
122
|
+
remove_empty_columns=True, remove_empty_rows=True)
|
|
123
|
+
op.draw(save="05_tcga_oncoprint.png")
|
|
124
|
+
```
|
|
125
|
+
|
|
126
|
+

|
|
127
|
+
|
|
128
|
+
### 5. Multi-Omics UpSet Plot (`make_comb_mat` + `UpSet`)
|
|
129
|
+
|
|
130
|
+
```python
|
|
131
|
+
cm = ch.make_comb_mat(sets)
|
|
132
|
+
cm = cm[:, ch.comb_size(cm) >= 2]
|
|
133
|
+
up = ch.UpSet(
|
|
134
|
+
cm,
|
|
135
|
+
comb_col=["#E41A1C" if d >= 3 else ("#377EB8" if d == 2 else "#333333") for d in ch.comb_degree(cm)],
|
|
136
|
+
top_annotation=ch.upset_top_annotation(cm, add_numbers=True),
|
|
137
|
+
right_annotation=ch.upset_right_annotation(cm, add_numbers=True),
|
|
138
|
+
)
|
|
139
|
+
up.draw(save="06_upset_plot.png")
|
|
140
|
+
```
|
|
141
|
+
|
|
142
|
+

|
|
143
|
+
|
|
144
|
+
### 6. Integrated Multi-Heatmap List (`+` & `rowAnnotation`)
|
|
145
|
+
|
|
146
|
+
```python
|
|
147
|
+
hl = ht_meth + ht_expr + ch.rowAnnotation(Corr=ch.anno_points(corr_vals))
|
|
148
|
+
ch.draw(hl, column_title="Integrated Methylation & Gene Expression", merge_legends=True)
|
|
149
|
+
```
|
|
150
|
+
|
|
151
|
+

|
|
152
|
+
|
|
153
|
+
### 7. Density Heatmap & 3D Isometric Heatmap (`densityHeatmap`, `Heatmap3D`)
|
|
154
|
+
|
|
155
|
+
```python
|
|
156
|
+
ch.densityHeatmap(df_d, title="Distribution Density Across 10 Conditions", ylab="Signal").draw(...)
|
|
157
|
+
ch.Heatmap3D(mat_3d, name="Intensity", column_title="3D Isometric Heatmap (Heatmap3D)").draw(...)
|
|
158
|
+
```
|
|
159
|
+
|
|
160
|
+

|
|
161
|
+

|
|
162
|
+
|
|
163
|
+
## Implemented Modules & Features
|
|
164
|
+
|
|
165
|
+
- **Core Graphics & Units (`units.py`, `grid.py`, `text.py`, `colors.py`)**: Vectorized `Unit` arithmetic (`mm`, `cm`, `inches`, `pt`, `npc`, `snpc`, `native`, `lines`, `char`, `grobwidth`/`grobheight`), `gpar`, nested Matplotlib viewports (`Viewport`, `pushViewport`, `popViewport`, `seekViewport`, `grid.*`), `ax=`/`SubFigure` composition, `to_svg()`, `GridText` (`gt_render` rich markup), `textbox_grob`, `smartAlign2`, and `colorRamp2` (LAB/XYZ/sRGB/HSV) + `ColorMapping`.
|
|
166
|
+
- **Clustering & Dendrograms (`dendrogram.py`)**: `dist`, `dist2`, `hclust` (including distinct `ward.D` and `ward.D2` + optional `fastcluster`), `Dendrogram`, `cut_dendrogram`, `adjust_dend_by_x`, `merge_dendrogram`, `color_branches`, `cluster_within_group`, `cluster_between_groups`, `grid_dendrogram`, Path A cutree & Path B slice-first + consensus k-means clustering.
|
|
167
|
+
- **Annotations (`annotations.py`, `anno_funcs.py`)**: All 21 `anno_*` (`anno_simple`, `anno_empty`, `anno_points`, `anno_lines`, `anno_barplot`, `anno_boxplot`, `anno_histogram`, `anno_density`, `anno_joyplot`, `anno_horizon`, `anno_text`, `anno_numeric`, `anno_mark`, `anno_zoom`, `anno_link`, `anno_block`, `anno_summary`, `anno_image`, `anno_customize`, `anno_textbox`, `anno_oncoprint_barplot`) + 6 `row_anno_*` aliases, `HeatmapAnnotation`, `rowAnnotation`, `columnAnnotation`, `SingleAnnotation`, `AnnotationFunction`, `attach_annotation`.
|
|
168
|
+
- **Multi-Heatmap Lists & Legends (`heatmap.py`, `heatmap_list.py`, `legend.py`, `decorate.py`)**: Horizontal (`+`) and vertical (`%v%` / `/`) concatenation, `auto_adjust`, `main_heatmap` alignment, `Legend`/`packLegend` discrete + continuous + unequal-break legends, legend deduplication/`c_ColorMapping`, all 11 `decorate_*` viewport decorators, and slice/subsetting indexing (`ht[i, j]`, `ht_list[i, j]`).
|
|
169
|
+
- **High-Level Genomics & Plots (`oncoprint.py`, `upset.py`, `density.py`, `three_d.py`, `genomic.py`, `translate.py`)**: `oncoPrint` (with memoSort & alteration polygons), `make_comb_mat` / `UpSet` (`distinct`, `intersect`, `union`, genomic intervals, `t(m)`), `densityHeatmap`, `frequencyHeatmap`, `ks_dist`, `bar3D`, `Heatmap3D`, `IRanges`/`GRanges`/`bin_genome`/`normalize_genomic_signals_to_bins`, and drop-in translations `pheatmap`, `heatmap`, `heatmap_2`, `compare_*`.
|
|
170
|
+
- **Examples & Verification**: Complete ports of all **102 executable `.Rd` examples** ([examples/run_all_rd_examples.py](https://github.com/zhanxw/ComplexHeatmap-py/blob/main/examples/run_all_rd_examples.py)), publication gallery ([examples/showcase_gallery.py](https://github.com/zhanxw/ComplexHeatmap-py/blob/main/examples/showcase_gallery.py)), R-to-Python guide ([examples/r_to_python_guide.md](https://github.com/zhanxw/ComplexHeatmap-py/blob/main/examples/r_to_python_guide.md)), and `pytest` suite (`134 passed`).
|
|
171
|
+
|
|
172
|
+
## License & Attribution
|
|
173
|
+
|
|
174
|
+
Released under the [MIT License](https://github.com/zhanxw/ComplexHeatmap-py/blob/main/LICENSE). Ported from the R/Bioconductor [ComplexHeatmap](https://github.com/jokergoo/ComplexHeatmap) package (v2.25.3), Copyright (c) 2020 Zuguang Gu (MIT License).
|
|
@@ -4,10 +4,11 @@ build-backend = "setuptools.build_meta"
|
|
|
4
4
|
|
|
5
5
|
[project]
|
|
6
6
|
name = "ComplexHeatmap-py"
|
|
7
|
-
version = "0.
|
|
7
|
+
version = "0.2.0"
|
|
8
8
|
description = "Python port of the ComplexHeatmap R/Bioconductor package for making complex heatmaps, annotations, oncoPrints, UpSet plots, and density heatmaps."
|
|
9
9
|
readme = "README.md"
|
|
10
|
-
license =
|
|
10
|
+
license = "MIT"
|
|
11
|
+
license-files = ["LICENSE"]
|
|
11
12
|
requires-python = ">=3.10"
|
|
12
13
|
authors = [
|
|
13
14
|
{name = "Xiaowei Zhan", email = "zhanxw@gmail.com"},
|
|
@@ -59,7 +60,7 @@ py-modules = ["ComplexHeatmap"]
|
|
|
59
60
|
where = ["src"]
|
|
60
61
|
|
|
61
62
|
[tool.setuptools.package-data]
|
|
62
|
-
complexheatmap = ["data/*.csv", "data/*.txt", "data/**/*.csv"]
|
|
63
|
+
complexheatmap = ["py.typed", "data/*.csv", "data/*.txt", "data/**/*.csv"]
|
|
63
64
|
|
|
64
65
|
[tool.pytest.ini_options]
|
|
65
66
|
testpaths = ["tests"]
|
|
@@ -0,0 +1,207 @@
|
|
|
1
|
+
Metadata-Version: 2.4
|
|
2
|
+
Name: ComplexHeatmap-py
|
|
3
|
+
Version: 0.2.0
|
|
4
|
+
Summary: Python port of the ComplexHeatmap R/Bioconductor package for making complex heatmaps, annotations, oncoPrints, UpSet plots, and density heatmaps.
|
|
5
|
+
Author-email: Xiaowei Zhan <zhanxw@gmail.com>
|
|
6
|
+
License-Expression: MIT
|
|
7
|
+
Project-URL: Homepage, https://github.com/zhanxw/ComplexHeatmap-py
|
|
8
|
+
Project-URL: Repository, https://github.com/zhanxw/ComplexHeatmap-py
|
|
9
|
+
Project-URL: Issues, https://github.com/zhanxw/ComplexHeatmap-py/issues
|
|
10
|
+
Keywords: heatmap,complexheatmap,bioinformatics,genomics,oncoprint,upset,matplotlib,visualization
|
|
11
|
+
Classifier: Development Status :: 4 - Beta
|
|
12
|
+
Classifier: Intended Audience :: Science/Research
|
|
13
|
+
Classifier: Operating System :: OS Independent
|
|
14
|
+
Classifier: Programming Language :: Python :: 3
|
|
15
|
+
Classifier: Programming Language :: Python :: 3.10
|
|
16
|
+
Classifier: Programming Language :: Python :: 3.11
|
|
17
|
+
Classifier: Programming Language :: Python :: 3.12
|
|
18
|
+
Classifier: Programming Language :: Python :: 3.13
|
|
19
|
+
Classifier: Programming Language :: Python :: 3.14
|
|
20
|
+
Classifier: Topic :: Scientific/Engineering :: Bio-Informatics
|
|
21
|
+
Classifier: Topic :: Scientific/Engineering :: Visualization
|
|
22
|
+
Requires-Python: >=3.10
|
|
23
|
+
Description-Content-Type: text/markdown
|
|
24
|
+
License-File: LICENSE
|
|
25
|
+
Requires-Dist: numpy>=1.24
|
|
26
|
+
Requires-Dist: scipy>=1.10
|
|
27
|
+
Requires-Dist: matplotlib>=3.7
|
|
28
|
+
Requires-Dist: pandas>=2.0
|
|
29
|
+
Requires-Dist: pillow>=10.0
|
|
30
|
+
Provides-Extra: dev
|
|
31
|
+
Requires-Dist: pytest>=7.0; extra == "dev"
|
|
32
|
+
Dynamic: license-file
|
|
33
|
+
|
|
34
|
+
<p align="center">
|
|
35
|
+
<img src="https://raw.githubusercontent.com/zhanxw/ComplexHeatmap-py/main/examples/output/01_logo.png" alt="ComplexHeatmap-py Logo" width="220" />
|
|
36
|
+
</p>
|
|
37
|
+
|
|
38
|
+
# ComplexHeatmap-py
|
|
39
|
+
|
|
40
|
+
Complete standalone Python port of the R/Bioconductor **ComplexHeatmap** (v2.25.3) package, powered by NumPy, SciPy, Pandas, Pillow, and Matplotlib.
|
|
41
|
+
|
|
42
|
+
## Installation
|
|
43
|
+
|
|
44
|
+
```bash
|
|
45
|
+
pip install ComplexHeatmap-py
|
|
46
|
+
```
|
|
47
|
+
|
|
48
|
+
Or install from source:
|
|
49
|
+
|
|
50
|
+
```bash
|
|
51
|
+
git clone https://github.com/zhanxw/ComplexHeatmap-py.git
|
|
52
|
+
cd ComplexHeatmap-py
|
|
53
|
+
pip install -e .
|
|
54
|
+
```
|
|
55
|
+
|
|
56
|
+
Both `import complexheatmap as ch` and `import ComplexHeatmap as ch` are supported.
|
|
57
|
+
|
|
58
|
+
## Quick Example
|
|
59
|
+
|
|
60
|
+
```python
|
|
61
|
+
import matplotlib
|
|
62
|
+
matplotlib.use("Agg")
|
|
63
|
+
import numpy as np
|
|
64
|
+
import pandas as pd
|
|
65
|
+
import complexheatmap as ch
|
|
66
|
+
|
|
67
|
+
ch.ht_opt(kmeans_seed=123)
|
|
68
|
+
rng = np.random.default_rng(123)
|
|
69
|
+
mat = pd.DataFrame(
|
|
70
|
+
rng.standard_normal((12, 10)),
|
|
71
|
+
index=[f"gene_{i}" for i in range(12)],
|
|
72
|
+
columns=[f"sample_{j}" for j in range(10)],
|
|
73
|
+
)
|
|
74
|
+
|
|
75
|
+
ha_top = ch.HeatmapAnnotation(
|
|
76
|
+
Group=["Ctrl"] * 5 + ["Treat"] * 5,
|
|
77
|
+
Score=ch.anno_barplot(rng.uniform(0, 1, 10)),
|
|
78
|
+
col={"Group": {"Ctrl": "#4DAF4A", "Treat": "#E41A1C"}},
|
|
79
|
+
)
|
|
80
|
+
|
|
81
|
+
ht1 = ch.Heatmap(mat, name="Expr", row_km=2, top_annotation=ha_top, border=True)
|
|
82
|
+
ht2 = ch.Heatmap(mat.iloc[:, :4] * 2, name="Delta")
|
|
83
|
+
res = ch.draw(ht1 + ht2, width=9.0, height=6.5, dpi=150)
|
|
84
|
+
|
|
85
|
+
# Post-draw decoration (just like R's decorate_heatmap_body)
|
|
86
|
+
with ch.decorate_heatmap_body("Expr", row_slice=1, column_slice=1):
|
|
87
|
+
ch.grid.rect(gp=ch.gpar(fill="transparent", col="gold", lwd=2))
|
|
88
|
+
|
|
89
|
+
res._device.fig.savefig("heatmap.png", dpi=150, facecolor="white")
|
|
90
|
+
```
|
|
91
|
+
|
|
92
|
+

|
|
93
|
+
|
|
94
|
+
## Gallery of Examples & Output Figures
|
|
95
|
+
|
|
96
|
+
All figures below are generated directly by [`examples/showcase_gallery.py`](https://github.com/zhanxw/ComplexHeatmap-py/blob/main/examples/showcase_gallery.py).
|
|
97
|
+
|
|
98
|
+
### 1. Split Heatmap with Colored Dendrograms & Block Annotations
|
|
99
|
+
|
|
100
|
+
```python
|
|
101
|
+
dend_r = ch.color_branches(ch.hclust(ch.dist(mat)), k=2, col=["#E41A1C", "#377EB8"])
|
|
102
|
+
dend_c = ch.color_branches(ch.hclust(ch.dist(mat.T)), k=3, col=["#4DAF4A", "#984EA3", "#FF7F00"])
|
|
103
|
+
ht = ch.Heatmap(
|
|
104
|
+
mat, name="Z-score",
|
|
105
|
+
cluster_rows=dend_r, row_split=2,
|
|
106
|
+
cluster_columns=dend_c, column_split=3,
|
|
107
|
+
top_annotation=top_ha, left_annotation=left_ha, border=True,
|
|
108
|
+
)
|
|
109
|
+
ht.draw(save="02_single_heatmap_split.png")
|
|
110
|
+
```
|
|
111
|
+
|
|
112
|
+

|
|
113
|
+
|
|
114
|
+
### 2. Multi-Track Annotations Zoo (`anno_points`, `anno_lines`, `anno_barplot`, `anno_boxplot`, `anno_density`, `anno_horizon`, `anno_mark`, `anno_textbox`)
|
|
115
|
+
|
|
116
|
+
```python
|
|
117
|
+
top_ha = ch.HeatmapAnnotation(
|
|
118
|
+
Simple=list("AB" * 10),
|
|
119
|
+
Points=ch.anno_points(pts),
|
|
120
|
+
Lines=ch.anno_lines(line_vals, add_points=True),
|
|
121
|
+
Bars=ch.anno_barplot(bar_vals),
|
|
122
|
+
Boxplot=ch.anno_boxplot(box_mat),
|
|
123
|
+
)
|
|
124
|
+
right_ha = ch.rowAnnotation(
|
|
125
|
+
Density=ch.anno_density(mat.to_numpy(), type="violin"),
|
|
126
|
+
Horizon=ch.anno_horizon(horizon_series),
|
|
127
|
+
Markers=ch.anno_mark(at=[2, 8, 15, 24, 33, 38], labels=["TP53", "KRAS", "EGFR", "MYC", "BRAF", "PTEN"]),
|
|
128
|
+
Text=ch.anno_textbox(sp, pathways_dict),
|
|
129
|
+
)
|
|
130
|
+
ch.Heatmap(mat, row_split=sp, top_annotation=top_ha, right_annotation=right_ha).draw(...)
|
|
131
|
+
```
|
|
132
|
+
|
|
133
|
+

|
|
134
|
+
|
|
135
|
+
### 3. Measles Incidence Heatmap & Post-Draw Viewport Decoration
|
|
136
|
+
|
|
137
|
+
```python
|
|
138
|
+
mat = ch.load_dataset("measles")
|
|
139
|
+
ht = ch.Heatmap(mat, name="Cases", col=col_fun, cluster_rows=False, cluster_columns=False,
|
|
140
|
+
top_annotation=ha_col, right_annotation=ha_row, border=True)
|
|
141
|
+
ht.draw(width=11.0, height=8.0, dpi=140)
|
|
142
|
+
with ch.decorate_heatmap_body("Cases"):
|
|
143
|
+
ch.grid_segments(ch.unit(pos, "npc"), ch.unit(0, "npc"), ch.unit(pos, "npc"), ch.unit(1, "npc"),
|
|
144
|
+
gp=ch.gpar(lty="dashed", lwd=2))
|
|
145
|
+
ch.grid_text("Vaccine (1961)", x=ch.unit(pos + 0.01, "npc"), y=ch.unit(0.96, "npc"), just=["left", "top"])
|
|
146
|
+
```
|
|
147
|
+
|
|
148
|
+

|
|
149
|
+
|
|
150
|
+
### 4. TCGA OncoPrint (`oncoPrint`)
|
|
151
|
+
|
|
152
|
+
```python
|
|
153
|
+
df = ch.load_dataset("tcga_lung_adenocarcinoma").iloc[:25, :60]
|
|
154
|
+
op = ch.oncoPrint(df, alter_fun=alter_fun, col=alt_col,
|
|
155
|
+
remove_empty_columns=True, remove_empty_rows=True)
|
|
156
|
+
op.draw(save="05_tcga_oncoprint.png")
|
|
157
|
+
```
|
|
158
|
+
|
|
159
|
+

|
|
160
|
+
|
|
161
|
+
### 5. Multi-Omics UpSet Plot (`make_comb_mat` + `UpSet`)
|
|
162
|
+
|
|
163
|
+
```python
|
|
164
|
+
cm = ch.make_comb_mat(sets)
|
|
165
|
+
cm = cm[:, ch.comb_size(cm) >= 2]
|
|
166
|
+
up = ch.UpSet(
|
|
167
|
+
cm,
|
|
168
|
+
comb_col=["#E41A1C" if d >= 3 else ("#377EB8" if d == 2 else "#333333") for d in ch.comb_degree(cm)],
|
|
169
|
+
top_annotation=ch.upset_top_annotation(cm, add_numbers=True),
|
|
170
|
+
right_annotation=ch.upset_right_annotation(cm, add_numbers=True),
|
|
171
|
+
)
|
|
172
|
+
up.draw(save="06_upset_plot.png")
|
|
173
|
+
```
|
|
174
|
+
|
|
175
|
+

|
|
176
|
+
|
|
177
|
+
### 6. Integrated Multi-Heatmap List (`+` & `rowAnnotation`)
|
|
178
|
+
|
|
179
|
+
```python
|
|
180
|
+
hl = ht_meth + ht_expr + ch.rowAnnotation(Corr=ch.anno_points(corr_vals))
|
|
181
|
+
ch.draw(hl, column_title="Integrated Methylation & Gene Expression", merge_legends=True)
|
|
182
|
+
```
|
|
183
|
+
|
|
184
|
+

|
|
185
|
+
|
|
186
|
+
### 7. Density Heatmap & 3D Isometric Heatmap (`densityHeatmap`, `Heatmap3D`)
|
|
187
|
+
|
|
188
|
+
```python
|
|
189
|
+
ch.densityHeatmap(df_d, title="Distribution Density Across 10 Conditions", ylab="Signal").draw(...)
|
|
190
|
+
ch.Heatmap3D(mat_3d, name="Intensity", column_title="3D Isometric Heatmap (Heatmap3D)").draw(...)
|
|
191
|
+
```
|
|
192
|
+
|
|
193
|
+

|
|
194
|
+

|
|
195
|
+
|
|
196
|
+
## Implemented Modules & Features
|
|
197
|
+
|
|
198
|
+
- **Core Graphics & Units (`units.py`, `grid.py`, `text.py`, `colors.py`)**: Vectorized `Unit` arithmetic (`mm`, `cm`, `inches`, `pt`, `npc`, `snpc`, `native`, `lines`, `char`, `grobwidth`/`grobheight`), `gpar`, nested Matplotlib viewports (`Viewport`, `pushViewport`, `popViewport`, `seekViewport`, `grid.*`), `ax=`/`SubFigure` composition, `to_svg()`, `GridText` (`gt_render` rich markup), `textbox_grob`, `smartAlign2`, and `colorRamp2` (LAB/XYZ/sRGB/HSV) + `ColorMapping`.
|
|
199
|
+
- **Clustering & Dendrograms (`dendrogram.py`)**: `dist`, `dist2`, `hclust` (including distinct `ward.D` and `ward.D2` + optional `fastcluster`), `Dendrogram`, `cut_dendrogram`, `adjust_dend_by_x`, `merge_dendrogram`, `color_branches`, `cluster_within_group`, `cluster_between_groups`, `grid_dendrogram`, Path A cutree & Path B slice-first + consensus k-means clustering.
|
|
200
|
+
- **Annotations (`annotations.py`, `anno_funcs.py`)**: All 21 `anno_*` (`anno_simple`, `anno_empty`, `anno_points`, `anno_lines`, `anno_barplot`, `anno_boxplot`, `anno_histogram`, `anno_density`, `anno_joyplot`, `anno_horizon`, `anno_text`, `anno_numeric`, `anno_mark`, `anno_zoom`, `anno_link`, `anno_block`, `anno_summary`, `anno_image`, `anno_customize`, `anno_textbox`, `anno_oncoprint_barplot`) + 6 `row_anno_*` aliases, `HeatmapAnnotation`, `rowAnnotation`, `columnAnnotation`, `SingleAnnotation`, `AnnotationFunction`, `attach_annotation`.
|
|
201
|
+
- **Multi-Heatmap Lists & Legends (`heatmap.py`, `heatmap_list.py`, `legend.py`, `decorate.py`)**: Horizontal (`+`) and vertical (`%v%` / `/`) concatenation, `auto_adjust`, `main_heatmap` alignment, `Legend`/`packLegend` discrete + continuous + unequal-break legends, legend deduplication/`c_ColorMapping`, all 11 `decorate_*` viewport decorators, and slice/subsetting indexing (`ht[i, j]`, `ht_list[i, j]`).
|
|
202
|
+
- **High-Level Genomics & Plots (`oncoprint.py`, `upset.py`, `density.py`, `three_d.py`, `genomic.py`, `translate.py`)**: `oncoPrint` (with memoSort & alteration polygons), `make_comb_mat` / `UpSet` (`distinct`, `intersect`, `union`, genomic intervals, `t(m)`), `densityHeatmap`, `frequencyHeatmap`, `ks_dist`, `bar3D`, `Heatmap3D`, `IRanges`/`GRanges`/`bin_genome`/`normalize_genomic_signals_to_bins`, and drop-in translations `pheatmap`, `heatmap`, `heatmap_2`, `compare_*`.
|
|
203
|
+
- **Examples & Verification**: Complete ports of all **102 executable `.Rd` examples** ([examples/run_all_rd_examples.py](https://github.com/zhanxw/ComplexHeatmap-py/blob/main/examples/run_all_rd_examples.py)), publication gallery ([examples/showcase_gallery.py](https://github.com/zhanxw/ComplexHeatmap-py/blob/main/examples/showcase_gallery.py)), R-to-Python guide ([examples/r_to_python_guide.md](https://github.com/zhanxw/ComplexHeatmap-py/blob/main/examples/r_to_python_guide.md)), and `pytest` suite (`134 passed`).
|
|
204
|
+
|
|
205
|
+
## License & Attribution
|
|
206
|
+
|
|
207
|
+
Released under the [MIT License](https://github.com/zhanxw/ComplexHeatmap-py/blob/main/LICENSE). Ported from the R/Bioconductor [ComplexHeatmap](https://github.com/jokergoo/ComplexHeatmap) package (v2.25.3), Copyright (c) 2020 Zuguang Gu (MIT License).
|
{complexheatmap_py-0.1.0 → complexheatmap_py-0.2.0}/src/ComplexHeatmap_py.egg-info/SOURCES.txt
RENAMED
|
@@ -3,6 +3,7 @@ MANIFEST.in
|
|
|
3
3
|
README.md
|
|
4
4
|
pyproject.toml
|
|
5
5
|
src/ComplexHeatmap.py
|
|
6
|
+
src/ComplexHeatmap.pyi
|
|
6
7
|
src/ComplexHeatmap_py.egg-info/PKG-INFO
|
|
7
8
|
src/ComplexHeatmap_py.egg-info/SOURCES.txt
|
|
8
9
|
src/ComplexHeatmap_py.egg-info/dependency_links.txt
|
|
@@ -23,6 +24,7 @@ src/complexheatmap/heatmap.py
|
|
|
23
24
|
src/complexheatmap/heatmap_list.py
|
|
24
25
|
src/complexheatmap/legend.py
|
|
25
26
|
src/complexheatmap/oncoprint.py
|
|
27
|
+
src/complexheatmap/py.typed
|
|
26
28
|
src/complexheatmap/text.py
|
|
27
29
|
src/complexheatmap/three_d.py
|
|
28
30
|
src/complexheatmap/translate.py
|
|
@@ -59,4 +61,5 @@ tests/test_annotations_and_legends.py
|
|
|
59
61
|
tests/test_clustering_and_alignment.py
|
|
60
62
|
tests/test_core_and_colors.py
|
|
61
63
|
tests/test_highlevel_and_translate.py
|
|
62
|
-
tests/test_upset_and_oncoprint.py
|
|
64
|
+
tests/test_upset_and_oncoprint.py
|
|
65
|
+
tests/test_v02_improvements_and_visuals.py
|