prawn_charts 0.0.1
This diff represents the content of publicly available package versions that have been released to one of the supported registries. The information contained in this diff is provided for informational purposes only and reflects changes between package versions as they appear in their respective public registries.
- data/.gitignore +17 -0
- data/Gemfile +4 -0
- data/LICENSE.txt +22 -0
- data/README.md +51 -0
- data/Rakefile +1 -0
- data/images/prawn_charts_log_example.png +0 -0
- data/images/simple_linear_example.png +0 -0
- data/lib/data_collectors/container/container_data_collector.rb +57 -0
- data/lib/data_collectors/container/graph_title_data_collector.rb +13 -0
- data/lib/data_collectors/graph/horizontal_lines_data_collector.rb +20 -0
- data/lib/data_collectors/graph/linear_y_pdf_data_collector.rb +21 -0
- data/lib/data_collectors/graph/log_y_pdf_data_collector.rb +19 -0
- data/lib/data_collectors/graph/pdf_data_collector.rb +24 -0
- data/lib/data_collectors/graph/x_labels_data_collector.rb +27 -0
- data/lib/data_collectors/graph/x_pdf_data_collector.rb +14 -0
- data/lib/data_collectors/graph/y_labels_data_collector.rb +33 -0
- data/lib/data_collectors/graph/y_pdf_data_collector.rb +19 -0
- data/lib/examples/log_example.rb +131 -0
- data/lib/examples/simple_linear_example.rb +57 -0
- data/lib/examples/simple_log_example.rb +57 -0
- data/lib/prawn_charts/version.rb +3 -0
- data/lib/prawn_charts.rb +8 -0
- data/lib/renderers/prawn_chart_renderer.rb +29 -0
- data/prawn_charts.gemspec +22 -0
- data/spec/data_collectors/container/container_data_collector_spec.rb +57 -0
- data/spec/data_collectors/graph/horizontal_lines_data_collector_spec.rb +17 -0
- data/spec/data_collectors/graph/linear_y_pdf_data_collector_spec.rb +17 -0
- data/spec/data_collectors/graph/log_y_pdf_data_collector_spec.rb +24 -0
- data/spec/data_collectors/graph/pdf_data_collector_spec.rb +47 -0
- data/spec/data_collectors/graph/x_labels_data_collector_spec.rb +18 -0
- data/spec/data_collectors/graph/x_pdf_data_collector_spec.rb +21 -0
- data/spec/data_collectors/graph/y_labels_data_collector_spec.rb +19 -0
- data/spec/spec_helper.rb +1 -0
- metadata +119 -0
data/.gitignore
ADDED
data/Gemfile
ADDED
data/LICENSE.txt
ADDED
|
@@ -0,0 +1,22 @@
|
|
|
1
|
+
Copyright (c) 2013 MrPowers
|
|
2
|
+
|
|
3
|
+
MIT License
|
|
4
|
+
|
|
5
|
+
Permission is hereby granted, free of charge, to any person obtaining
|
|
6
|
+
a copy of this software and associated documentation files (the
|
|
7
|
+
"Software"), to deal in the Software without restriction, including
|
|
8
|
+
without limitation the rights to use, copy, modify, merge, publish,
|
|
9
|
+
distribute, sublicense, and/or sell copies of the Software, and to
|
|
10
|
+
permit persons to whom the Software is furnished to do so, subject to
|
|
11
|
+
the following conditions:
|
|
12
|
+
|
|
13
|
+
The above copyright notice and this permission notice shall be
|
|
14
|
+
included in all copies or substantial portions of the Software.
|
|
15
|
+
|
|
16
|
+
THE SOFTWARE IS PROVIDED "AS IS", WITHOUT WARRANTY OF ANY KIND,
|
|
17
|
+
EXPRESS OR IMPLIED, INCLUDING BUT NOT LIMITED TO THE WARRANTIES OF
|
|
18
|
+
MERCHANTABILITY, FITNESS FOR A PARTICULAR PURPOSE AND
|
|
19
|
+
NONINFRINGEMENT. IN NO EVENT SHALL THE AUTHORS OR COPYRIGHT HOLDERS BE
|
|
20
|
+
LIABLE FOR ANY CLAIM, DAMAGES OR OTHER LIABILITY, WHETHER IN AN ACTION
|
|
21
|
+
OF CONTRACT, TORT OR OTHERWISE, ARISING FROM, OUT OF OR IN CONNECTION
|
|
22
|
+
WITH THE SOFTWARE OR THE USE OR OTHER DEALINGS IN THE SOFTWARE.
|
data/README.md
ADDED
|
@@ -0,0 +1,51 @@
|
|
|
1
|
+
[](https://codeclimate.com/github/MrPowers/prawn_charts)
|
|
2
|
+
|
|
3
|
+
# Prawn Charts
|
|
4
|
+
|
|
5
|
+
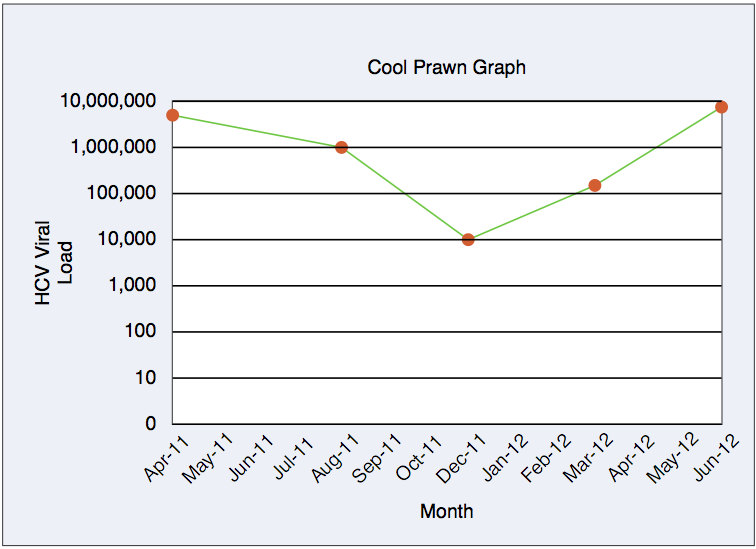
Prawn Charts is a Prawn graphing library to create linear or log line
|
|
6
|
+
charts in Prawn with no dependencies other than Prawn.
|
|
7
|
+
|
|
8
|
+
## Examples
|
|
9
|
+
|
|
10
|
+
Clone the respository and run the following script to generate a PDF
|
|
11
|
+
file with a log graph on your Desktop:
|
|
12
|
+
```bash
|
|
13
|
+
$ ruby lib/examples/log_example.rb
|
|
14
|
+
```
|
|
15
|
+
|
|
16
|
+
This script will generate a PDF file of a log graph that is only 6KB.
|
|
17
|
+
|
|
18
|
+
|
|
19
|
+
|
|
20
|
+
|
|
21
|
+
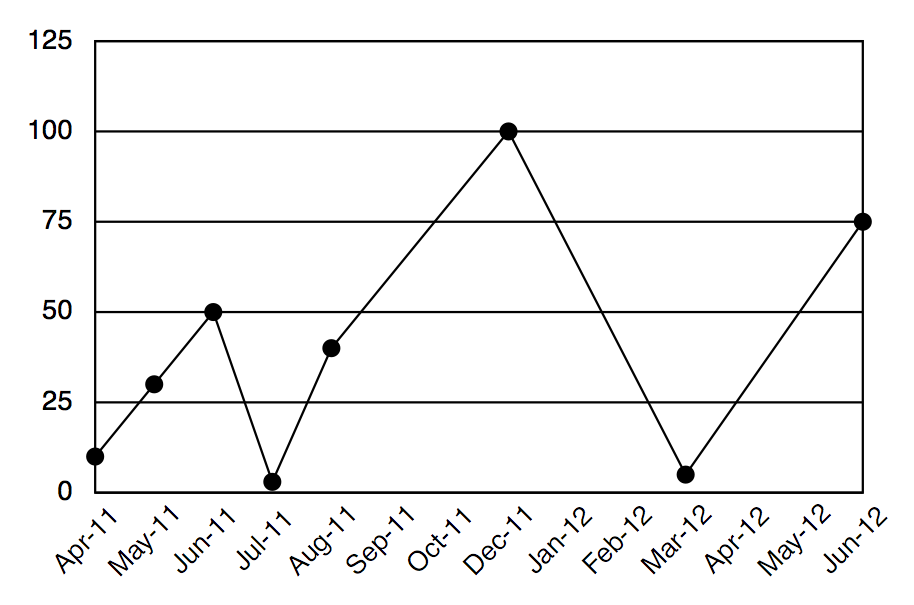
Prawn Charts can also be used to generate linear graphs. This graph
|
|
22
|
+
does not leverage built in features (i.e. graph title, y label, x label)
|
|
23
|
+
and demonstrates that Prawn Charts is easily customizable.
|
|
24
|
+
|
|
25
|
+
|
|
26
|
+
|
|
27
|
+
## Code Organization
|
|
28
|
+
|
|
29
|
+
The DataCollectors (located in lib/data_collectors) are responsible for
|
|
30
|
+
manipulating input data in a format suitable for the PrawnChartRenderer. The
|
|
31
|
+
PrawnChartRenderer module should be mixed in to Prawn::Document, so the
|
|
32
|
+
renderer methods can be called directly on the Prawn::Document object.
|
|
33
|
+
|
|
34
|
+
This example code shows how to use the PdfDataCollector to get formatted
|
|
35
|
+
data that can be passed to the draw_chart() and draw_dots() methods:
|
|
36
|
+
|
|
37
|
+
```ruby
|
|
38
|
+
Prawn::Document.extensions << PrawnChartRenderer
|
|
39
|
+
|
|
40
|
+
pdf = Prawn::Document.new
|
|
41
|
+
pdf.bounding_box([50, pdf.cursor], :width => graph_width_pdf, :height => graph_height_pdf) do
|
|
42
|
+
pdf.stroke_bounds
|
|
43
|
+
|
|
44
|
+
pdf_data = PdfDataCollector.new(scale, input_data, graph_width_pdf, graph_height_pdf, y_labels).collect
|
|
45
|
+
pdf.draw_chart(pdf_data)
|
|
46
|
+
pdf.draw_dots(pdf_data, dot_radius)
|
|
47
|
+
end
|
|
48
|
+
```
|
|
49
|
+
|
|
50
|
+
There are separate methods to draw_chart(), draw_dots(), draw_labels(),
|
|
51
|
+
draw_horizontal_lines(), and draw titles, so the charts can be customized.
|
data/Rakefile
ADDED
|
@@ -0,0 +1 @@
|
|
|
1
|
+
require "bundler/gem_tasks"
|
|
Binary file
|
|
Binary file
|
|
@@ -0,0 +1,57 @@
|
|
|
1
|
+
class ContainerDataCollector
|
|
2
|
+
attr_reader :inputs
|
|
3
|
+
def initialize(inputs)
|
|
4
|
+
@inputs = inputs
|
|
5
|
+
end
|
|
6
|
+
|
|
7
|
+
def height
|
|
8
|
+
bottom_gap +
|
|
9
|
+
inputs[:graph_height] +
|
|
10
|
+
top_gap
|
|
11
|
+
end
|
|
12
|
+
|
|
13
|
+
def width
|
|
14
|
+
left_gap + right_gap + inputs[:graph_width]
|
|
15
|
+
end
|
|
16
|
+
|
|
17
|
+
def graph_top_left
|
|
18
|
+
[left_gap, (height - top_gap)]
|
|
19
|
+
end
|
|
20
|
+
|
|
21
|
+
def graph_title_top_left
|
|
22
|
+
[left_gap, (bottom_gap + inputs[:graph_height] + inputs[:graph_title_height])]
|
|
23
|
+
end
|
|
24
|
+
|
|
25
|
+
def y_title_top_left
|
|
26
|
+
[inputs[:container_left_padding], (bottom_gap + inputs[:graph_height])]
|
|
27
|
+
end
|
|
28
|
+
|
|
29
|
+
def x_title_top_left
|
|
30
|
+
[left_gap, (inputs[:container_bottom_padding] + inputs[:x_title_height])]
|
|
31
|
+
end
|
|
32
|
+
|
|
33
|
+
private
|
|
34
|
+
|
|
35
|
+
# gap is area between container edge and graph
|
|
36
|
+
def left_gap
|
|
37
|
+
inputs[:container_left_padding] +
|
|
38
|
+
inputs[:y_label_width] +
|
|
39
|
+
inputs[:y_label_offset] +
|
|
40
|
+
inputs[:y_title_width]
|
|
41
|
+
end
|
|
42
|
+
|
|
43
|
+
def right_gap
|
|
44
|
+
inputs[:container_right_padding]
|
|
45
|
+
end
|
|
46
|
+
|
|
47
|
+
def top_gap
|
|
48
|
+
inputs[:container_top_padding] +
|
|
49
|
+
inputs[:graph_title_height]
|
|
50
|
+
end
|
|
51
|
+
|
|
52
|
+
def bottom_gap
|
|
53
|
+
inputs[:container_bottom_padding] +
|
|
54
|
+
inputs[:x_label_height] +
|
|
55
|
+
inputs[:x_title_height]
|
|
56
|
+
end
|
|
57
|
+
end
|
|
@@ -0,0 +1,13 @@
|
|
|
1
|
+
class GraphTitleDataCollector
|
|
2
|
+
attr_reader :graph_title, :position, :graph_title_height, :graph_title_width
|
|
3
|
+
def initialize(graph_title, position, graph_title_height, graph_title_width)
|
|
4
|
+
@graph_title = graph_title
|
|
5
|
+
@position = position
|
|
6
|
+
@graph_title_height = graph_title_height
|
|
7
|
+
@graph_title_width = graph_title_width
|
|
8
|
+
end
|
|
9
|
+
|
|
10
|
+
def collect
|
|
11
|
+
{ title: graph_title, at: position, height: graph_title_height, width: graph_title_width }
|
|
12
|
+
end
|
|
13
|
+
end
|
|
@@ -0,0 +1,20 @@
|
|
|
1
|
+
class HorizontalLinesDataCollector
|
|
2
|
+
attr_reader :graph_height_pdf, :graph_width_pdf, :y_labels
|
|
3
|
+
def initialize(graph_height_pdf, graph_width_pdf, y_labels)
|
|
4
|
+
@graph_height_pdf = graph_height_pdf
|
|
5
|
+
@graph_width_pdf = graph_width_pdf
|
|
6
|
+
@y_labels = y_labels
|
|
7
|
+
end
|
|
8
|
+
|
|
9
|
+
def collect
|
|
10
|
+
y_labels.map.with_index do |_, index|
|
|
11
|
+
[0, graph_width_pdf, index * y_label_increment]
|
|
12
|
+
end
|
|
13
|
+
end
|
|
14
|
+
|
|
15
|
+
private
|
|
16
|
+
|
|
17
|
+
def y_label_increment
|
|
18
|
+
graph_height_pdf.to_f / (y_labels.count - 1)
|
|
19
|
+
end
|
|
20
|
+
end
|
|
@@ -0,0 +1,21 @@
|
|
|
1
|
+
class LinearYPdfDataCollector
|
|
2
|
+
attr_reader :input_data, :graph_height_pdf, :y_labels
|
|
3
|
+
def initialize(input_data, graph_height_pdf, y_labels)
|
|
4
|
+
@input_data = input_data
|
|
5
|
+
@graph_height_pdf = graph_height_pdf
|
|
6
|
+
@y_labels = y_labels
|
|
7
|
+
end
|
|
8
|
+
|
|
9
|
+
def collect
|
|
10
|
+
input_data.inject([]) do |memo, (_, y_units)|
|
|
11
|
+
result = y_units.nil? ? nil : y_units * pdf_points_per_unit
|
|
12
|
+
memo << result
|
|
13
|
+
end
|
|
14
|
+
end
|
|
15
|
+
|
|
16
|
+
private
|
|
17
|
+
|
|
18
|
+
def pdf_points_per_unit
|
|
19
|
+
graph_height_pdf.to_f / y_labels.max
|
|
20
|
+
end
|
|
21
|
+
end
|
|
@@ -0,0 +1,19 @@
|
|
|
1
|
+
class LogYPdfDataCollector
|
|
2
|
+
attr_reader :input_data, :graph_height_pdf, :y_labels
|
|
3
|
+
def initialize(input_data, graph_height_pdf, y_labels)
|
|
4
|
+
@input_data = input_data
|
|
5
|
+
@graph_height_pdf = graph_height_pdf
|
|
6
|
+
@y_labels = y_labels
|
|
7
|
+
end
|
|
8
|
+
|
|
9
|
+
def pdf_points_per_unit
|
|
10
|
+
graph_height_pdf.to_f / (y_labels.count - 1)
|
|
11
|
+
end
|
|
12
|
+
|
|
13
|
+
def collect
|
|
14
|
+
input_data.inject([]) do |memo, (_, y_units)|
|
|
15
|
+
result = y_units.nil? ? nil : (Math.log10(y_units) * pdf_points_per_unit)
|
|
16
|
+
memo << result
|
|
17
|
+
end
|
|
18
|
+
end
|
|
19
|
+
end
|
|
@@ -0,0 +1,24 @@
|
|
|
1
|
+
class PdfDataCollector
|
|
2
|
+
attr_reader :scale, :input_data, :graph_width_pdf, :graph_height_pdf, :y_labels
|
|
3
|
+
def initialize(scale, input_data, graph_width_pdf, graph_height_pdf, y_labels)
|
|
4
|
+
@scale = scale
|
|
5
|
+
@input_data = input_data
|
|
6
|
+
@graph_width_pdf = graph_width_pdf
|
|
7
|
+
@graph_height_pdf = graph_height_pdf
|
|
8
|
+
@y_labels = y_labels
|
|
9
|
+
end
|
|
10
|
+
|
|
11
|
+
def collect
|
|
12
|
+
x_pdf_data.zip(y_pdf_data).select { |x, y| [x, y] unless y.nil? }
|
|
13
|
+
end
|
|
14
|
+
|
|
15
|
+
private
|
|
16
|
+
|
|
17
|
+
def x_pdf_data
|
|
18
|
+
XPdfDataCollector.new(input_data, graph_width_pdf).collect
|
|
19
|
+
end
|
|
20
|
+
|
|
21
|
+
def y_pdf_data
|
|
22
|
+
YPdfDataCollector.new(scale, input_data, graph_height_pdf, y_labels).collect
|
|
23
|
+
end
|
|
24
|
+
end
|
|
@@ -0,0 +1,27 @@
|
|
|
1
|
+
class XLabelsDataCollector
|
|
2
|
+
attr_reader :input_data, :graph_width_pdf, :label_height, :label_width
|
|
3
|
+
def initialize(input_data, graph_width_pdf, label_height, label_width)
|
|
4
|
+
@input_data = input_data
|
|
5
|
+
@graph_width_pdf = graph_width_pdf
|
|
6
|
+
@label_height = label_height
|
|
7
|
+
@label_width = label_width
|
|
8
|
+
end
|
|
9
|
+
|
|
10
|
+
def horizontal_offset
|
|
11
|
+
label_width / 2
|
|
12
|
+
end
|
|
13
|
+
|
|
14
|
+
def collect
|
|
15
|
+
input_data.map.with_index do |(label, _), index|
|
|
16
|
+
x_pdf = x_pdf_data[index] - horizontal_offset
|
|
17
|
+
y_pdf = -(label_height)
|
|
18
|
+
[label, [x_pdf, y_pdf] ]
|
|
19
|
+
end
|
|
20
|
+
end
|
|
21
|
+
|
|
22
|
+
private
|
|
23
|
+
|
|
24
|
+
def x_pdf_data
|
|
25
|
+
XPdfDataCollector.new(input_data, graph_width_pdf).collect
|
|
26
|
+
end
|
|
27
|
+
end
|
|
@@ -0,0 +1,14 @@
|
|
|
1
|
+
class XPdfDataCollector
|
|
2
|
+
def initialize(input_data, graph_width_pdf)
|
|
3
|
+
@input_data = input_data
|
|
4
|
+
@graph_width_pdf = graph_width_pdf
|
|
5
|
+
end
|
|
6
|
+
|
|
7
|
+
def pdf_points_per_unit
|
|
8
|
+
@graph_width_pdf.to_f / (@input_data.length - 1)
|
|
9
|
+
end
|
|
10
|
+
|
|
11
|
+
def collect
|
|
12
|
+
0.step(@graph_width_pdf, pdf_points_per_unit).to_a
|
|
13
|
+
end
|
|
14
|
+
end
|
|
@@ -0,0 +1,33 @@
|
|
|
1
|
+
class YLabelsDataCollector
|
|
2
|
+
attr_reader :y_labels, :graph_height_pdf, :label_width, :label_height, :y_label_offset
|
|
3
|
+
def initialize(y_labels, graph_height_pdf, label_width, label_height, y_label_offset)
|
|
4
|
+
@y_labels = y_labels
|
|
5
|
+
@graph_height_pdf = graph_height_pdf
|
|
6
|
+
@label_width = label_width
|
|
7
|
+
@label_height = label_height
|
|
8
|
+
@y_label_offset = y_label_offset
|
|
9
|
+
end
|
|
10
|
+
|
|
11
|
+
def collect
|
|
12
|
+
y_labels.map.with_index do |y_label, index|
|
|
13
|
+
y_label = number_to_string_with_commas(y_label)
|
|
14
|
+
x_pdf = -label_width - y_label_offset
|
|
15
|
+
y_pdf = index * y_label_increment + vertical_offset
|
|
16
|
+
[y_label, [x_pdf, y_pdf]]
|
|
17
|
+
end
|
|
18
|
+
end
|
|
19
|
+
|
|
20
|
+
private
|
|
21
|
+
|
|
22
|
+
def vertical_offset
|
|
23
|
+
label_height / 2
|
|
24
|
+
end
|
|
25
|
+
|
|
26
|
+
def y_label_increment
|
|
27
|
+
graph_height_pdf.to_f / (y_labels.count - 1)
|
|
28
|
+
end
|
|
29
|
+
|
|
30
|
+
def number_to_string_with_commas(number)
|
|
31
|
+
number.to_s.reverse.gsub(/(\d{3})(?=\d)/, '\\1,').reverse
|
|
32
|
+
end
|
|
33
|
+
end
|
|
@@ -0,0 +1,19 @@
|
|
|
1
|
+
class YPdfDataCollector
|
|
2
|
+
attr_reader :scale, :input_data, :graph_height_pdf, :y_labels
|
|
3
|
+
def initialize(scale, input_data, graph_height_pdf, y_labels)
|
|
4
|
+
@scale = scale
|
|
5
|
+
@input_data = input_data
|
|
6
|
+
@graph_height_pdf = graph_height_pdf
|
|
7
|
+
@y_labels = y_labels
|
|
8
|
+
end
|
|
9
|
+
|
|
10
|
+
def collect
|
|
11
|
+
if scale == :linear
|
|
12
|
+
LinearYPdfDataCollector.new(input_data, graph_height_pdf, y_labels).collect
|
|
13
|
+
elsif scale == :log
|
|
14
|
+
LogYPdfDataCollector.new(input_data, graph_height_pdf, y_labels).collect
|
|
15
|
+
else
|
|
16
|
+
raise("Scale must be :linear or :log")
|
|
17
|
+
end
|
|
18
|
+
end
|
|
19
|
+
end
|
|
@@ -0,0 +1,131 @@
|
|
|
1
|
+
require_relative "./../prawn_charts"
|
|
2
|
+
|
|
3
|
+
##################################
|
|
4
|
+
#Graph Data Collectors
|
|
5
|
+
##################################
|
|
6
|
+
input_data = [["Apr-11", 5_000_000],
|
|
7
|
+
["May-11", nil],
|
|
8
|
+
["Jun-11", nil],
|
|
9
|
+
["Jul-11", nil],
|
|
10
|
+
["Aug-11", 1_000_000],
|
|
11
|
+
["Sep-11", nil],
|
|
12
|
+
["Oct-11", nil],
|
|
13
|
+
["Dec-11", 10_000],
|
|
14
|
+
["Jan-12", nil],
|
|
15
|
+
["Feb-12", nil],
|
|
16
|
+
["Mar-12", 150_000],
|
|
17
|
+
["Apr-12", nil],
|
|
18
|
+
["May-12", nil],
|
|
19
|
+
["Jun-12", 7_500_000]]
|
|
20
|
+
scale = :log
|
|
21
|
+
graph_height_pdf = 200
|
|
22
|
+
graph_width_pdf = graph_height_pdf * 1.7
|
|
23
|
+
dot_radius = 4
|
|
24
|
+
|
|
25
|
+
x_label_width = 50
|
|
26
|
+
x_label_height = 35
|
|
27
|
+
x_label_text_box_options = { overflow: :shrink_to_fit, align: :center, rotate: 45 }
|
|
28
|
+
|
|
29
|
+
y_labels = [0, 10, 100, 1_000, 10_000, 100_000, 1_000_000, 10_000_000]
|
|
30
|
+
y_label_height = 30
|
|
31
|
+
y_label_width = 65
|
|
32
|
+
y_label_offset = 10
|
|
33
|
+
y_label_text_box_options = { align: :right, valign: :center }
|
|
34
|
+
|
|
35
|
+
graph_title_text = "Cool Prawn Graph"
|
|
36
|
+
graph_title_height = 40
|
|
37
|
+
|
|
38
|
+
y_title_width = 30
|
|
39
|
+
y_title_text = "HCV Viral Load"
|
|
40
|
+
|
|
41
|
+
x_title_height = 40
|
|
42
|
+
x_title_text = "Month"
|
|
43
|
+
|
|
44
|
+
pdf_data = PdfDataCollector.new(scale, input_data, graph_width_pdf, graph_height_pdf, y_labels).collect
|
|
45
|
+
x_label_data = XLabelsDataCollector.new(input_data, graph_width_pdf, x_label_height, x_label_width).collect
|
|
46
|
+
y_label_data = YLabelsDataCollector.new(y_labels, graph_height_pdf, y_label_width, y_label_height, y_label_offset).collect
|
|
47
|
+
horizontal_lines_data = HorizontalLinesDataCollector.new(graph_height_pdf, graph_width_pdf, y_labels).collect
|
|
48
|
+
|
|
49
|
+
##################################
|
|
50
|
+
#Container Data Collectors
|
|
51
|
+
##################################
|
|
52
|
+
|
|
53
|
+
container_inputs = {
|
|
54
|
+
container_left_padding: 0,
|
|
55
|
+
y_label_offset: y_label_offset,
|
|
56
|
+
y_label_width: y_label_width,
|
|
57
|
+
y_title_width: y_title_width,
|
|
58
|
+
container_right_padding: 20,
|
|
59
|
+
container_top_padding: 20,
|
|
60
|
+
graph_title_height: graph_title_height,
|
|
61
|
+
container_bottom_padding: 0,
|
|
62
|
+
x_label_height: x_label_height,
|
|
63
|
+
x_title_height: x_title_height,
|
|
64
|
+
graph_height: graph_height_pdf,
|
|
65
|
+
graph_width: graph_width_pdf
|
|
66
|
+
}
|
|
67
|
+
|
|
68
|
+
container_data_collector = ContainerDataCollector.new(container_inputs)
|
|
69
|
+
|
|
70
|
+
graph_title_position = container_data_collector.graph_title_top_left
|
|
71
|
+
graph_title_options = { align: :center, valign: :center}
|
|
72
|
+
graph_title_data = GraphTitleDataCollector.new(graph_title_text, graph_title_position, graph_title_height, graph_width_pdf).collect
|
|
73
|
+
|
|
74
|
+
y_title_position = container_data_collector.y_title_top_left
|
|
75
|
+
# specifying width is a temp hack solution because of a Prawn bug: https://github.com/prawnpdf/prawn/pull/505
|
|
76
|
+
y_title_options = { align: :center, valign: :center, rotate: 90, rotate_around: :center, width: 65 }
|
|
77
|
+
y_title_data = GraphTitleDataCollector.new(y_title_text, y_title_position, graph_height_pdf, y_title_width).collect
|
|
78
|
+
|
|
79
|
+
x_title_position = container_data_collector.x_title_top_left
|
|
80
|
+
x_title_options = { align: :center, valign: :center }
|
|
81
|
+
x_title_data = GraphTitleDataCollector.new(x_title_text, x_title_position, x_title_height, graph_width_pdf).collect
|
|
82
|
+
|
|
83
|
+
graph_top_left = container_data_collector.graph_top_left
|
|
84
|
+
|
|
85
|
+
##################################
|
|
86
|
+
#Colors
|
|
87
|
+
##################################
|
|
88
|
+
|
|
89
|
+
orange = "D95D2E"
|
|
90
|
+
green = "62C545"
|
|
91
|
+
light_blue = "EDF1F7"
|
|
92
|
+
white = "FFFFFF"
|
|
93
|
+
black = "000000"
|
|
94
|
+
|
|
95
|
+
##################################
|
|
96
|
+
#Create PDF
|
|
97
|
+
##################################
|
|
98
|
+
|
|
99
|
+
Prawn::Document.extensions << PrawnChartRenderer
|
|
100
|
+
|
|
101
|
+
pdf = Prawn::Document.new
|
|
102
|
+
pdf.bounding_box([0, pdf.cursor], :width => container_data_collector.width, :height => container_data_collector.height) do
|
|
103
|
+
pdf.stroke_bounds
|
|
104
|
+
pdf.fill_color = light_blue
|
|
105
|
+
pdf.fill_rectangle([0, pdf.cursor], container_data_collector.width, container_data_collector.height)
|
|
106
|
+
pdf.fill_color = black
|
|
107
|
+
|
|
108
|
+
pdf.draw_title(graph_title_data, graph_title_options)
|
|
109
|
+
pdf.draw_title(y_title_data, y_title_options)
|
|
110
|
+
pdf.draw_title(x_title_data, x_title_options)
|
|
111
|
+
|
|
112
|
+
pdf.bounding_box(container_data_collector.graph_top_left, :width => graph_width_pdf, :height => graph_height_pdf) do
|
|
113
|
+
pdf.stroke_bounds
|
|
114
|
+
pdf.fill_color = white
|
|
115
|
+
pdf.fill_rectangle([0, pdf.cursor], graph_width_pdf, graph_height_pdf)
|
|
116
|
+
|
|
117
|
+
pdf.stroke_color = green
|
|
118
|
+
pdf.draw_chart(pdf_data)
|
|
119
|
+
pdf.fill_color = orange
|
|
120
|
+
pdf.draw_dots(pdf_data, dot_radius)
|
|
121
|
+
|
|
122
|
+
pdf.fill_color = black
|
|
123
|
+
pdf.draw_labels(x_label_data, x_label_width, x_label_height, x_label_text_box_options)
|
|
124
|
+
|
|
125
|
+
pdf.draw_labels(y_label_data, y_label_width, y_label_height, y_label_text_box_options)
|
|
126
|
+
|
|
127
|
+
pdf.stroke_color = black
|
|
128
|
+
pdf.draw_horizontal_lines(horizontal_lines_data)
|
|
129
|
+
end
|
|
130
|
+
end
|
|
131
|
+
pdf.render_file(Dir.home + "/desktop/log_prawn_graph.pdf")
|
|
@@ -0,0 +1,57 @@
|
|
|
1
|
+
require_relative "./../prawn_charts"
|
|
2
|
+
|
|
3
|
+
##################################
|
|
4
|
+
#Graph Data Collectors
|
|
5
|
+
##################################
|
|
6
|
+
input_data = [["Apr-11", 10],
|
|
7
|
+
["May-11", 30],
|
|
8
|
+
["Jun-11", 50],
|
|
9
|
+
["Jul-11", 3],
|
|
10
|
+
["Aug-11", 40],
|
|
11
|
+
["Sep-11", nil],
|
|
12
|
+
["Oct-11", nil],
|
|
13
|
+
["Dec-11", 100],
|
|
14
|
+
["Jan-12", nil],
|
|
15
|
+
["Feb-12", nil],
|
|
16
|
+
["Mar-12", 5],
|
|
17
|
+
["Apr-12", nil],
|
|
18
|
+
["May-12", nil],
|
|
19
|
+
["Jun-12", 75]]
|
|
20
|
+
scale = :linear
|
|
21
|
+
graph_height_pdf = 200
|
|
22
|
+
graph_width_pdf = graph_height_pdf * 1.7
|
|
23
|
+
dot_radius = 4
|
|
24
|
+
|
|
25
|
+
x_label_width = 50
|
|
26
|
+
x_label_height = 35
|
|
27
|
+
x_label_text_box_options = { overflow: :shrink_to_fit, align: :center, rotate: 45 }
|
|
28
|
+
|
|
29
|
+
y_labels = [0, 25, 50, 75, 100, 125]
|
|
30
|
+
y_label_height = 30
|
|
31
|
+
y_label_width = 65
|
|
32
|
+
y_label_offset = 10
|
|
33
|
+
y_label_text_box_options = { align: :right, valign: :center }
|
|
34
|
+
|
|
35
|
+
pdf_data = PdfDataCollector.new(scale, input_data, graph_width_pdf, graph_height_pdf, y_labels).collect
|
|
36
|
+
x_label_data = XLabelsDataCollector.new(input_data, graph_width_pdf, x_label_height, x_label_width).collect
|
|
37
|
+
y_label_data = YLabelsDataCollector.new(y_labels, graph_height_pdf, y_label_width, y_label_height, y_label_offset).collect
|
|
38
|
+
horizontal_lines_data = HorizontalLinesDataCollector.new(graph_height_pdf, graph_width_pdf, y_labels).collect
|
|
39
|
+
|
|
40
|
+
##################################
|
|
41
|
+
#Create PDF
|
|
42
|
+
##################################
|
|
43
|
+
|
|
44
|
+
Prawn::Document.extensions << PrawnChartRenderer
|
|
45
|
+
|
|
46
|
+
pdf = Prawn::Document.new
|
|
47
|
+
|
|
48
|
+
pdf.bounding_box([50, pdf.cursor], :width => graph_width_pdf, :height => graph_height_pdf) do
|
|
49
|
+
pdf.stroke_bounds
|
|
50
|
+
pdf.draw_chart(pdf_data)
|
|
51
|
+
pdf.draw_dots(pdf_data, dot_radius)
|
|
52
|
+
pdf.draw_labels(x_label_data, x_label_width, x_label_height, x_label_text_box_options)
|
|
53
|
+
pdf.draw_labels(y_label_data, y_label_width, y_label_height, y_label_text_box_options)
|
|
54
|
+
pdf.draw_horizontal_lines(horizontal_lines_data)
|
|
55
|
+
end
|
|
56
|
+
|
|
57
|
+
pdf.render_file(Dir.home + "/desktop/simple_linear_prawn_graph.pdf")
|
|
@@ -0,0 +1,57 @@
|
|
|
1
|
+
require_relative "./../prawn_charts"
|
|
2
|
+
|
|
3
|
+
##################################
|
|
4
|
+
#Graph Data Collectors
|
|
5
|
+
##################################
|
|
6
|
+
input_data = [["Apr-11", 5_000_000],
|
|
7
|
+
["May-11", nil],
|
|
8
|
+
["Jun-11", nil],
|
|
9
|
+
["Jul-11", nil],
|
|
10
|
+
["Aug-11", 1_000_000],
|
|
11
|
+
["Sep-11", nil],
|
|
12
|
+
["Oct-11", nil],
|
|
13
|
+
["Dec-11", 10_000],
|
|
14
|
+
["Jan-12", nil],
|
|
15
|
+
["Feb-12", nil],
|
|
16
|
+
["Mar-12", 150_000],
|
|
17
|
+
["Apr-12", nil],
|
|
18
|
+
["May-12", nil],
|
|
19
|
+
["Jun-12", 7_500_000]]
|
|
20
|
+
scale = :log
|
|
21
|
+
graph_height_pdf = 200
|
|
22
|
+
graph_width_pdf = graph_height_pdf * 1.7
|
|
23
|
+
dot_radius = 4
|
|
24
|
+
|
|
25
|
+
x_label_width = 50
|
|
26
|
+
x_label_height = 35
|
|
27
|
+
x_label_text_box_options = { overflow: :shrink_to_fit, align: :center, rotate: 45 }
|
|
28
|
+
|
|
29
|
+
y_labels = [0, 10, 100, 1_000, 10_000, 100_000, 1_000_000, 10_000_000]
|
|
30
|
+
y_label_height = 30
|
|
31
|
+
y_label_width = 65
|
|
32
|
+
y_label_offset = 10
|
|
33
|
+
y_label_text_box_options = { align: :right, valign: :center }
|
|
34
|
+
|
|
35
|
+
pdf_data = PdfDataCollector.new(scale, input_data, graph_width_pdf, graph_height_pdf, y_labels).collect
|
|
36
|
+
x_label_data = XLabelsDataCollector.new(input_data, graph_width_pdf, x_label_height, x_label_width).collect
|
|
37
|
+
y_label_data = YLabelsDataCollector.new(y_labels, graph_height_pdf, y_label_width, y_label_height, y_label_offset).collect
|
|
38
|
+
horizontal_lines_data = HorizontalLinesDataCollector.new(graph_height_pdf, graph_width_pdf, y_labels).collect
|
|
39
|
+
|
|
40
|
+
##################################
|
|
41
|
+
#Create PDF
|
|
42
|
+
##################################
|
|
43
|
+
|
|
44
|
+
Prawn::Document.extensions << PrawnChartRenderer
|
|
45
|
+
|
|
46
|
+
pdf = Prawn::Document.new
|
|
47
|
+
|
|
48
|
+
pdf.bounding_box([50, pdf.cursor], :width => graph_width_pdf, :height => graph_height_pdf) do
|
|
49
|
+
pdf.stroke_bounds
|
|
50
|
+
pdf.draw_chart(pdf_data)
|
|
51
|
+
pdf.draw_dots(pdf_data, dot_radius)
|
|
52
|
+
pdf.draw_labels(x_label_data, x_label_width, x_label_height, x_label_text_box_options)
|
|
53
|
+
pdf.draw_labels(y_label_data, y_label_width, y_label_height, y_label_text_box_options)
|
|
54
|
+
pdf.draw_horizontal_lines(horizontal_lines_data)
|
|
55
|
+
end
|
|
56
|
+
|
|
57
|
+
pdf.render_file(Dir.home + "/desktop/simple_log_prawn_graph.pdf")
|
data/lib/prawn_charts.rb
ADDED
|
@@ -0,0 +1,29 @@
|
|
|
1
|
+
module PrawnChartRenderer
|
|
2
|
+
def draw_chart(pdf_data)
|
|
3
|
+
pdf_data.each_index do |i|
|
|
4
|
+
stroke_line(pdf_data[i], pdf_data[i + 1]) unless pdf_data[i + 1].nil?
|
|
5
|
+
end
|
|
6
|
+
end
|
|
7
|
+
|
|
8
|
+
def draw_dots(pdf_data, dot_radius)
|
|
9
|
+
pdf_data.each do |point|
|
|
10
|
+
fill_circle(point, dot_radius)
|
|
11
|
+
end
|
|
12
|
+
end
|
|
13
|
+
|
|
14
|
+
def draw_horizontal_lines(horizontal_lines_data)
|
|
15
|
+
horizontal_lines_data.each do |start_x, end_x, y|
|
|
16
|
+
stroke_horizontal_line start_x, end_x, at: y
|
|
17
|
+
end
|
|
18
|
+
end
|
|
19
|
+
|
|
20
|
+
def draw_labels(label_data, width, height, options = {})
|
|
21
|
+
label_data.each do |label, pdf_point|
|
|
22
|
+
text_box(label, { at: pdf_point, width: width, height: height }.merge(options))
|
|
23
|
+
end
|
|
24
|
+
end
|
|
25
|
+
|
|
26
|
+
def draw_title(inputs, options = {})
|
|
27
|
+
text_box(inputs[:title], { at: inputs[:at], width: inputs[:width], height: inputs[:height] }.merge(options))
|
|
28
|
+
end
|
|
29
|
+
end
|
|
@@ -0,0 +1,22 @@
|
|
|
1
|
+
# -*- encoding: utf-8 -*-
|
|
2
|
+
lib = File.expand_path('../lib', __FILE__)
|
|
3
|
+
$LOAD_PATH.unshift(lib) unless $LOAD_PATH.include?(lib)
|
|
4
|
+
require 'prawn_charts/version'
|
|
5
|
+
|
|
6
|
+
Gem::Specification.new do |gem|
|
|
7
|
+
gem.name = "prawn_charts"
|
|
8
|
+
gem.version = PrawnCharts::VERSION
|
|
9
|
+
gem.authors = ["MrPowers"]
|
|
10
|
+
gem.email = ["matthewkevinpowers@gmail.com"]
|
|
11
|
+
gem.description = %q{Library to create line graphs in Prawn}
|
|
12
|
+
gem.summary = %q{Library to create line graphs in Prawn}
|
|
13
|
+
gem.homepage = ""
|
|
14
|
+
|
|
15
|
+
gem.add_dependency "prawn"
|
|
16
|
+
gem.add_development_dependency "rspec"
|
|
17
|
+
|
|
18
|
+
gem.files = `git ls-files`.split($/)
|
|
19
|
+
gem.executables = gem.files.grep(%r{^bin/}).map{ |f| File.basename(f) }
|
|
20
|
+
gem.test_files = gem.files.grep(%r{^(test|spec|features)/})
|
|
21
|
+
gem.require_paths = ["lib"]
|
|
22
|
+
end
|
|
@@ -0,0 +1,57 @@
|
|
|
1
|
+
require "spec_helper"
|
|
2
|
+
|
|
3
|
+
describe ContainerDataCollector do
|
|
4
|
+
before do
|
|
5
|
+
container_inputs = {
|
|
6
|
+
container_left_padding: 7,
|
|
7
|
+
y_label_offset: 50,
|
|
8
|
+
y_label_width: 25,
|
|
9
|
+
y_title_width: 30,
|
|
10
|
+
container_right_padding: 20,
|
|
11
|
+
container_top_padding: 9,
|
|
12
|
+
graph_title_height: 25,
|
|
13
|
+
container_bottom_padding: 40,
|
|
14
|
+
x_label_height: 22,
|
|
15
|
+
x_title_height: 43,
|
|
16
|
+
graph_height: 400,
|
|
17
|
+
graph_width: 500
|
|
18
|
+
}
|
|
19
|
+
@container_data_collector = ContainerDataCollector.new(container_inputs)
|
|
20
|
+
end
|
|
21
|
+
|
|
22
|
+
context "#height" do
|
|
23
|
+
it "returns the pdf_height of the graph container" do
|
|
24
|
+
expect(@container_data_collector.height).to eq(539)
|
|
25
|
+
end
|
|
26
|
+
end
|
|
27
|
+
|
|
28
|
+
context "#width" do
|
|
29
|
+
it "returns the pdf_width of the graph container" do
|
|
30
|
+
expect(@container_data_collector.width).to eq(632)
|
|
31
|
+
end
|
|
32
|
+
end
|
|
33
|
+
|
|
34
|
+
context "#graph_top_left_corner" do
|
|
35
|
+
it "returns the point for the top-left corner of the graph" do
|
|
36
|
+
expect(@container_data_collector.graph_top_left).to eq([112, 505])
|
|
37
|
+
end
|
|
38
|
+
end
|
|
39
|
+
|
|
40
|
+
context "#graph_title_top_left" do
|
|
41
|
+
it "returns x, y coordinate for placement of graph title" do
|
|
42
|
+
expect(@container_data_collector.graph_title_top_left).to eq([112, 530])
|
|
43
|
+
end
|
|
44
|
+
end
|
|
45
|
+
|
|
46
|
+
context "#y_title_top_left" do
|
|
47
|
+
it "returns x, y coordinate for placement of y title" do
|
|
48
|
+
expect(@container_data_collector.y_title_top_left).to eq([7, 505])
|
|
49
|
+
end
|
|
50
|
+
end
|
|
51
|
+
|
|
52
|
+
context "#x_title_top_left" do
|
|
53
|
+
it "returns x, y coordinate for placement of x title" do
|
|
54
|
+
expect(@container_data_collector.x_title_top_left).to eq([112, 83])
|
|
55
|
+
end
|
|
56
|
+
end
|
|
57
|
+
end
|
|
@@ -0,0 +1,17 @@
|
|
|
1
|
+
require "spec_helper"
|
|
2
|
+
|
|
3
|
+
describe HorizontalLinesDataCollector do
|
|
4
|
+
before do
|
|
5
|
+
graph_height_pdf = 60
|
|
6
|
+
graph_width_pdf = 80
|
|
7
|
+
y_labels = [0, 10, 100, 1_000, 10_000, 100_000, 1_000_000]
|
|
8
|
+
@horizontal_lines_data_collector = HorizontalLinesDataCollector.new(graph_height_pdf, graph_width_pdf, y_labels)
|
|
9
|
+
end
|
|
10
|
+
|
|
11
|
+
context "#collect" do
|
|
12
|
+
it "returns an array with the start, end, and y position of the horizontal lines" do
|
|
13
|
+
expected = [[0, 80, 0.0], [0, 80, 10.0], [0, 80, 20.0], [0, 80, 30.0], [0, 80, 40.0], [0, 80, 50.0], [0, 80, 60.0]]
|
|
14
|
+
expect(@horizontal_lines_data_collector.collect).to eq(expected)
|
|
15
|
+
end
|
|
16
|
+
end
|
|
17
|
+
end
|
|
@@ -0,0 +1,17 @@
|
|
|
1
|
+
require 'spec_helper'
|
|
2
|
+
|
|
3
|
+
describe LinearYPdfDataCollector do
|
|
4
|
+
before do
|
|
5
|
+
input_data = [["Jan 11", 5], ["Feb 11", 2], ["Mar 11", 12]]
|
|
6
|
+
graph_height_pdf = 160
|
|
7
|
+
y_labels = [0, 4, 8, 12, 16]
|
|
8
|
+
@linear_y_pdf_data_collector = LinearYPdfDataCollector.new(input_data, graph_height_pdf, y_labels)
|
|
9
|
+
end
|
|
10
|
+
|
|
11
|
+
context "#collect" do
|
|
12
|
+
it "returns an array of y values in pdf points" do
|
|
13
|
+
expected = [50, 20, 120]
|
|
14
|
+
expect(@linear_y_pdf_data_collector.collect).to eq(expected)
|
|
15
|
+
end
|
|
16
|
+
end
|
|
17
|
+
end
|
|
@@ -0,0 +1,24 @@
|
|
|
1
|
+
require "spec_helper"
|
|
2
|
+
|
|
3
|
+
describe LogYPdfDataCollector do
|
|
4
|
+
before do
|
|
5
|
+
@graph_height_pdf = 60
|
|
6
|
+
@y_labels = [0, 10, 100, 1_000, 10_000, 100_000, 1_000_000]
|
|
7
|
+
end
|
|
8
|
+
|
|
9
|
+
context "#collect" do
|
|
10
|
+
it "returns an array of [x_pdf, y_pdf] for all data points" do
|
|
11
|
+
input_data = [["Jan 11", 5], ["Feb 11", 900], ["Mar 11", 800_000]]
|
|
12
|
+
log_y_pdf_data_collector = LogYPdfDataCollector.new(input_data, @graph_height_pdf, @y_labels)
|
|
13
|
+
expected = [10 * Math.log10(5), 10 * Math.log10(900), 10 * Math.log10(800_000)]
|
|
14
|
+
expect(log_y_pdf_data_collector.collect).to eq(expected)
|
|
15
|
+
end
|
|
16
|
+
|
|
17
|
+
it "it returns nil when a value is nil" do
|
|
18
|
+
input_data = [["Jan 11", 5], ["Feb 11", nil], ["Mar 11", 800_000]]
|
|
19
|
+
log_y_pdf_data_collector = LogYPdfDataCollector.new(input_data, @graph_height_pdf, @y_labels)
|
|
20
|
+
expected = [10 * Math.log10(5), nil, 10 * Math.log10(800_000)]
|
|
21
|
+
expect(log_y_pdf_data_collector.collect).to eq(expected)
|
|
22
|
+
end
|
|
23
|
+
end
|
|
24
|
+
end
|
|
@@ -0,0 +1,47 @@
|
|
|
1
|
+
require "spec_helper"
|
|
2
|
+
|
|
3
|
+
describe PdfDataCollector do
|
|
4
|
+
context "linear" do
|
|
5
|
+
before do
|
|
6
|
+
scale = :linear
|
|
7
|
+
input_data = [["Jan 11", 5], ["Feb 11", 2], ["Mar 11", 12]]
|
|
8
|
+
graph_width_pdf = 100
|
|
9
|
+
graph_height_pdf = 120
|
|
10
|
+
y_labels = [0, 3, 6, 9, 12]
|
|
11
|
+
@linear_pdf_data_collector = PdfDataCollector.new(scale, input_data, graph_width_pdf, graph_height_pdf, y_labels)
|
|
12
|
+
end
|
|
13
|
+
|
|
14
|
+
it "returns an array of pdf points where line should be plotted" do
|
|
15
|
+
expected = [[0, 50], [50, 20], [100, 120]]
|
|
16
|
+
expect(@linear_pdf_data_collector.collect).to eq(expected)
|
|
17
|
+
end
|
|
18
|
+
end
|
|
19
|
+
|
|
20
|
+
context "log" do
|
|
21
|
+
before do
|
|
22
|
+
scale = :log
|
|
23
|
+
input_data = [["Jan 11", 5], ["Feb 11", 900], ["Mar 11", 800_000]]
|
|
24
|
+
graph_width_pdf = 200
|
|
25
|
+
graph_height_pdf = 120
|
|
26
|
+
y_labels = [0, 10, 100, 1_000, 10_000, 100_000, 1_000_000]
|
|
27
|
+
@log_pdf_data_collector = PdfDataCollector.new(scale, input_data, graph_width_pdf, graph_height_pdf, y_labels)
|
|
28
|
+
end
|
|
29
|
+
|
|
30
|
+
it "returns an array of pdf points where line should be plotted" do
|
|
31
|
+
expected = [[0.0, Math.log10(5) * 20], [100.0, Math.log10(900) * 20], [200.0, Math.log10(800_000) * 20]]
|
|
32
|
+
expect(@log_pdf_data_collector.collect).to eq(expected)
|
|
33
|
+
end
|
|
34
|
+
end
|
|
35
|
+
|
|
36
|
+
context "invalid scale input" do
|
|
37
|
+
it "raises an error unless scale is :linear or :log" do
|
|
38
|
+
scale = :phattie
|
|
39
|
+
input_data = [["Jan 11", 5], ["Feb 11", 900], ["Mar 11", 800_000]]
|
|
40
|
+
graph_width_pdf = 200
|
|
41
|
+
graph_height_pdf = 120
|
|
42
|
+
y_labels = [0, 10, 100, 1_000, 10_000, 100_000, 1_000_000]
|
|
43
|
+
log_pdf_data_collector = PdfDataCollector.new(scale, input_data, graph_width_pdf, graph_height_pdf, y_labels)
|
|
44
|
+
expect{log_pdf_data_collector.collect}.to raise_error(RuntimeError)
|
|
45
|
+
end
|
|
46
|
+
end
|
|
47
|
+
end
|
|
@@ -0,0 +1,18 @@
|
|
|
1
|
+
require "spec_helper"
|
|
2
|
+
|
|
3
|
+
describe XLabelsDataCollector do
|
|
4
|
+
before do
|
|
5
|
+
input_data = [["Jan 11", 5], ["Feb 11", 2], ["Mar 11", 12]]
|
|
6
|
+
graph_width_pdf = 160
|
|
7
|
+
vertical_offset = 20
|
|
8
|
+
label_width = 50
|
|
9
|
+
@x_labels_data_collector = XLabelsDataCollector.new(input_data, graph_width_pdf, vertical_offset, label_width)
|
|
10
|
+
end
|
|
11
|
+
|
|
12
|
+
context "#collect" do
|
|
13
|
+
it "returns array of labels and [x, y] coordinate where the label should be plotted" do
|
|
14
|
+
expected = [["Jan 11", [-25.0, -20]], ["Feb 11", [55.0, -20]], ["Mar 11", [135.0, -20]]]
|
|
15
|
+
expect(@x_labels_data_collector.collect).to eq(expected)
|
|
16
|
+
end
|
|
17
|
+
end
|
|
18
|
+
end
|
|
@@ -0,0 +1,21 @@
|
|
|
1
|
+
require 'spec_helper'
|
|
2
|
+
|
|
3
|
+
describe XPdfDataCollector do
|
|
4
|
+
before do
|
|
5
|
+
input_data = [["Jan 11", 5], ["Feb 11", 2], ["Mar 11", 12]]
|
|
6
|
+
graph_width_pdf = 160
|
|
7
|
+
@x_pdf_data_collector = XPdfDataCollector.new(input_data, graph_width_pdf)
|
|
8
|
+
end
|
|
9
|
+
|
|
10
|
+
context "#pdf_points_per_unit" do
|
|
11
|
+
it "returns number of pdf points per unit on x axis" do
|
|
12
|
+
expect(@x_pdf_data_collector.pdf_points_per_unit).to eq(80.0)
|
|
13
|
+
end
|
|
14
|
+
end
|
|
15
|
+
|
|
16
|
+
context "#collect" do
|
|
17
|
+
it "returns an array of x pdf points" do
|
|
18
|
+
expect(@x_pdf_data_collector.collect).to eq([0, 80, 160])
|
|
19
|
+
end
|
|
20
|
+
end
|
|
21
|
+
end
|
|
@@ -0,0 +1,19 @@
|
|
|
1
|
+
require "spec_helper"
|
|
2
|
+
|
|
3
|
+
describe YLabelsDataCollector do
|
|
4
|
+
before do
|
|
5
|
+
y_labels = [0, 10, 100, 1_000, 10_000, 100_000, 1_000_000, 10_000_000]
|
|
6
|
+
graph_height_pdf = 560
|
|
7
|
+
label_width = 15
|
|
8
|
+
label_height = 20
|
|
9
|
+
y_label_offset = 30
|
|
10
|
+
@y_data_collector = YLabelsDataCollector.new(y_labels, graph_height_pdf, label_width, label_height, y_label_offset)
|
|
11
|
+
end
|
|
12
|
+
|
|
13
|
+
context "#collect" do
|
|
14
|
+
it "returns an array of y_labels and points where they should be plotted" do
|
|
15
|
+
expected = [["0", [-45, 10.0]], ["10", [-45, 90.0]], ["100", [-45, 170.0]], ["1,000", [-45, 250.0]], ["10,000", [-45, 330.0]], ["100,000", [-45, 410.0]], ["1,000,000", [-45, 490.0]], ["10,000,000", [-45, 570.0]]]
|
|
16
|
+
expect(@y_data_collector.collect).to eq(expected)
|
|
17
|
+
end
|
|
18
|
+
end
|
|
19
|
+
end
|
data/spec/spec_helper.rb
ADDED
|
@@ -0,0 +1 @@
|
|
|
1
|
+
require_relative '../lib/prawn_charts.rb'
|
metadata
ADDED
|
@@ -0,0 +1,119 @@
|
|
|
1
|
+
--- !ruby/object:Gem::Specification
|
|
2
|
+
name: prawn_charts
|
|
3
|
+
version: !ruby/object:Gem::Version
|
|
4
|
+
version: 0.0.1
|
|
5
|
+
prerelease:
|
|
6
|
+
platform: ruby
|
|
7
|
+
authors:
|
|
8
|
+
- MrPowers
|
|
9
|
+
autorequire:
|
|
10
|
+
bindir: bin
|
|
11
|
+
cert_chain: []
|
|
12
|
+
date: 2013-08-07 00:00:00.000000000 Z
|
|
13
|
+
dependencies:
|
|
14
|
+
- !ruby/object:Gem::Dependency
|
|
15
|
+
name: prawn
|
|
16
|
+
requirement: !ruby/object:Gem::Requirement
|
|
17
|
+
none: false
|
|
18
|
+
requirements:
|
|
19
|
+
- - ! '>='
|
|
20
|
+
- !ruby/object:Gem::Version
|
|
21
|
+
version: '0'
|
|
22
|
+
type: :runtime
|
|
23
|
+
prerelease: false
|
|
24
|
+
version_requirements: !ruby/object:Gem::Requirement
|
|
25
|
+
none: false
|
|
26
|
+
requirements:
|
|
27
|
+
- - ! '>='
|
|
28
|
+
- !ruby/object:Gem::Version
|
|
29
|
+
version: '0'
|
|
30
|
+
- !ruby/object:Gem::Dependency
|
|
31
|
+
name: rspec
|
|
32
|
+
requirement: !ruby/object:Gem::Requirement
|
|
33
|
+
none: false
|
|
34
|
+
requirements:
|
|
35
|
+
- - ! '>='
|
|
36
|
+
- !ruby/object:Gem::Version
|
|
37
|
+
version: '0'
|
|
38
|
+
type: :development
|
|
39
|
+
prerelease: false
|
|
40
|
+
version_requirements: !ruby/object:Gem::Requirement
|
|
41
|
+
none: false
|
|
42
|
+
requirements:
|
|
43
|
+
- - ! '>='
|
|
44
|
+
- !ruby/object:Gem::Version
|
|
45
|
+
version: '0'
|
|
46
|
+
description: Library to create line graphs in Prawn
|
|
47
|
+
email:
|
|
48
|
+
- matthewkevinpowers@gmail.com
|
|
49
|
+
executables: []
|
|
50
|
+
extensions: []
|
|
51
|
+
extra_rdoc_files: []
|
|
52
|
+
files:
|
|
53
|
+
- .gitignore
|
|
54
|
+
- Gemfile
|
|
55
|
+
- LICENSE.txt
|
|
56
|
+
- README.md
|
|
57
|
+
- Rakefile
|
|
58
|
+
- images/prawn_charts_log_example.png
|
|
59
|
+
- images/simple_linear_example.png
|
|
60
|
+
- lib/data_collectors/container/container_data_collector.rb
|
|
61
|
+
- lib/data_collectors/container/graph_title_data_collector.rb
|
|
62
|
+
- lib/data_collectors/graph/horizontal_lines_data_collector.rb
|
|
63
|
+
- lib/data_collectors/graph/linear_y_pdf_data_collector.rb
|
|
64
|
+
- lib/data_collectors/graph/log_y_pdf_data_collector.rb
|
|
65
|
+
- lib/data_collectors/graph/pdf_data_collector.rb
|
|
66
|
+
- lib/data_collectors/graph/x_labels_data_collector.rb
|
|
67
|
+
- lib/data_collectors/graph/x_pdf_data_collector.rb
|
|
68
|
+
- lib/data_collectors/graph/y_labels_data_collector.rb
|
|
69
|
+
- lib/data_collectors/graph/y_pdf_data_collector.rb
|
|
70
|
+
- lib/examples/log_example.rb
|
|
71
|
+
- lib/examples/simple_linear_example.rb
|
|
72
|
+
- lib/examples/simple_log_example.rb
|
|
73
|
+
- lib/prawn_charts.rb
|
|
74
|
+
- lib/prawn_charts/version.rb
|
|
75
|
+
- lib/renderers/prawn_chart_renderer.rb
|
|
76
|
+
- prawn_charts.gemspec
|
|
77
|
+
- spec/data_collectors/container/container_data_collector_spec.rb
|
|
78
|
+
- spec/data_collectors/graph/horizontal_lines_data_collector_spec.rb
|
|
79
|
+
- spec/data_collectors/graph/linear_y_pdf_data_collector_spec.rb
|
|
80
|
+
- spec/data_collectors/graph/log_y_pdf_data_collector_spec.rb
|
|
81
|
+
- spec/data_collectors/graph/pdf_data_collector_spec.rb
|
|
82
|
+
- spec/data_collectors/graph/x_labels_data_collector_spec.rb
|
|
83
|
+
- spec/data_collectors/graph/x_pdf_data_collector_spec.rb
|
|
84
|
+
- spec/data_collectors/graph/y_labels_data_collector_spec.rb
|
|
85
|
+
- spec/spec_helper.rb
|
|
86
|
+
homepage: ''
|
|
87
|
+
licenses: []
|
|
88
|
+
post_install_message:
|
|
89
|
+
rdoc_options: []
|
|
90
|
+
require_paths:
|
|
91
|
+
- lib
|
|
92
|
+
required_ruby_version: !ruby/object:Gem::Requirement
|
|
93
|
+
none: false
|
|
94
|
+
requirements:
|
|
95
|
+
- - ! '>='
|
|
96
|
+
- !ruby/object:Gem::Version
|
|
97
|
+
version: '0'
|
|
98
|
+
required_rubygems_version: !ruby/object:Gem::Requirement
|
|
99
|
+
none: false
|
|
100
|
+
requirements:
|
|
101
|
+
- - ! '>='
|
|
102
|
+
- !ruby/object:Gem::Version
|
|
103
|
+
version: '0'
|
|
104
|
+
requirements: []
|
|
105
|
+
rubyforge_project:
|
|
106
|
+
rubygems_version: 1.8.23
|
|
107
|
+
signing_key:
|
|
108
|
+
specification_version: 3
|
|
109
|
+
summary: Library to create line graphs in Prawn
|
|
110
|
+
test_files:
|
|
111
|
+
- spec/data_collectors/container/container_data_collector_spec.rb
|
|
112
|
+
- spec/data_collectors/graph/horizontal_lines_data_collector_spec.rb
|
|
113
|
+
- spec/data_collectors/graph/linear_y_pdf_data_collector_spec.rb
|
|
114
|
+
- spec/data_collectors/graph/log_y_pdf_data_collector_spec.rb
|
|
115
|
+
- spec/data_collectors/graph/pdf_data_collector_spec.rb
|
|
116
|
+
- spec/data_collectors/graph/x_labels_data_collector_spec.rb
|
|
117
|
+
- spec/data_collectors/graph/x_pdf_data_collector_spec.rb
|
|
118
|
+
- spec/data_collectors/graph/y_labels_data_collector_spec.rb
|
|
119
|
+
- spec/spec_helper.rb
|