models_stats 0.0.1
This diff represents the content of publicly available package versions that have been released to one of the supported registries. The information contained in this diff is provided for informational purposes only and reflects changes between package versions as they appear in their respective public registries.
- checksums.yaml +7 -0
- data/.gitignore +13 -0
- data/Gemfile +4 -0
- data/LICENSE.txt +22 -0
- data/README.md +157 -0
- data/Rakefile +3 -0
- data/app/assets/javascripts/models_stats/graphs/metrics_graph.js.coffee +63 -0
- data/app/assets/javascripts/models_stats/graphs/nvd3_graph.js.coffee +88 -0
- data/app/assets/javascripts/models_stats/metrics_graphics.js +3 -0
- data/app/assets/javascripts/models_stats/nvd3.js +3 -0
- data/app/assets/stylesheets/models_stats/metrics_graphics.css +17 -0
- data/app/assets/stylesheets/models_stats/nvd3.css +4 -0
- data/app/helpers/models_stats/graph_helper.rb +27 -0
- data/app/views/models_stats/_dashboard.html.erb +11 -0
- data/app/views/models_stats/_model_statistics_graph.html.erb +39 -0
- data/doc/img/mg_example.png +0 -0
- data/doc/img/nvd3_example.png +0 -0
- data/doc/img/nvd3_users_example.png +0 -0
- data/lib/models_stats.rb +29 -0
- data/lib/models_stats/statistics.rb +91 -0
- data/lib/models_stats/statistics_collector.rb +80 -0
- data/lib/models_stats/version.rb +3 -0
- data/lib/tasks/models_stats.rake +16 -0
- data/models_stats.gemspec +26 -0
- data/vendor/assets/javascripts/bootstrap.min.js +6 -0
- data/vendor/assets/javascripts/d3.min.js +5 -0
- data/vendor/assets/javascripts/jquery.min.js +4 -0
- data/vendor/assets/javascripts/metricsgraphics.min.js +307 -0
- data/vendor/assets/javascripts/nv.d3.min.js +6 -0
- data/vendor/assets/stylesheets/bootstrap.min.css +5 -0
- data/vendor/assets/stylesheets/metricsgraphics.css +377 -0
- data/vendor/assets/stylesheets/nv.d3.min.css +1 -0
- metadata +147 -0
checksums.yaml
ADDED
|
@@ -0,0 +1,7 @@
|
|
|
1
|
+
---
|
|
2
|
+
SHA1:
|
|
3
|
+
metadata.gz: 43a556631c74099ee79afa59fd528b167bf6adc4
|
|
4
|
+
data.tar.gz: 3a36eb3f4851b85ef6f9b406fb025ffd6aeefcf5
|
|
5
|
+
SHA512:
|
|
6
|
+
metadata.gz: 81676a6eb2455a149ed00992732f29c1b8a1703950f880b95a007bb31af98296986a1558fbc7a5f8bd8bab375c79af302c065c7673bc9a0aae749042b55ba499
|
|
7
|
+
data.tar.gz: 7a9bf584641949a6edf457fe3282689d9eb8202f3bb2283fc658ce4075e94f17d586fbd1e763c4df010c46b36468b652472c108deacf88bb9c335aa47f9691ce
|
data/.gitignore
ADDED
data/Gemfile
ADDED
data/LICENSE.txt
ADDED
|
@@ -0,0 +1,22 @@
|
|
|
1
|
+
Copyright (c) 2014 Andrey Morskov
|
|
2
|
+
|
|
3
|
+
MIT License
|
|
4
|
+
|
|
5
|
+
Permission is hereby granted, free of charge, to any person obtaining
|
|
6
|
+
a copy of this software and associated documentation files (the
|
|
7
|
+
"Software"), to deal in the Software without restriction, including
|
|
8
|
+
without limitation the rights to use, copy, modify, merge, publish,
|
|
9
|
+
distribute, sublicense, and/or sell copies of the Software, and to
|
|
10
|
+
permit persons to whom the Software is furnished to do so, subject to
|
|
11
|
+
the following conditions:
|
|
12
|
+
|
|
13
|
+
The above copyright notice and this permission notice shall be
|
|
14
|
+
included in all copies or substantial portions of the Software.
|
|
15
|
+
|
|
16
|
+
THE SOFTWARE IS PROVIDED "AS IS", WITHOUT WARRANTY OF ANY KIND,
|
|
17
|
+
EXPRESS OR IMPLIED, INCLUDING BUT NOT LIMITED TO THE WARRANTIES OF
|
|
18
|
+
MERCHANTABILITY, FITNESS FOR A PARTICULAR PURPOSE AND
|
|
19
|
+
NONINFRINGEMENT. IN NO EVENT SHALL THE AUTHORS OR COPYRIGHT HOLDERS BE
|
|
20
|
+
LIABLE FOR ANY CLAIM, DAMAGES OR OTHER LIABILITY, WHETHER IN AN ACTION
|
|
21
|
+
OF CONTRACT, TORT OR OTHERWISE, ARISING FROM, OUT OF OR IN CONNECTION
|
|
22
|
+
WITH THE SOFTWARE OR THE USE OR OTHER DEALINGS IN THE SOFTWARE.
|
data/README.md
ADDED
|
@@ -0,0 +1,157 @@
|
|
|
1
|
+
# ModelsStats
|
|
2
|
+
|
|
3
|
+
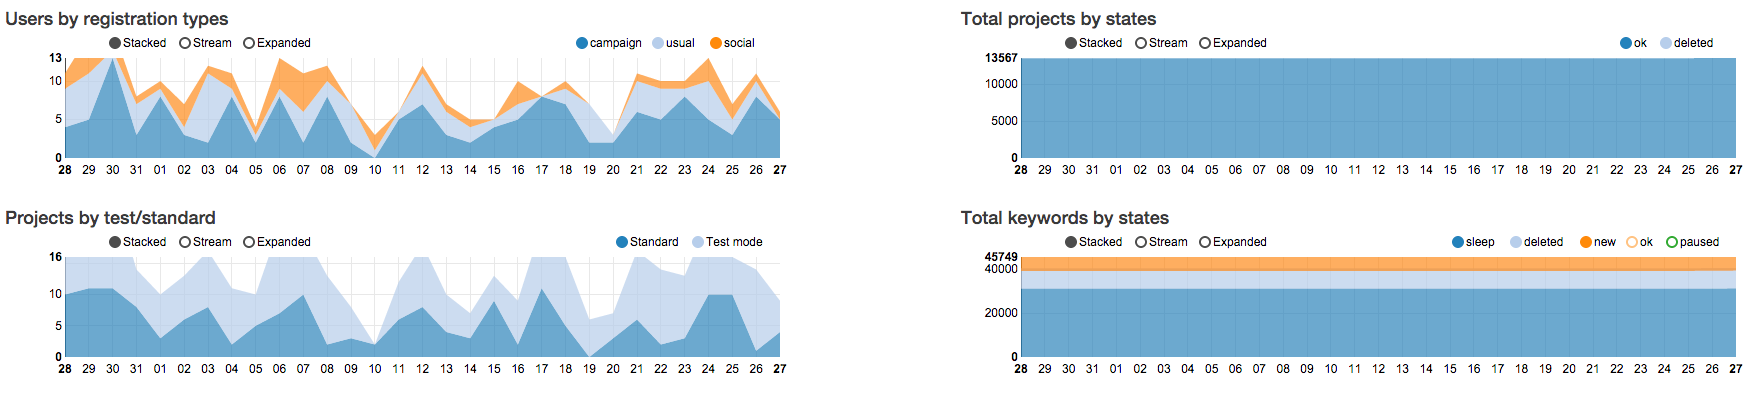
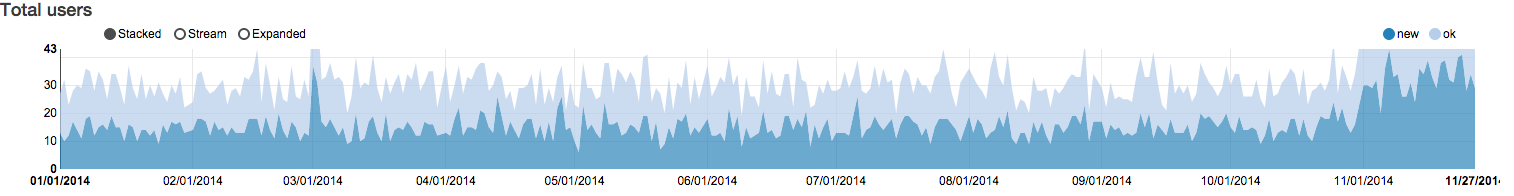
Graphics for your rails models. It may show count(or average, or sum, or another sql agregate function) of models for each day with grouping, conditions.
|
|
4
|
+
|
|
5
|
+
For graphics it uses for your choice [MetricsGraphics.js](https://github.com/mozilla/metrics-graphics) or/and [NVD3](http://nvd3.org/).
|
|
6
|
+
|
|
7
|
+
Dependencies: [Redis](http://redis.io/) for store statistics.
|
|
8
|
+
[D3](http://d3js.org/), [jQuery](http://jquery.com/), [Bootstrap](http://getbootstrap.com/) it's dependencies of MetricsGraphics.js.
|
|
9
|
+
|
|
10
|
+
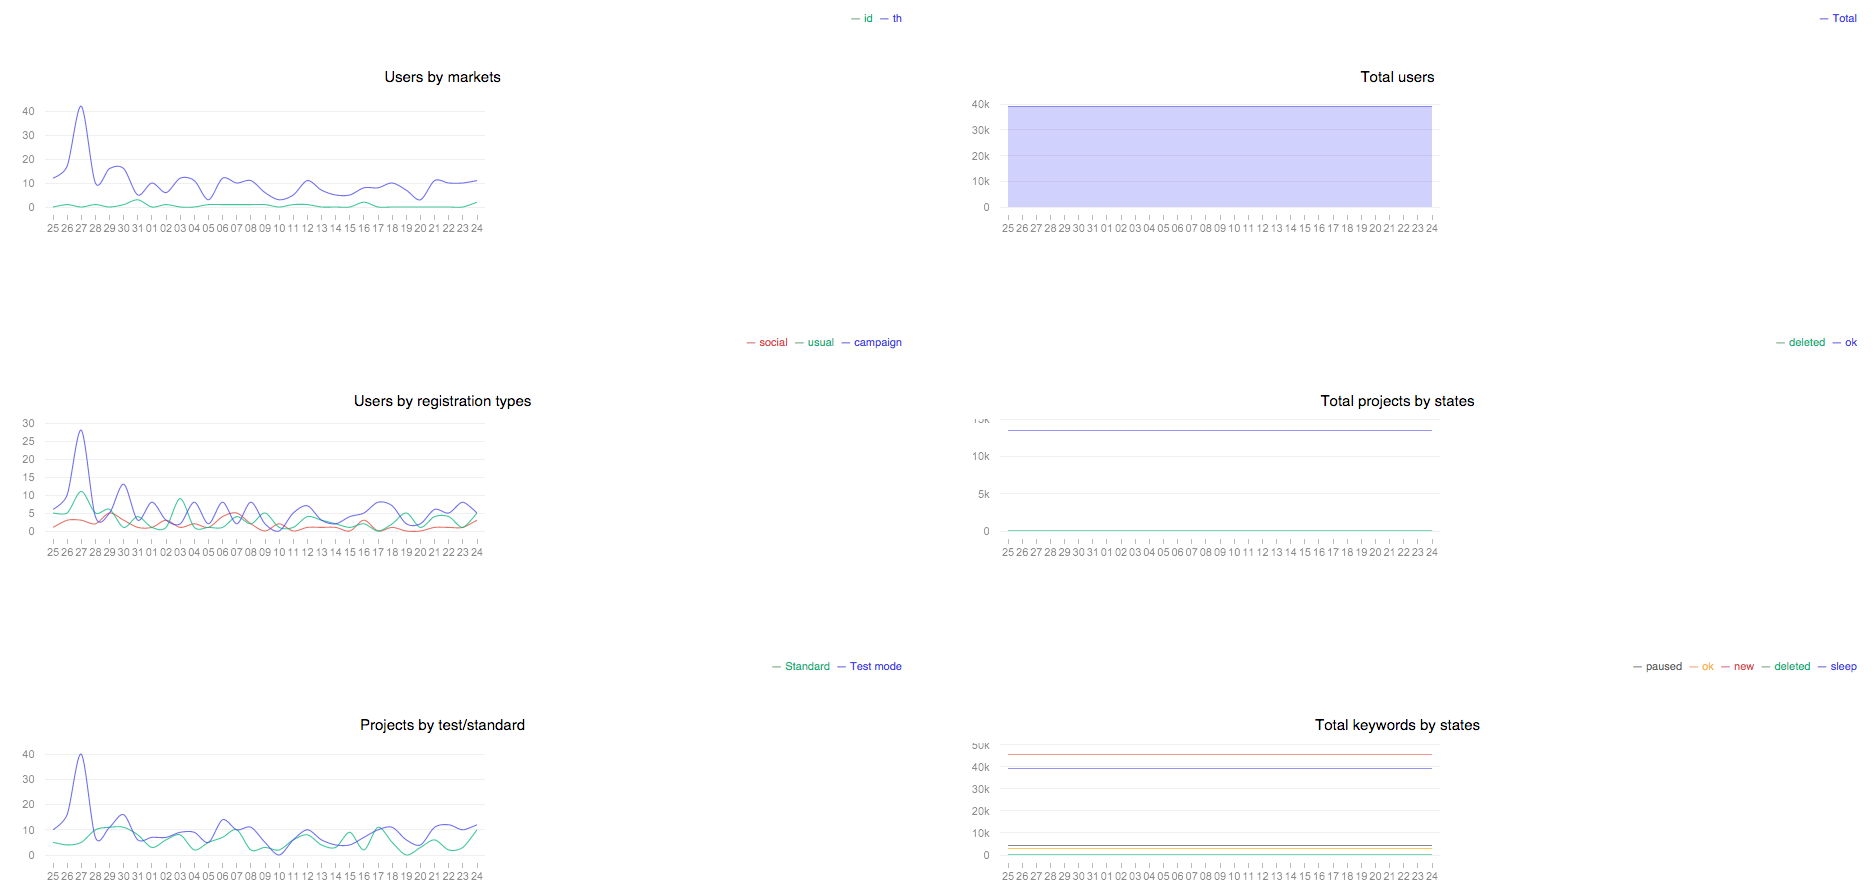
Preview:
|
|
11
|
+
|
|
12
|
+
NVD3:
|
|
13
|
+
|
|
14
|
+
|
|
15
|
+
|
|
16
|
+
|
|
17
|
+
|
|
18
|
+
MetricsGraphics.js
|
|
19
|
+
|
|
20
|
+
|
|
21
|
+
|
|
22
|
+
## Installation
|
|
23
|
+
|
|
24
|
+
Add this line to your application's Gemfile:
|
|
25
|
+
|
|
26
|
+
```ruby
|
|
27
|
+
gem 'models_stats', github: 'accessd/models_stats'
|
|
28
|
+
```
|
|
29
|
+
|
|
30
|
+
And then execute:
|
|
31
|
+
|
|
32
|
+
$ bundle
|
|
33
|
+
|
|
34
|
+
In your application.js manifest:
|
|
35
|
+
|
|
36
|
+
//= require models_stats/nvd3
|
|
37
|
+
|
|
38
|
+
or/and
|
|
39
|
+
|
|
40
|
+
//= require models_stats/metrics_graphics
|
|
41
|
+
|
|
42
|
+
if you want use MetricsGraphics.
|
|
43
|
+
|
|
44
|
+
In your application.css.scss manifest:
|
|
45
|
+
|
|
46
|
+
//= require models_stats/nvd3
|
|
47
|
+
|
|
48
|
+
or/and
|
|
49
|
+
|
|
50
|
+
//= require models_stats/metrics_graphics
|
|
51
|
+
|
|
52
|
+
if you want use MetricsGraphics.
|
|
53
|
+
|
|
54
|
+
Also if you use MetricsGraphics.js you must have [jQuery](http://jquery.com/) and [Bootstrap](http://getbootstrap.com/) js/css included.
|
|
55
|
+
|
|
56
|
+
|
|
57
|
+
## Usage
|
|
58
|
+
|
|
59
|
+
### Configuration
|
|
60
|
+
|
|
61
|
+
Add config file `config/models_stats.yml`, for example:
|
|
62
|
+
|
|
63
|
+
minimal configuration:
|
|
64
|
+
|
|
65
|
+
```yaml
|
|
66
|
+
---
|
|
67
|
+
- total_users:
|
|
68
|
+
description: "Total users"
|
|
69
|
+
model: User
|
|
70
|
+
```
|
|
71
|
+
|
|
72
|
+
it would be calculate total users for day.
|
|
73
|
+
|
|
74
|
+
Enhanced configuration:
|
|
75
|
+
|
|
76
|
+
```yaml
|
|
77
|
+
---
|
|
78
|
+
- total_links_by_error_types: # Statistics alias, must be uniq
|
|
79
|
+
description: "Total links by error types"
|
|
80
|
+
model: Link
|
|
81
|
+
datetime_attr: :created_at # Date or datetime attribute, allows to calculate the count of models per day
|
|
82
|
+
group_by: :error_type_id
|
|
83
|
+
conditions: "error_type_id != <%= Link::NO_ERROR %>"
|
|
84
|
+
group_by_values_map: <%= ModelsStats.convert_hash_to_yaml(Link::ERROR_NAMES) %> # for example maping integer field to text representation
|
|
85
|
+
graph_width: 430
|
|
86
|
+
graph_height: 140
|
|
87
|
+
graphic_lib: nvd3 # By default, or can be metrics_graphics
|
|
88
|
+
graphic_type: stacked # It's can be using with nvd3, by default line
|
|
89
|
+
date_tick: day # By default, or can be month or week
|
|
90
|
+
date_format: '%d/%m' # By default is %x, more information about formattting time available at https://github.com/mbostock/d3/wiki/Time-Formatting
|
|
91
|
+
- average_by_keyword_positions:
|
|
92
|
+
description: "Average by keyword positions"
|
|
93
|
+
select_statement: "AVG(google_position) AS count" # Right here you may specify select query, `count` alias for function required
|
|
94
|
+
model: KeywordPosition
|
|
95
|
+
```
|
|
96
|
+
|
|
97
|
+
If you want using specific redis for store statistics, set it in `config/initializers/models_stats.rb`, for example:
|
|
98
|
+
|
|
99
|
+
ModelsStats.redis_connection = Redis.new(host: '127.0.0.1', port: 6379, db: 5)
|
|
100
|
+
|
|
101
|
+
Default graphics library can be configured through:
|
|
102
|
+
|
|
103
|
+
ModelsStats.default_lib_for_graphics = :nvd3 # Or metrics_graphics
|
|
104
|
+
|
|
105
|
+
Default graphics type:
|
|
106
|
+
|
|
107
|
+
ModelsStats.default_graphics_type = :line # Or stacked
|
|
108
|
+
|
|
109
|
+
Default graph width:
|
|
110
|
+
|
|
111
|
+
ModelsStats.default_graphics_width = 500
|
|
112
|
+
|
|
113
|
+
Default graph height:
|
|
114
|
+
|
|
115
|
+
ModelsStats.default_graphics_height = 120
|
|
116
|
+
|
|
117
|
+
Default date tick:
|
|
118
|
+
|
|
119
|
+
ModelsStats.default_date_tick = :day # Or month, week
|
|
120
|
+
|
|
121
|
+
Default date format:
|
|
122
|
+
|
|
123
|
+
ModelsStats.default_date_format = '%d/%m'
|
|
124
|
+
|
|
125
|
+
For the full list of directives for formatting time, refer to [this list](https://github.com/mbostock/d3/wiki/Time-Formatting)
|
|
126
|
+
|
|
127
|
+
### Collecting statistics
|
|
128
|
+
|
|
129
|
+
Add to your crontab(may use [whenever](https://github.com/javan/whenever)) rake task `models_stats:collect_stat_for_yesterday`, run it at 00:00 or later and it will collect statistics for yesterday.
|
|
130
|
+
For collecting statistics for last month run rake task `models_stats:collect_stat_for_last_month`.
|
|
131
|
+
Also you may collect statistics for specific date and config, for example:
|
|
132
|
+
|
|
133
|
+
```ruby
|
|
134
|
+
date = 2.days.ago.to_date
|
|
135
|
+
statistics_alias = 'total_links_by_error_types' # statistic alias which you define in `config/models_stats.yml`
|
|
136
|
+
ModelsStats::StatisticsCollector.new.collect(statistics_alias, date) # By default date is yestarday
|
|
137
|
+
```
|
|
138
|
+
|
|
139
|
+
### Display graphics
|
|
140
|
+
|
|
141
|
+
In your views use helpers:
|
|
142
|
+
|
|
143
|
+
Render single graphic for total_links_by_error_types statistic alias(which you define in `config/models_stats.yml`) and last week
|
|
144
|
+
|
|
145
|
+
= render_models_stats_graph('total_links_by_error_types', 1.week) # By default period is 1.month
|
|
146
|
+
|
|
147
|
+
Render all defined graphics splited by two columns - first for new models count, second for total models count
|
|
148
|
+
|
|
149
|
+
= render_models_stats_dashboard
|
|
150
|
+
|
|
151
|
+
## Contributing
|
|
152
|
+
|
|
153
|
+
1. Fork it ( https://github.com/accessd/models_stats/fork )
|
|
154
|
+
2. Create your feature branch (`git checkout -b my-new-feature`)
|
|
155
|
+
3. Commit your changes (`git commit -am 'Add some feature'`)
|
|
156
|
+
4. Push to the branch (`git push origin my-new-feature`)
|
|
157
|
+
5. Create a new Pull Request
|
data/Rakefile
ADDED
|
@@ -0,0 +1,63 @@
|
|
|
1
|
+
class @MetricsGraph
|
|
2
|
+
constructor: (graph_title, keys, data, stat_alias, date_axis_tick, date_format, width, height) ->
|
|
3
|
+
@width = width
|
|
4
|
+
@height = height
|
|
5
|
+
@graphTitle = graph_title
|
|
6
|
+
@statAlias = stat_alias
|
|
7
|
+
@dateAxisTick = date_axis_tick
|
|
8
|
+
@dateFormat = date_format
|
|
9
|
+
@keys = keys
|
|
10
|
+
@data = @prepareData(data)
|
|
11
|
+
if data.length
|
|
12
|
+
@draw()
|
|
13
|
+
|
|
14
|
+
prepareData: (rawData) ->
|
|
15
|
+
resultData = []
|
|
16
|
+
|
|
17
|
+
rawData.forEach (dataForKey) =>
|
|
18
|
+
values = convert_dates(dataForKey, 'date')
|
|
19
|
+
resultData.push values
|
|
20
|
+
|
|
21
|
+
resultData
|
|
22
|
+
|
|
23
|
+
draw: ->
|
|
24
|
+
placeholder_name = "#{@statAlias}_statistics"
|
|
25
|
+
maximums = []
|
|
26
|
+
@data.forEach (data) =>
|
|
27
|
+
maximum = d3.max data, (d) -> d.date
|
|
28
|
+
maximums.push maximum
|
|
29
|
+
maxDate = d3.max maximums
|
|
30
|
+
|
|
31
|
+
minimums = []
|
|
32
|
+
@data.forEach (data) =>
|
|
33
|
+
minimum = d3.min data, (d) -> d.date
|
|
34
|
+
minimums.push minimum
|
|
35
|
+
minDate = d3.max minimums
|
|
36
|
+
daysCount = d3.time.day.range(minDate, maxDate, 1).length
|
|
37
|
+
switch @dateAxisTick
|
|
38
|
+
when 'month'
|
|
39
|
+
xax_count = d3.time.month.range(minDate, maxDate, 1).length
|
|
40
|
+
when 'week'
|
|
41
|
+
xax_count = d3.time.week.range(minDate, maxDate, 1).length
|
|
42
|
+
else
|
|
43
|
+
xax_count = d3.time.day.range(minDate, maxDate, 1).length
|
|
44
|
+
|
|
45
|
+
data_graphic
|
|
46
|
+
title: @graphTitle
|
|
47
|
+
area: true
|
|
48
|
+
legend: @keys
|
|
49
|
+
legend_target: ".#{placeholder_name}_legend"
|
|
50
|
+
data: @data
|
|
51
|
+
width: @width
|
|
52
|
+
height: @height
|
|
53
|
+
bottom: 0
|
|
54
|
+
top: 20
|
|
55
|
+
show_years: false
|
|
56
|
+
y_extended_ticks: true
|
|
57
|
+
xax_count: xax_count
|
|
58
|
+
xax_format: (d) =>
|
|
59
|
+
df = d3.time.format(@dateFormat)
|
|
60
|
+
df(d)
|
|
61
|
+
target: "##{placeholder_name}"
|
|
62
|
+
x_accessor: 'date'
|
|
63
|
+
y_accessor: 'value'
|
|
@@ -0,0 +1,88 @@
|
|
|
1
|
+
class @Nvd3Graph
|
|
2
|
+
constructor: (data, keys, stat_alias, graph_type, date_axis_tick, date_format, width, height) ->
|
|
3
|
+
@statAlias = stat_alias
|
|
4
|
+
@width = width
|
|
5
|
+
@height = height
|
|
6
|
+
@keys = keys
|
|
7
|
+
@graphType = graph_type
|
|
8
|
+
@dateAxisTick = date_axis_tick
|
|
9
|
+
@dateFormat = date_format
|
|
10
|
+
@data = @prepareData(data)
|
|
11
|
+
@draw()
|
|
12
|
+
|
|
13
|
+
prepareData: (rawData) ->
|
|
14
|
+
resultData = []
|
|
15
|
+
|
|
16
|
+
i = 0
|
|
17
|
+
rawData.forEach (dataForKey) =>
|
|
18
|
+
values = []
|
|
19
|
+
dataForKey.forEach (stat) =>
|
|
20
|
+
fff = d3.time.format('%Y-%m-%d')
|
|
21
|
+
date = fff.parse(stat.date)
|
|
22
|
+
values.push [date, stat.value]
|
|
23
|
+
|
|
24
|
+
resultData.push {values: values, key: keys[i]}
|
|
25
|
+
i++
|
|
26
|
+
|
|
27
|
+
resultData
|
|
28
|
+
|
|
29
|
+
draw: ->
|
|
30
|
+
placeholder_name = "#{@statAlias}_statistics"
|
|
31
|
+
graphData = @data
|
|
32
|
+
dateFormat = @dateFormat
|
|
33
|
+
graphType = @graphType
|
|
34
|
+
|
|
35
|
+
if graphData.length
|
|
36
|
+
maximums = []
|
|
37
|
+
graphData.forEach (data) =>
|
|
38
|
+
maximum = d3.max data.values, (d) -> d[1]
|
|
39
|
+
maximums.push maximum
|
|
40
|
+
maxY = d3.max maximums
|
|
41
|
+
|
|
42
|
+
maximums = []
|
|
43
|
+
graphData.forEach (data) =>
|
|
44
|
+
maximum = d3.max data.values, (d) -> d[0]
|
|
45
|
+
maximums.push maximum
|
|
46
|
+
maxDate = d3.max maximums
|
|
47
|
+
|
|
48
|
+
minimums = []
|
|
49
|
+
graphData.forEach (data) =>
|
|
50
|
+
minimum = d3.min data.values, (d) -> d[0]
|
|
51
|
+
minimums.push minimum
|
|
52
|
+
minDate = d3.max minimums
|
|
53
|
+
|
|
54
|
+
nv.addGraph =>
|
|
55
|
+
if graphType == 'stacked'
|
|
56
|
+
chart = nv.models.stackedAreaChart().x((d) -> d[0]).y((d) -> d[1]).useInteractiveGuideline(true)
|
|
57
|
+
.transitionDuration(500)
|
|
58
|
+
.showControls(true)
|
|
59
|
+
.clipEdge(true)
|
|
60
|
+
.color(d3.scale.category20().range())
|
|
61
|
+
else
|
|
62
|
+
chart = nv.models.lineChart().interpolate("basic").x((d) ->
|
|
63
|
+
d[0]
|
|
64
|
+
).y((d) ->
|
|
65
|
+
d[1]
|
|
66
|
+
).color(d3.scale.category20().range())
|
|
67
|
+
chart.width = @width
|
|
68
|
+
chart.height = @height
|
|
69
|
+
|
|
70
|
+
chart.yAxis.tickFormat(d3.format('f'))
|
|
71
|
+
|
|
72
|
+
chart.forceY([0, maxY])
|
|
73
|
+
chart.yDomain([0.001, maxY])
|
|
74
|
+
|
|
75
|
+
chart.xAxis.tickFormat (d) ->
|
|
76
|
+
d3.time.format(dateFormat) new Date(d)
|
|
77
|
+
|
|
78
|
+
switch @dateAxisTick
|
|
79
|
+
when 'month'
|
|
80
|
+
chart.xAxis.tickValues(d3.time.month.range(minDate, maxDate, 1))
|
|
81
|
+
when 'week'
|
|
82
|
+
chart.xAxis.tickValues(d3.time.week.range(minDate, maxDate, 1))
|
|
83
|
+
else
|
|
84
|
+
chart.xAxis.tickValues(d3.time.day.range(minDate, maxDate, 1))
|
|
85
|
+
d3.select("##{placeholder_name} svg").datum(graphData).transition().duration(500).call(chart)
|
|
86
|
+
|
|
87
|
+
nv.utils.windowResize chart.update
|
|
88
|
+
chart
|
|
@@ -0,0 +1,17 @@
|
|
|
1
|
+
/*
|
|
2
|
+
*= require bootstrap.min
|
|
3
|
+
*= require metricsgraphics
|
|
4
|
+
*/
|
|
5
|
+
|
|
6
|
+
.models_stats_graph .chart_title {
|
|
7
|
+
font-size: 15px;
|
|
8
|
+
}
|
|
9
|
+
|
|
10
|
+
@font-face {
|
|
11
|
+
font-family: 'Glyphicons Halflings';
|
|
12
|
+
src: url('../assets/bootstrap/glyphicons-halflings-regular.eot');
|
|
13
|
+
src: url('../assets/bootstrap/glyphicons-halflings-regular.eot?#iefix') format('embedded-opentype'),
|
|
14
|
+
url('../assets/bootstrap/glyphicons-halflings-regular.woff') format('woff'),
|
|
15
|
+
url('../assets/bootstrap/glyphicons-halflings-regular.ttf') format('truetype'),
|
|
16
|
+
url('../assets/bootstrap/glyphicons-halflings-regular.svg#glyphicons_halflingsregular') format('svg');
|
|
17
|
+
}
|
|
@@ -0,0 +1,27 @@
|
|
|
1
|
+
module ModelsStats::GraphHelper
|
|
2
|
+
def render_models_stats_graph(stat_alias, period = 1.month)
|
|
3
|
+
stat_params = ModelsStats::CONFIG.select{|config| name, params = config.first; name.to_s == stat_alias.to_s}.first
|
|
4
|
+
if stat_params
|
|
5
|
+
stat_params = stat_params.values[0]
|
|
6
|
+
keys, stat_data = ModelsStats::Statistics.for_period(stat_alias, period)
|
|
7
|
+
graph_width = stat_params["graph_width"] || ModelsStats.default_graphics_width
|
|
8
|
+
graph_height = stat_params["graph_height"] || ModelsStats.default_graphics_height
|
|
9
|
+
if stat_params["graphic_type"].present? && !stat_params["graphic_type"].to_sym.in?(ModelsStats::GRAPHICS_TYPES)
|
|
10
|
+
return "Unknown graphic type"
|
|
11
|
+
end
|
|
12
|
+
graphic_type = stat_params["graphic_type"] || ModelsStats.default_graphics_type
|
|
13
|
+
graphic_lib = stat_params["graphic_lib"] || ModelsStats.default_lib_for_graphics
|
|
14
|
+
date_tick = stat_params["date_tick"] || ModelsStats.default_date_tick
|
|
15
|
+
date_format = stat_params["date_format"] || ModelsStats.default_date_format
|
|
16
|
+
render partial: 'models_stats/model_statistics_graph', locals: {graph_title: stat_params["description"] || stat_alias, keys: keys, stat_data: stat_data,
|
|
17
|
+
stat_alias: stat_alias, width: graph_width, height: graph_height, graphic_lib: graphic_lib,
|
|
18
|
+
graphic_type: graphic_type, date_tick: date_tick, date_format: date_format}
|
|
19
|
+
else
|
|
20
|
+
"No params for #{stat_alias}"
|
|
21
|
+
end
|
|
22
|
+
end
|
|
23
|
+
|
|
24
|
+
def render_models_stats_dashboard
|
|
25
|
+
render partial: 'models_stats/dashboard'
|
|
26
|
+
end
|
|
27
|
+
end
|
|
@@ -0,0 +1,11 @@
|
|
|
1
|
+
<h2>Models statistics dashboard</h2>
|
|
2
|
+
<div class="row">
|
|
3
|
+
<% ModelsStats::CONFIG.group_by{|params| params.values[0]["datetime_attr"].present?}.each do |for_new_models, models_group| %>
|
|
4
|
+
<div class="col-md-6">
|
|
5
|
+
<h3><%= for_new_models ? "New models" : "Total models" %></h3>
|
|
6
|
+
<% models_group.each do |params| %>
|
|
7
|
+
<%= render_models_stats_graph(params.keys[0], 1.month) %>
|
|
8
|
+
<% end %>
|
|
9
|
+
</div>
|
|
10
|
+
<% end %>
|
|
11
|
+
</div>
|
|
@@ -0,0 +1,39 @@
|
|
|
1
|
+
<script type="text/javascript">
|
|
2
|
+
$(function(){
|
|
3
|
+
keys = <%= keys.to_json.html_safe %>
|
|
4
|
+
data = <%= stat_data.to_json.html_safe %>
|
|
5
|
+
<% case graphic_lib.to_s
|
|
6
|
+
when 'nvd3' %>
|
|
7
|
+
new Nvd3Graph(data, keys, '<%= stat_alias %>', '<%= graphic_type %>', '<%= date_tick %>', '<%= date_format %>', <%= width %>, <%= height %>)
|
|
8
|
+
<% when 'metrics_graphics' %>
|
|
9
|
+
new MetricsGraph('<%= graph_title %>', keys, data, '<%= stat_alias %>', '<%= date_tick %>', '<%= date_format %>', <%= width %>, <%= height %>)
|
|
10
|
+
<% end %>
|
|
11
|
+
})
|
|
12
|
+
</script>
|
|
13
|
+
|
|
14
|
+
<% if stat_data.empty? %>
|
|
15
|
+
<%= graph_title %>
|
|
16
|
+
</br>
|
|
17
|
+
No data
|
|
18
|
+
</br>
|
|
19
|
+
</br>
|
|
20
|
+
<% else %>
|
|
21
|
+
<% case graphic_lib.to_s
|
|
22
|
+
when 'nvd3' %>
|
|
23
|
+
<h4 style="margin: 0;"><%= graph_title %></h4>
|
|
24
|
+
<div id="<%= stat_alias %>_statistics", style="height: <%= height %>px; width: <%= width %>px;">
|
|
25
|
+
<svg></svg>
|
|
26
|
+
</div>
|
|
27
|
+
<% when 'metrics_graphics' %>
|
|
28
|
+
<div class="models_stats_graph" style='clear: both;'>
|
|
29
|
+
<div class='<%= stat_alias %>_statistics_legend legend' style='float: right;'></div>
|
|
30
|
+
<div class='col-lg-12 text-center extended-y-ticks' id='<%= stat_alias %>_statistics'></div>
|
|
31
|
+
</div>
|
|
32
|
+
<% else %>
|
|
33
|
+
<%= graph_title %>
|
|
34
|
+
</br>
|
|
35
|
+
Unknown graphics lib
|
|
36
|
+
</br>
|
|
37
|
+
</br>
|
|
38
|
+
<% end %>
|
|
39
|
+
<% end %>
|