gruff 0.9.0-java → 0.10.0-java
This diff represents the content of publicly available package versions that have been released to one of the supported registries. The information contained in this diff is provided for informational purposes only and reflects changes between package versions as they appear in their respective public registries.
- checksums.yaml +4 -4
- data/.rubocop_todo.yml +0 -6
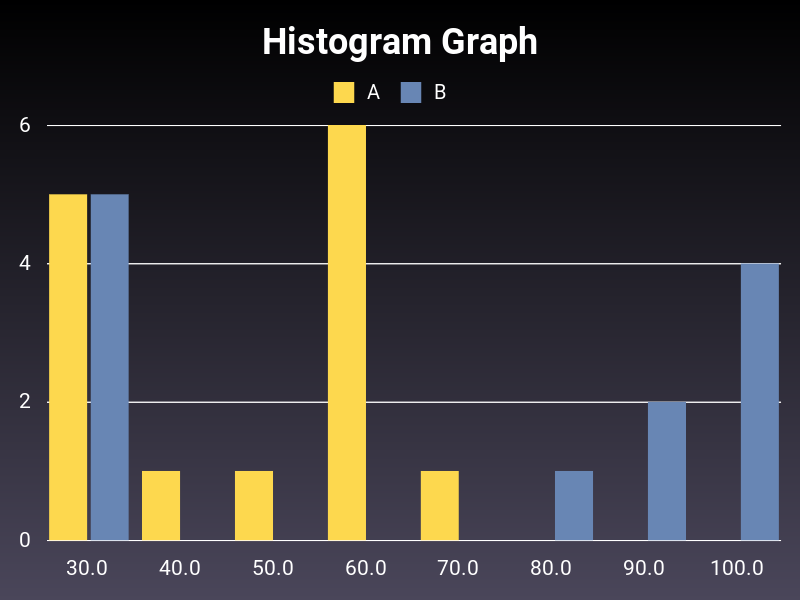
- data/CHANGELOG.md +7 -0
- data/README.md +4 -0
- data/gruff.gemspec +1 -0
- data/lib/gruff.rb +1 -0
- data/lib/gruff/accumulator_bar.rb +13 -3
- data/lib/gruff/area.rb +22 -1
- data/lib/gruff/bar.rb +15 -0
- data/lib/gruff/base.rb +99 -71
- data/lib/gruff/bezier.rb +18 -0
- data/lib/gruff/bullet.rb +10 -0
- data/lib/gruff/dot.rb +13 -2
- data/lib/gruff/helper/stacked_mixin.rb +1 -1
- data/lib/gruff/histogram.rb +59 -0
- data/lib/gruff/line.rb +4 -2
- data/lib/gruff/mini/bar.rb +9 -1
- data/lib/gruff/mini/pie.rb +8 -1
- data/lib/gruff/mini/side_bar.rb +17 -2
- data/lib/gruff/net.rb +22 -1
- data/lib/gruff/patch/string.rb +3 -1
- data/lib/gruff/pie.rb +5 -4
- data/lib/gruff/scatter.rb +5 -4
- data/lib/gruff/side_bar.rb +18 -5
- data/lib/gruff/side_stacked_bar.rb +17 -2
- data/lib/gruff/spider.rb +12 -1
- data/lib/gruff/stacked_area.rb +11 -1
- data/lib/gruff/stacked_bar.rb +11 -1
- data/lib/gruff/store/base_data.rb +1 -1
- data/lib/gruff/store/custom_data.rb +1 -1
- data/lib/gruff/store/store.rb +1 -1
- data/lib/gruff/store/xy_data.rb +1 -1
- data/lib/gruff/version.rb +1 -1
- metadata +17 -2
checksums.yaml
CHANGED
|
@@ -1,7 +1,7 @@
|
|
|
1
1
|
---
|
|
2
2
|
SHA256:
|
|
3
|
-
metadata.gz:
|
|
4
|
-
data.tar.gz:
|
|
3
|
+
metadata.gz: 6efd63c58b0b6e99141a8f96acac661c53bf7c3c36b9821e3ff6e39846de6601
|
|
4
|
+
data.tar.gz: f1a55c5c16668094c461de8a201e6358ce23054829687af411e6b4b343949803
|
|
5
5
|
SHA512:
|
|
6
|
-
metadata.gz:
|
|
7
|
-
data.tar.gz:
|
|
6
|
+
metadata.gz: feecb5cf63e6b621b9a4b17f1b71d83f2e1ddfc1d4f09eb0efe432b767f484fdb672a1bda4712da0df628ecde9f234553c18eeb5de59f08ed3cdb196026f534e
|
|
7
|
+
data.tar.gz: 1cf1098579f7c942cced3ab22fef432245b1708aa0a3fcfdcf6d69556c378ab0801dfcbe52060c36b77d3be4035940693f04ff919c7ee7ad904e2aca00349853
|
data/.rubocop_todo.yml
CHANGED
|
@@ -63,12 +63,6 @@ Metrics/ParameterLists:
|
|
|
63
63
|
Metrics/PerceivedComplexity:
|
|
64
64
|
Max: 20
|
|
65
65
|
|
|
66
|
-
# Offense count: 2
|
|
67
|
-
Naming/AccessorMethodName:
|
|
68
|
-
Exclude:
|
|
69
|
-
- 'lib/gruff/helper/stacked_mixin.rb'
|
|
70
|
-
- 'lib/gruff/store/store.rb'
|
|
71
|
-
|
|
72
66
|
# Offense count: 1
|
|
73
67
|
# Configuration parameters: EnforcedStyleForLeadingUnderscores.
|
|
74
68
|
# SupportedStylesForLeadingUnderscores: disallowed, required, optional
|
data/CHANGELOG.md
CHANGED
|
@@ -1,5 +1,12 @@
|
|
|
1
1
|
# Change Log
|
|
2
2
|
|
|
3
|
+
## 0.10.0
|
|
4
|
+
|
|
5
|
+
* Add Histogram chart (#419)
|
|
6
|
+
* Fix that Y axis label is not displayed on JRuby platform (#415)
|
|
7
|
+
* Add fill_opacity and stroke_width in Gruff::Area in order to specify the filling opacity (#413)
|
|
8
|
+
* Fix "`get_type_metrics': no text to measure" exception (#410, #409)
|
|
9
|
+
|
|
3
10
|
## 0.9.0
|
|
4
11
|
|
|
5
12
|
* Fix that sidebar label is not displayed on JRuby platform (#402)
|
data/README.md
CHANGED
|
@@ -119,6 +119,10 @@ In progress!
|
|
|
119
119
|
|
|
120
120
|
|
|
121
121
|
|
|
122
|
+
### Histogram chart
|
|
123
|
+
|
|
124
|
+
|
|
125
|
+
|
|
122
126
|
|
|
123
127
|
## Documentation
|
|
124
128
|
|
data/gruff.gemspec
CHANGED
data/lib/gruff.rb
CHANGED
|
@@ -2,9 +2,19 @@
|
|
|
2
2
|
|
|
3
3
|
require 'gruff/base'
|
|
4
4
|
|
|
5
|
-
#
|
|
6
|
-
#
|
|
7
|
-
#
|
|
5
|
+
#
|
|
6
|
+
# Gruff::AccumulatorBar is a special bar graph that shows a
|
|
7
|
+
# single dataset as a set of stacked bars.
|
|
8
|
+
# The bottom bar shows the running total and the top bar shows
|
|
9
|
+
# the new value being added to the array.
|
|
10
|
+
#
|
|
11
|
+
# Here's how to set up a Gruff::AccumulatorBar.
|
|
12
|
+
#
|
|
13
|
+
# g = Gruff::AccumulatorBar.new
|
|
14
|
+
# g.title = 'Your Savings'
|
|
15
|
+
# g.data 'First', [1, 1, 1]
|
|
16
|
+
# g.write('accumulator_bar.png')
|
|
17
|
+
#
|
|
8
18
|
class Gruff::AccumulatorBar < Gruff::StackedBar
|
|
9
19
|
def draw
|
|
10
20
|
raise(Gruff::IncorrectNumberOfDatasetsException) unless store.length == 1
|
data/lib/gruff/area.rb
CHANGED
|
@@ -2,10 +2,31 @@
|
|
|
2
2
|
|
|
3
3
|
require 'gruff/base'
|
|
4
4
|
|
|
5
|
+
#
|
|
6
|
+
# Gruff::Area provides an area graph which displays graphically
|
|
7
|
+
# quantitative data.
|
|
8
|
+
#
|
|
9
|
+
# Here's how to set up a Gruff::Area.
|
|
10
|
+
#
|
|
11
|
+
# g = Gruff::Area.new
|
|
12
|
+
# g.title = 'Area Graph'
|
|
13
|
+
# g.data :Jimmy, [25, 36, 86, 39, 25, 31, 79, 88]
|
|
14
|
+
# g.data :Charles, [80, 54, 67, 54, 68, 70, 90, 95]
|
|
15
|
+
# g.data :Julie, [22, 29, 35, 38, 36, 40, 46, 57]
|
|
16
|
+
# g.write('area.png')
|
|
17
|
+
#
|
|
5
18
|
class Gruff::Area < Gruff::Base
|
|
19
|
+
# Specifies the filling opacity in area graph. Default is +0.85+.
|
|
20
|
+
attr_accessor :fill_opacity
|
|
21
|
+
|
|
22
|
+
# Specifies the stroke width in line around area graph. Default is +2.0+.
|
|
23
|
+
attr_accessor :stroke_width
|
|
24
|
+
|
|
6
25
|
def initialize_ivars
|
|
7
26
|
super
|
|
8
27
|
@sorted_drawing = true
|
|
28
|
+
@fill_opacity = 0.85
|
|
29
|
+
@stroke_width = 2.0
|
|
9
30
|
end
|
|
10
31
|
private :initialize_ivars
|
|
11
32
|
|
|
@@ -36,7 +57,7 @@ class Gruff::Area < Gruff::Base
|
|
|
36
57
|
poly_points << @graph_left
|
|
37
58
|
poly_points << @graph_bottom - 1
|
|
38
59
|
|
|
39
|
-
Gruff::Renderer::Polygon.new(color: data_row.color).render(poly_points)
|
|
60
|
+
Gruff::Renderer::Polygon.new(color: data_row.color, width: @stroke_width, opacity: @fill_opacity).render(poly_points)
|
|
40
61
|
end
|
|
41
62
|
|
|
42
63
|
Gruff::Renderer.finish
|
data/lib/gruff/bar.rb
CHANGED
|
@@ -3,6 +3,21 @@
|
|
|
3
3
|
require 'gruff/base'
|
|
4
4
|
require 'gruff/helper/bar_conversion'
|
|
5
5
|
|
|
6
|
+
#
|
|
7
|
+
# Gruff::Bar provide a bar graph that presents categorical data
|
|
8
|
+
# with rectangular bars.
|
|
9
|
+
#
|
|
10
|
+
# Here's how to set up a Gruff::Bar.
|
|
11
|
+
#
|
|
12
|
+
# g = Gruff::Bar.new
|
|
13
|
+
# g.title = 'Bar Graph With Manual Colors'
|
|
14
|
+
# g.spacing_factor = 0.1
|
|
15
|
+
# g.group_spacing = 20
|
|
16
|
+
# g.data :Art, [0, 5, 8, 15], '#990000'
|
|
17
|
+
# g.data :Philosophy, [10, 3, 2, 8], '#009900'
|
|
18
|
+
# g.data :Science, [2, 15, 8, 11], '#990099'
|
|
19
|
+
# g.write('bar.png')
|
|
20
|
+
#
|
|
6
21
|
class Gruff::Bar < Gruff::Base
|
|
7
22
|
# Spacing factor applied between bars.
|
|
8
23
|
attr_accessor :bar_spacing
|
data/lib/gruff/base.rb
CHANGED
|
@@ -25,24 +25,22 @@ module Gruff
|
|
|
25
25
|
|
|
26
26
|
DEFAULT_TARGET_WIDTH = 800.0
|
|
27
27
|
|
|
28
|
-
|
|
29
|
-
|
|
30
|
-
# Blank space above the graph.
|
|
28
|
+
# Blank space above the graph. Default is +20+.
|
|
31
29
|
attr_accessor :top_margin
|
|
32
30
|
|
|
33
|
-
# Blank space below the graph.
|
|
31
|
+
# Blank space below the graph. Default is +20+.
|
|
34
32
|
attr_accessor :bottom_margin
|
|
35
33
|
|
|
36
|
-
# Blank space to the right of the graph.
|
|
34
|
+
# Blank space to the right of the graph. Default is +20+.
|
|
37
35
|
attr_accessor :right_margin
|
|
38
36
|
|
|
39
|
-
# Blank space to the left of the graph.
|
|
37
|
+
# Blank space to the left of the graph. Default is +20+.
|
|
40
38
|
attr_accessor :left_margin
|
|
41
39
|
|
|
42
|
-
# Blank space below the title.
|
|
40
|
+
# Blank space below the title. Default is +20+.
|
|
43
41
|
attr_accessor :title_margin
|
|
44
42
|
|
|
45
|
-
# Blank space below the legend.
|
|
43
|
+
# Blank space below the legend. Default is +20+.
|
|
46
44
|
attr_accessor :legend_margin
|
|
47
45
|
|
|
48
46
|
# A hash of names for the individual columns, where the key is the array
|
|
@@ -59,19 +57,19 @@ module Gruff
|
|
|
59
57
|
# By default, labels are centered over the point they represent.
|
|
60
58
|
attr_accessor :center_labels_over_point
|
|
61
59
|
|
|
62
|
-
# Used internally for horizontal graph types.
|
|
60
|
+
# Used internally for horizontal graph types. Default is +false+.
|
|
63
61
|
attr_accessor :has_left_labels
|
|
64
62
|
|
|
65
|
-
#
|
|
63
|
+
# Set a label for the bottom of the graph.
|
|
66
64
|
attr_accessor :x_axis_label
|
|
67
65
|
|
|
68
|
-
#
|
|
66
|
+
# Set a label for the left side of the graph.
|
|
69
67
|
attr_accessor :y_axis_label
|
|
70
68
|
|
|
71
|
-
#
|
|
69
|
+
# Set increment of the vertical marking lines.
|
|
72
70
|
attr_accessor :x_axis_increment
|
|
73
71
|
|
|
74
|
-
#
|
|
72
|
+
# Set increment of the horizontal marking lines.
|
|
75
73
|
attr_accessor :y_axis_increment
|
|
76
74
|
|
|
77
75
|
# Height of staggering between labels (Bar graph only).
|
|
@@ -90,7 +88,7 @@ module Gruff
|
|
|
90
88
|
# Get or set the list of colors that will be used to draw the bars or lines.
|
|
91
89
|
attr_accessor :colors
|
|
92
90
|
|
|
93
|
-
#
|
|
91
|
+
# Set the large title of the graph displayed at the top.
|
|
94
92
|
attr_accessor :title
|
|
95
93
|
|
|
96
94
|
# Font used for titles, labels, etc. Works best if you provide the full
|
|
@@ -98,31 +96,32 @@ module Gruff
|
|
|
98
96
|
# libraries for this to work properly.
|
|
99
97
|
attr_reader :font
|
|
100
98
|
|
|
101
|
-
# Same as font but for the title.
|
|
99
|
+
# Same as {#font} but for the title.
|
|
102
100
|
attr_accessor :title_font
|
|
103
101
|
|
|
104
|
-
# Specifies whether to draw the title bolded or not.
|
|
102
|
+
# Specifies whether to draw the title bolded or not. Default is +true+.
|
|
105
103
|
attr_accessor :bold_title
|
|
106
104
|
|
|
105
|
+
# Specifies the text color.
|
|
107
106
|
attr_accessor :font_color
|
|
108
107
|
|
|
109
|
-
# Prevent drawing of line markers.
|
|
108
|
+
# Prevent drawing of line markers. Default is +false+.
|
|
110
109
|
attr_accessor :hide_line_markers
|
|
111
110
|
|
|
112
|
-
# Prevent drawing of the legend.
|
|
111
|
+
# Prevent drawing of the legend. Default is +false+.
|
|
113
112
|
attr_accessor :hide_legend
|
|
114
113
|
|
|
115
|
-
# Prevent drawing of the title.
|
|
114
|
+
# Prevent drawing of the title. Default is +false+.
|
|
116
115
|
attr_accessor :hide_title
|
|
117
116
|
|
|
118
|
-
# Prevent drawing of line numbers.
|
|
117
|
+
# Prevent drawing of line numbers. Default is +false+.
|
|
119
118
|
attr_accessor :hide_line_numbers
|
|
120
119
|
|
|
121
|
-
#
|
|
120
|
+
# Set a message shown when there is no data. Fits up to 20 characters. Defaults
|
|
122
121
|
# to +"No Data."+.
|
|
123
122
|
attr_accessor :no_data_message
|
|
124
123
|
|
|
125
|
-
#
|
|
124
|
+
# Set the font size of the large title at the top of the graph. Default is +36+.
|
|
126
125
|
attr_accessor :title_font_size
|
|
127
126
|
|
|
128
127
|
# Optionally set the size of the font. Based on an 800x600px graph.
|
|
@@ -131,30 +130,29 @@ module Gruff
|
|
|
131
130
|
# Will be scaled down if the graph is smaller than 800px wide.
|
|
132
131
|
attr_accessor :legend_font_size
|
|
133
132
|
|
|
134
|
-
# Display the legend under the graph.
|
|
133
|
+
# Display the legend under the graph. Default is +false+.
|
|
135
134
|
attr_accessor :legend_at_bottom
|
|
136
135
|
|
|
137
|
-
# The font size of the labels around the graph.
|
|
136
|
+
# The font size of the labels around the graph. Default is +21+.
|
|
138
137
|
attr_accessor :marker_font_size
|
|
139
138
|
|
|
140
|
-
#
|
|
139
|
+
# Set the color of the auxiliary lines.
|
|
141
140
|
attr_accessor :marker_color
|
|
141
|
+
|
|
142
|
+
# Set the shadow color of the auxiliary lines.
|
|
142
143
|
attr_accessor :marker_shadow_color
|
|
143
144
|
|
|
144
|
-
#
|
|
145
|
+
# Set the number of horizontal lines shown for reference.
|
|
145
146
|
attr_accessor :marker_count
|
|
146
147
|
|
|
147
|
-
# Set to true if you want the data sets sorted with largest avg values drawn
|
|
148
|
-
# first.
|
|
148
|
+
# Set to +true+ if you want the data sets sorted with largest avg values drawn
|
|
149
|
+
# first. Default is +false+.
|
|
149
150
|
attr_accessor :sort
|
|
150
151
|
|
|
151
|
-
# Set to true if you want the data sets drawn with largest avg values drawn
|
|
152
|
-
# first.
|
|
152
|
+
# Set to +true+ if you want the data sets drawn with largest avg values drawn
|
|
153
|
+
# first. This does not affect the legend. Default is +false+.
|
|
153
154
|
attr_accessor :sorted_drawing
|
|
154
155
|
|
|
155
|
-
# Experimental
|
|
156
|
-
attr_accessor :additional_line_values
|
|
157
|
-
|
|
158
156
|
# Optionally set the size of the colored box by each item in the legend.
|
|
159
157
|
# Default is +20.0+.
|
|
160
158
|
#
|
|
@@ -166,10 +164,13 @@ module Gruff
|
|
|
166
164
|
attr_accessor :use_data_label
|
|
167
165
|
|
|
168
166
|
# If one numerical argument is given, the graph is drawn at 4/3 ratio
|
|
169
|
-
# according to the given width (800 results in 800x600, 400 gives 400x300,
|
|
167
|
+
# according to the given width (+800+ results in 800x600, +400+ gives 400x300,
|
|
170
168
|
# etc.).
|
|
171
169
|
#
|
|
172
|
-
# Or, send a geometry string for other ratios ('800x400'
|
|
170
|
+
# Or, send a geometry string for other ratios ( +'800x400'+, +'400x225'+).
|
|
171
|
+
#
|
|
172
|
+
# @param target_width [Numeric, String] The graph image width.
|
|
173
|
+
#
|
|
173
174
|
def initialize(target_width = DEFAULT_TARGET_WIDTH)
|
|
174
175
|
if target_width.is_a?(String)
|
|
175
176
|
geometric_width, geometric_height = target_width.split('x')
|
|
@@ -200,18 +201,18 @@ module Gruff
|
|
|
200
201
|
@raw_columns.freeze
|
|
201
202
|
@raw_rows.freeze
|
|
202
203
|
|
|
204
|
+
@scale = @columns / @raw_columns
|
|
205
|
+
@scale.freeze
|
|
206
|
+
|
|
203
207
|
@marker_count = nil
|
|
204
208
|
@maximum_value = @minimum_value = nil
|
|
205
209
|
@increment = nil
|
|
206
210
|
@labels = {}
|
|
207
|
-
@labels_seen = {}
|
|
208
211
|
@sort = false
|
|
209
212
|
@sorted_drawing = false
|
|
210
213
|
@title = nil
|
|
211
214
|
@title_font = nil
|
|
212
215
|
|
|
213
|
-
@scale = @columns / @raw_columns
|
|
214
|
-
|
|
215
216
|
@font = nil
|
|
216
217
|
@bold_title = true
|
|
217
218
|
|
|
@@ -234,8 +235,6 @@ module Gruff
|
|
|
234
235
|
@label_max_size = 0
|
|
235
236
|
@label_truncation_style = :absolute
|
|
236
237
|
|
|
237
|
-
@additional_line_values = []
|
|
238
|
-
@additional_line_colors = []
|
|
239
238
|
@theme_options = {}
|
|
240
239
|
|
|
241
240
|
@use_data_label = false
|
|
@@ -248,11 +247,17 @@ module Gruff
|
|
|
248
247
|
protected :initialize_ivars
|
|
249
248
|
|
|
250
249
|
# Sets the top, bottom, left and right margins to +margin+.
|
|
250
|
+
#
|
|
251
|
+
# @param margin [Numeric] The margin size.
|
|
252
|
+
#
|
|
251
253
|
def margins=(margin)
|
|
252
254
|
@top_margin = @left_margin = @right_margin = @bottom_margin = margin
|
|
253
255
|
end
|
|
254
256
|
|
|
255
257
|
# Sets the font for graph text to the font at +font_path+.
|
|
258
|
+
#
|
|
259
|
+
# @param font_path [String] The path to font.
|
|
260
|
+
#
|
|
256
261
|
def font=(font_path)
|
|
257
262
|
@font = font_path
|
|
258
263
|
Gruff::Renderer.font = @font
|
|
@@ -260,6 +265,8 @@ module Gruff
|
|
|
260
265
|
|
|
261
266
|
# Add a color to the list of available colors for lines.
|
|
262
267
|
#
|
|
268
|
+
# @param colorname [String] The color.
|
|
269
|
+
#
|
|
263
270
|
# @example
|
|
264
271
|
# add_color('#c0e9d3')
|
|
265
272
|
def add_color(colorname)
|
|
@@ -277,6 +284,8 @@ module Gruff
|
|
|
277
284
|
# {#data} method made prior to this call will use whatever color scheme
|
|
278
285
|
# was in place at the time data was called.
|
|
279
286
|
#
|
|
287
|
+
# @param color_list [Array] The array of colors.
|
|
288
|
+
#
|
|
280
289
|
# @example
|
|
281
290
|
# replace_colors ['#cc99cc', '#d9e043', '#34d8a2']
|
|
282
291
|
def replace_colors(color_list = [])
|
|
@@ -296,12 +305,13 @@ module Gruff
|
|
|
296
305
|
#
|
|
297
306
|
# (Or hopefully something better looking than that.)
|
|
298
307
|
#
|
|
308
|
+
# @param options [Hash] The optional setting for theme
|
|
309
|
+
#
|
|
299
310
|
def theme=(options)
|
|
300
311
|
reset_themes
|
|
301
312
|
|
|
302
313
|
defaults = {
|
|
303
314
|
colors: %w[black white],
|
|
304
|
-
additional_line_colors: [],
|
|
305
315
|
marker_color: 'white',
|
|
306
316
|
marker_shadow_color: nil,
|
|
307
317
|
font_color: 'black',
|
|
@@ -314,35 +324,42 @@ module Gruff
|
|
|
314
324
|
@marker_color = @theme_options[:marker_color]
|
|
315
325
|
@marker_shadow_color = @theme_options[:marker_shadow_color]
|
|
316
326
|
@font_color = @theme_options[:font_color] || @marker_color
|
|
317
|
-
@additional_line_colors = @theme_options[:additional_line_colors]
|
|
318
327
|
|
|
319
328
|
Gruff::Renderer.setup(@columns, @rows, @font, @scale, @theme_options)
|
|
320
329
|
end
|
|
321
330
|
|
|
331
|
+
# Apply Apple's keynote theme.
|
|
322
332
|
def theme_keynote
|
|
323
333
|
self.theme = Themes::KEYNOTE
|
|
324
334
|
end
|
|
325
335
|
|
|
336
|
+
# Apply 37signals theme.
|
|
326
337
|
def theme_37signals
|
|
327
338
|
self.theme = Themes::THIRTYSEVEN_SIGNALS
|
|
328
339
|
end
|
|
329
340
|
|
|
341
|
+
# Apply Rails theme.
|
|
330
342
|
def theme_rails_keynote
|
|
331
343
|
self.theme = Themes::RAILS_KEYNOTE
|
|
332
344
|
end
|
|
333
345
|
|
|
346
|
+
# Apply Odeo theme.
|
|
334
347
|
def theme_odeo
|
|
335
348
|
self.theme = Themes::ODEO
|
|
336
349
|
end
|
|
337
350
|
|
|
351
|
+
# Apply pastel theme.
|
|
338
352
|
def theme_pastel
|
|
339
353
|
self.theme = Themes::PASTEL
|
|
340
354
|
end
|
|
341
355
|
|
|
356
|
+
# Apply greyscale theme.
|
|
342
357
|
def theme_greyscale
|
|
343
358
|
self.theme = Themes::GREYSCALE
|
|
344
359
|
end
|
|
345
360
|
|
|
361
|
+
# Input the data in the graph.
|
|
362
|
+
#
|
|
346
363
|
# Parameters are an array where the first element is the name of the dataset
|
|
347
364
|
# and the value is an array of values to plot.
|
|
348
365
|
#
|
|
@@ -352,6 +369,10 @@ module Gruff
|
|
|
352
369
|
# If the color argument is nil, the next color from the default theme will
|
|
353
370
|
# be used.
|
|
354
371
|
#
|
|
372
|
+
# @param name [String, Symbol] The name of the dataset.
|
|
373
|
+
# @param data_points [Array] The array of dataset.
|
|
374
|
+
# @param color [String] The color for drawing graph of dataset.
|
|
375
|
+
#
|
|
355
376
|
# @note
|
|
356
377
|
# If you want to use a preset theme, you must set it before calling {#data}.
|
|
357
378
|
#
|
|
@@ -382,6 +403,8 @@ module Gruff
|
|
|
382
403
|
|
|
383
404
|
# Writes the graph to a file. Defaults to +'graph.png'+
|
|
384
405
|
#
|
|
406
|
+
# @param file_name [String] The file name of output image.
|
|
407
|
+
#
|
|
385
408
|
# @example
|
|
386
409
|
# write('graphs/my_pretty_graph.png')
|
|
387
410
|
def write(file_name = 'graph.png')
|
|
@@ -465,12 +488,16 @@ module Gruff
|
|
|
465
488
|
@spread = @spread > 0 ? @spread : 1
|
|
466
489
|
end
|
|
467
490
|
|
|
491
|
+
def hide_title?
|
|
492
|
+
@hide_title || @title.nil? || @title.empty?
|
|
493
|
+
end
|
|
494
|
+
|
|
468
495
|
##
|
|
469
496
|
# Calculates size of drawable area, general font dimensions, etc.
|
|
470
497
|
|
|
471
498
|
def setup_graph_measurements
|
|
472
499
|
@marker_caps_height = @hide_line_markers ? 0 : calculate_caps_height(@marker_font_size)
|
|
473
|
-
@title_caps_height =
|
|
500
|
+
@title_caps_height = hide_title? ? 0 : calculate_caps_height(@title_font_size) * @title.lines.to_a.size
|
|
474
501
|
@legend_caps_height = @hide_legend ? 0 : calculate_caps_height(@legend_font_size)
|
|
475
502
|
|
|
476
503
|
if @hide_line_markers
|
|
@@ -512,7 +539,7 @@ module Gruff
|
|
|
512
539
|
@top_margin
|
|
513
540
|
else
|
|
514
541
|
@top_margin +
|
|
515
|
-
(
|
|
542
|
+
(hide_title? ? title_margin : @title_caps_height + title_margin) +
|
|
516
543
|
(@hide_legend ? legend_margin : @legend_caps_height + legend_margin)
|
|
517
544
|
end
|
|
518
545
|
end
|
|
@@ -559,9 +586,8 @@ module Gruff
|
|
|
559
586
|
Gruff::Renderer::Line.new(color: @marker_shadow_color).render(@graph_left, y + 1, @graph_right, y + 1)
|
|
560
587
|
end
|
|
561
588
|
|
|
562
|
-
marker_label = BigDecimal(index.to_s) * BigDecimal(@increment.to_s) + BigDecimal(minimum_value.to_s)
|
|
563
|
-
|
|
564
589
|
unless @hide_line_numbers
|
|
590
|
+
marker_label = BigDecimal(index.to_s) * BigDecimal(@increment.to_s) + BigDecimal(minimum_value.to_s)
|
|
565
591
|
label = label(marker_label, @increment)
|
|
566
592
|
text_renderer = Gruff::Renderer::Text.new(label, font: @font, size: @marker_font_size, color: @font_color)
|
|
567
593
|
text_renderer.render(@graph_left - LABEL_MARGIN, 1.0, 0.0, y, Magick::EastGravity)
|
|
@@ -593,8 +619,8 @@ module Gruff
|
|
|
593
619
|
# May fix legend drawing problem at small sizes
|
|
594
620
|
label_widths = [[]] # Used to calculate line wrap
|
|
595
621
|
legend_labels.each do |label|
|
|
596
|
-
|
|
597
|
-
label_width =
|
|
622
|
+
width = calculate_width(@legend_font_size, label)
|
|
623
|
+
label_width = width + legend_square_width * 2.7
|
|
598
624
|
label_widths.last.push label_width
|
|
599
625
|
|
|
600
626
|
if sum(label_widths.last) > (@raw_columns * 0.9)
|
|
@@ -607,11 +633,13 @@ module Gruff
|
|
|
607
633
|
if @legend_at_bottom
|
|
608
634
|
@graph_height + title_margin
|
|
609
635
|
else
|
|
610
|
-
|
|
636
|
+
hide_title? ? @top_margin + title_margin : @top_margin + title_margin + @title_caps_height
|
|
611
637
|
end
|
|
612
638
|
end
|
|
613
639
|
|
|
614
640
|
legend_labels.each_with_index do |legend_label, index|
|
|
641
|
+
next if legend_label.empty?
|
|
642
|
+
|
|
615
643
|
# Draw label
|
|
616
644
|
text_renderer = Gruff::Renderer::Text.new(legend_label, font: @font, size: @legend_font_size, color: @font_color)
|
|
617
645
|
text_renderer.render(@raw_columns, 1.0, current_x_offset + (legend_square_width * 1.7), current_y_offset, Magick::WestGravity)
|
|
@@ -623,8 +651,8 @@ module Gruff
|
|
|
623
651
|
current_x_offset + legend_square_width,
|
|
624
652
|
current_y_offset + legend_square_width / 2.0)
|
|
625
653
|
|
|
626
|
-
|
|
627
|
-
current_string_offset =
|
|
654
|
+
width = calculate_width(legend_font_size, legend_label)
|
|
655
|
+
current_string_offset = width + (legend_square_width * 2.7)
|
|
628
656
|
|
|
629
657
|
# Handle wrapping
|
|
630
658
|
label_widths.first.shift
|
|
@@ -646,9 +674,9 @@ module Gruff
|
|
|
646
674
|
|
|
647
675
|
# Draws a title on the graph.
|
|
648
676
|
def draw_title
|
|
649
|
-
return if
|
|
677
|
+
return if hide_title?
|
|
650
678
|
|
|
651
|
-
font =
|
|
679
|
+
font = @title_font || @font
|
|
652
680
|
font_weight = @bold_title ? Magick::BoldWeight : Magick::NormalWeight
|
|
653
681
|
font_size = @title_font_size
|
|
654
682
|
|
|
@@ -672,20 +700,7 @@ module Gruff
|
|
|
672
700
|
# TODO: See if index.odd? is the best stragegy
|
|
673
701
|
y_offset += @label_stagger_height if index.odd?
|
|
674
702
|
|
|
675
|
-
label_text = labels[index].to_s
|
|
676
|
-
|
|
677
|
-
# TESTME
|
|
678
|
-
# FIXME: Consider chart types other than bar
|
|
679
|
-
if label_text.size > @label_max_size
|
|
680
|
-
if @label_truncation_style == :trailing_dots
|
|
681
|
-
if @label_max_size > 3
|
|
682
|
-
# 4 because '...' takes up 3 chars
|
|
683
|
-
label_text = "#{label_text[0..(@label_max_size - 4)]}..."
|
|
684
|
-
end
|
|
685
|
-
else # @label_truncation_style is :absolute (default)
|
|
686
|
-
label_text = label_text[0..(@label_max_size - 1)]
|
|
687
|
-
end
|
|
688
|
-
end
|
|
703
|
+
label_text = truncate_label_text(labels[index].to_s)
|
|
689
704
|
|
|
690
705
|
if x_offset >= @graph_left && x_offset <= @graph_right
|
|
691
706
|
text_renderer = Gruff::Renderer::Text.new(label_text, font: @font, size: @marker_font_size, color: @font_color)
|
|
@@ -697,6 +712,7 @@ module Gruff
|
|
|
697
712
|
def draw_unique_label(index)
|
|
698
713
|
return if @hide_line_markers
|
|
699
714
|
|
|
715
|
+
@labels_seen ||= {}
|
|
700
716
|
if !@labels[index].nil? && @labels_seen[index].nil?
|
|
701
717
|
yield
|
|
702
718
|
@labels_seen[index] = 1
|
|
@@ -719,7 +735,6 @@ module Gruff
|
|
|
719
735
|
|
|
720
736
|
# Resets everything to defaults (except data).
|
|
721
737
|
def reset_themes
|
|
722
|
-
@labels_seen = {}
|
|
723
738
|
@theme_options = {}
|
|
724
739
|
end
|
|
725
740
|
|
|
@@ -768,7 +783,7 @@ module Gruff
|
|
|
768
783
|
|
|
769
784
|
# Set the color for each data set unless it was given in the data(...) call.
|
|
770
785
|
def set_colors
|
|
771
|
-
store.
|
|
786
|
+
store.change_colors(@colors)
|
|
772
787
|
end
|
|
773
788
|
|
|
774
789
|
# Sort with largest overall summed value at front of array so it shows up
|
|
@@ -779,6 +794,18 @@ module Gruff
|
|
|
779
794
|
|
|
780
795
|
private
|
|
781
796
|
|
|
797
|
+
def truncate_label_text(text)
|
|
798
|
+
return text if text.size <= @label_max_size
|
|
799
|
+
|
|
800
|
+
if @label_truncation_style == :trailing_dots
|
|
801
|
+
# 4 because '...' takes up 3 chars
|
|
802
|
+
text = "#{text[0..(@label_max_size - 4)]}..." if @label_max_size > 3
|
|
803
|
+
else
|
|
804
|
+
text = text[0..(@label_max_size - 1)]
|
|
805
|
+
end
|
|
806
|
+
text
|
|
807
|
+
end
|
|
808
|
+
|
|
782
809
|
# Return a formatted string representing a number value that should be
|
|
783
810
|
# printed as a label.
|
|
784
811
|
def label(value, increment)
|
|
@@ -807,7 +834,7 @@ module Gruff
|
|
|
807
834
|
end
|
|
808
835
|
|
|
809
836
|
parts = label.split('.')
|
|
810
|
-
parts[0].
|
|
837
|
+
parts[0] = parts[0].commify
|
|
811
838
|
parts.join('.')
|
|
812
839
|
end
|
|
813
840
|
|
|
@@ -826,7 +853,8 @@ module Gruff
|
|
|
826
853
|
# Not scaled since it deals with dimensions that the regular
|
|
827
854
|
# scaling will handle.
|
|
828
855
|
def calculate_width(font_size, text)
|
|
829
|
-
|
|
856
|
+
text = text.to_s
|
|
857
|
+
return 0 if text.empty?
|
|
830
858
|
|
|
831
859
|
metrics = Renderer::Text.metrics(text, font_size)
|
|
832
860
|
metrics.width
|
data/lib/gruff/bezier.rb
CHANGED
|
@@ -2,6 +2,24 @@
|
|
|
2
2
|
|
|
3
3
|
require 'gruff/base'
|
|
4
4
|
|
|
5
|
+
#
|
|
6
|
+
# Gruff::Bezier is a special line graph that have
|
|
7
|
+
# the bezier curve.
|
|
8
|
+
#
|
|
9
|
+
# Here's how to set up a Gruff::Bezier.
|
|
10
|
+
#
|
|
11
|
+
# dataset = [
|
|
12
|
+
# +0.00, +0.09, +0.19, +0.29, +0.38, +0.47, +0.56, +0.64, +0.71, +0.78,
|
|
13
|
+
# +0.84, +0.89, +0.93, +0.96, +0.98, +0.99, +0.99, +0.99, +0.97, +0.94,
|
|
14
|
+
# +0.90, +0.86, +0.80, +0.74, +0.67, +0.59, +0.51, +0.42, +0.33, +0.23,
|
|
15
|
+
# +0.14, +0.04, -0.06, -0.16, -0.26, -0.36, -0.45, -0.53, -0.62, -0.69,
|
|
16
|
+
# -0.76, -0.82, -0.88, -0.92, -0.96, -0.98, -1.00, -1.00, -1.00, -0.99,
|
|
17
|
+
# -0.96, -0.93, -0.89, -0.84, -0.78, -0.71, -0.64, -0.56, -0.47, -0.38,
|
|
18
|
+
# ]
|
|
19
|
+
# g = Gruff::Bezier.new
|
|
20
|
+
# g.data 'sin', dataset
|
|
21
|
+
# g.write('bezier.png')
|
|
22
|
+
#
|
|
5
23
|
class Gruff::Bezier < Gruff::Base
|
|
6
24
|
def draw
|
|
7
25
|
super
|
data/lib/gruff/bullet.rb
CHANGED
|
@@ -3,7 +3,17 @@
|
|
|
3
3
|
require 'gruff/base'
|
|
4
4
|
require 'gruff/themes'
|
|
5
5
|
|
|
6
|
+
#
|
|
7
|
+
# A bullet graph is a variation of a bar graph.
|
|
6
8
|
# http://en.wikipedia.org/wiki/Bullet_graph
|
|
9
|
+
#
|
|
10
|
+
# Here's how to set up a Gruff::Bullet.
|
|
11
|
+
#
|
|
12
|
+
# g = Gruff::Bullet.new
|
|
13
|
+
# g.title = 'Monthly Revenue'
|
|
14
|
+
# g.data 75, 100, { target: 80, low: 50, high: 90 }
|
|
15
|
+
# g.write('bullet.png')
|
|
16
|
+
#
|
|
7
17
|
class Gruff::Bullet < Gruff::Base
|
|
8
18
|
def initialize(target_width = '400x40')
|
|
9
19
|
if target_width.is_a?(String)
|
data/lib/gruff/dot.rb
CHANGED
|
@@ -2,8 +2,19 @@
|
|
|
2
2
|
|
|
3
3
|
require 'gruff/base'
|
|
4
4
|
|
|
5
|
-
#
|
|
5
|
+
#
|
|
6
|
+
# Graph with dots and labels along a vertical access.
|
|
6
7
|
# see: 'Creating More Effective Graphs' by Robbins
|
|
8
|
+
#
|
|
9
|
+
# Here's how to set up a Gruff::Dot.
|
|
10
|
+
#
|
|
11
|
+
# g = Gruff::Dot.new
|
|
12
|
+
# g.title = 'Dot Graph'
|
|
13
|
+
# g.data :Art, [0, 5, 8, 15]
|
|
14
|
+
# g.data :Philosophy, [10, 3, 2, 8]
|
|
15
|
+
# g.data :Science, [2, 15, 8, 11]
|
|
16
|
+
# g.write('dot.png')
|
|
17
|
+
#
|
|
7
18
|
class Gruff::Dot < Gruff::Base
|
|
8
19
|
def draw
|
|
9
20
|
@has_left_labels = true
|
|
@@ -84,7 +95,7 @@ protected
|
|
|
84
95
|
def draw_label(y_offset, index)
|
|
85
96
|
draw_unique_label(index) do
|
|
86
97
|
text_renderer = Gruff::Renderer::Text.new(@labels[index], font: @font, size: @marker_font_size, color: @font_color)
|
|
87
|
-
text_renderer.render(
|
|
98
|
+
text_renderer.render(@graph_left - LABEL_MARGIN * 2, 1.0, 0.0, y_offset, Magick::EastGravity)
|
|
88
99
|
end
|
|
89
100
|
end
|
|
90
101
|
end
|
|
@@ -0,0 +1,59 @@
|
|
|
1
|
+
# frozen_string_literal: true
|
|
2
|
+
|
|
3
|
+
require 'histogram'
|
|
4
|
+
require 'gruff/base'
|
|
5
|
+
|
|
6
|
+
#
|
|
7
|
+
# Here's how to set up a Gruff::Histogram.
|
|
8
|
+
#
|
|
9
|
+
# g = Gruff::Histogram.new
|
|
10
|
+
# g.title = 'Histogram Graph'
|
|
11
|
+
# g.minimum_bin = 10
|
|
12
|
+
# g.bin_width = 20
|
|
13
|
+
# g.data :A, [10, 10, 20, 30, 40, 40, 40, 40, 40, 40, 50, 10, 10, 10]
|
|
14
|
+
# g.data :B, [100, 100, 100, 100, 90, 90, 80, 30, 30, 30, 30, 30]
|
|
15
|
+
# g.write('histogram.png')
|
|
16
|
+
#
|
|
17
|
+
class Gruff::Histogram < Gruff::Bar
|
|
18
|
+
def initialize_ivars
|
|
19
|
+
super
|
|
20
|
+
@bin_width = 10
|
|
21
|
+
@minimum_bin = nil
|
|
22
|
+
@maximum_bin = nil
|
|
23
|
+
end
|
|
24
|
+
private :initialize_ivars
|
|
25
|
+
|
|
26
|
+
# Specifies interpolation between the min and max of the set. Default is +10+.
|
|
27
|
+
def bin_width=(width)
|
|
28
|
+
raise 'bin_width= should be called before set the data.' unless store.empty?
|
|
29
|
+
|
|
30
|
+
@bin_width = width
|
|
31
|
+
end
|
|
32
|
+
|
|
33
|
+
# Specifies minimum value for bin.
|
|
34
|
+
def minimum_bin=(min)
|
|
35
|
+
raise 'minimum_bin= should be called before set the data.' unless store.empty?
|
|
36
|
+
|
|
37
|
+
@minimum_bin = min
|
|
38
|
+
end
|
|
39
|
+
|
|
40
|
+
# Specifies maximum value for bin.
|
|
41
|
+
def maximum_bin=(max)
|
|
42
|
+
raise 'maximum_bin= should be called before set the data.' unless store.empty?
|
|
43
|
+
|
|
44
|
+
@maximum_bin = max
|
|
45
|
+
end
|
|
46
|
+
|
|
47
|
+
def data(name, data_points = [], color = nil)
|
|
48
|
+
bins, freqs = HistogramArray.new(data_points).histogram(bin_width: @bin_width, min: @minimum_bin, max: @maximum_bin)
|
|
49
|
+
bins.each_with_index do |bin, index|
|
|
50
|
+
labels[index] = bin
|
|
51
|
+
end
|
|
52
|
+
store.add(name, freqs, color)
|
|
53
|
+
end
|
|
54
|
+
|
|
55
|
+
# @private
|
|
56
|
+
class HistogramArray < Array
|
|
57
|
+
include ::Histogram
|
|
58
|
+
end
|
|
59
|
+
end
|
data/lib/gruff/line.rb
CHANGED
|
@@ -2,16 +2,18 @@
|
|
|
2
2
|
|
|
3
3
|
require 'gruff/base'
|
|
4
4
|
|
|
5
|
-
#
|
|
5
|
+
#
|
|
6
|
+
# Here's how to make a Gruff::Line.
|
|
6
7
|
#
|
|
7
8
|
# g = Gruff::Line.new
|
|
8
9
|
# g.title = "A Line Graph"
|
|
9
10
|
# g.data 'Fries', [20, 23, 19, 8]
|
|
10
11
|
# g.data 'Hamburgers', [50, 19, 99, 29]
|
|
11
|
-
# g.write("
|
|
12
|
+
# g.write("line.png")
|
|
12
13
|
#
|
|
13
14
|
# There are also other options described below, such as {#baseline_value}, {#baseline_color},
|
|
14
15
|
# {#hide_dots}, and {#hide_lines}.
|
|
16
|
+
#
|
|
15
17
|
class Gruff::Line < Gruff::Base
|
|
16
18
|
# Allow for reference lines ( which are like baseline ... just allowing for more & on both axes ).
|
|
17
19
|
attr_accessor :reference_lines
|
data/lib/gruff/mini/bar.rb
CHANGED
|
@@ -1,9 +1,17 @@
|
|
|
1
1
|
# frozen_string_literal: true
|
|
2
2
|
|
|
3
|
-
##
|
|
4
3
|
#
|
|
5
4
|
# Makes a small bar graph suitable for display at 200px or even smaller.
|
|
6
5
|
#
|
|
6
|
+
# Here's how to set up a Gruff::Mini::Bar.
|
|
7
|
+
#
|
|
8
|
+
# g = Gruff::Mini::Bar.new
|
|
9
|
+
# g.title = 'Mini Bar Graph'
|
|
10
|
+
# g.data :Art, [0, 5, 8, 15]
|
|
11
|
+
# g.data :Philosophy, [10, 3, 2, 8]
|
|
12
|
+
# g.data :Science, [2, 15, 8, 11]
|
|
13
|
+
# g.write('mini_bar.png')
|
|
14
|
+
#
|
|
7
15
|
module Gruff
|
|
8
16
|
module Mini
|
|
9
17
|
class Bar < Gruff::Bar
|
data/lib/gruff/mini/pie.rb
CHANGED
|
@@ -1,9 +1,16 @@
|
|
|
1
1
|
# frozen_string_literal: true
|
|
2
2
|
|
|
3
|
-
##
|
|
4
3
|
#
|
|
5
4
|
# Makes a small pie graph suitable for display at 200px or even smaller.
|
|
6
5
|
#
|
|
6
|
+
# Here's how to set up a Gruff::Mini::Pie.
|
|
7
|
+
#
|
|
8
|
+
# g = Gruff::Mini::Pie.new
|
|
9
|
+
# g.title = "Visual Pie Graph Test"
|
|
10
|
+
# g.data 'Fries', 20
|
|
11
|
+
# g.data 'Hamburgers', 50
|
|
12
|
+
# g.write("mini_pie_keynote.png")
|
|
13
|
+
#
|
|
7
14
|
module Gruff
|
|
8
15
|
module Mini
|
|
9
16
|
class Pie < Gruff::Pie
|
data/lib/gruff/mini/side_bar.rb
CHANGED
|
@@ -1,8 +1,23 @@
|
|
|
1
1
|
# frozen_string_literal: true
|
|
2
2
|
|
|
3
|
-
##
|
|
4
3
|
#
|
|
5
|
-
# Makes a small
|
|
4
|
+
# Makes a small side bar graph suitable for display at 200px or even smaller.
|
|
5
|
+
#
|
|
6
|
+
# Here's how to set up a Gruff::Mini::SideBar.
|
|
7
|
+
#
|
|
8
|
+
# g = Gruff::Mini::SideBar.new
|
|
9
|
+
# g.title = 'SideBar Graph'
|
|
10
|
+
# g.labels = {
|
|
11
|
+
# 0 => '5/6',
|
|
12
|
+
# 1 => '5/15',
|
|
13
|
+
# 2 => '5/24',
|
|
14
|
+
# 3 => '5/30',
|
|
15
|
+
# }
|
|
16
|
+
# g.group_spacing = 20
|
|
17
|
+
# g.data :Art, [0, 5, 8, 15]
|
|
18
|
+
# g.data :Philosophy, [10, 3, 2, 8]
|
|
19
|
+
# g.data :Science, [2, 15, 8, 11]
|
|
20
|
+
# g.write('mini_sidebar.png')
|
|
6
21
|
#
|
|
7
22
|
module Gruff
|
|
8
23
|
module Mini
|
data/lib/gruff/net.rb
CHANGED
|
@@ -2,7 +2,28 @@
|
|
|
2
2
|
|
|
3
3
|
require 'gruff/base'
|
|
4
4
|
|
|
5
|
-
#
|
|
5
|
+
# See also the Spider graph.
|
|
6
|
+
#
|
|
7
|
+
# Here's how to make a Gruff::Net.
|
|
8
|
+
#
|
|
9
|
+
# g = Gruff::Net.new
|
|
10
|
+
# g.title = "Net Graph"
|
|
11
|
+
# g.labels = {
|
|
12
|
+
# 0 => '5/6',
|
|
13
|
+
# 1 => '5/15',
|
|
14
|
+
# 2 => '5/24',
|
|
15
|
+
# 3 => '5/30',
|
|
16
|
+
# 4 => '6/4',
|
|
17
|
+
# 5 => '6/12',
|
|
18
|
+
# 6 => '6/21',
|
|
19
|
+
# 7 => '6/28'
|
|
20
|
+
# }
|
|
21
|
+
# g.line_width = 3
|
|
22
|
+
# g.dot_radius = 4
|
|
23
|
+
# g.data :Jimmy, [25, 36, 86, 39, 25, 31, 79, 88]
|
|
24
|
+
# g.data :Julie, [22, 29, 35, 38, 36, 40, 46, 57]
|
|
25
|
+
# g.write("net.png")
|
|
26
|
+
#
|
|
6
27
|
class Gruff::Net < Gruff::Base
|
|
7
28
|
# Hide parts of the graph to fit more datapoints, or for a different appearance.
|
|
8
29
|
attr_accessor :hide_dots
|
data/lib/gruff/patch/string.rb
CHANGED
|
@@ -1,8 +1,10 @@
|
|
|
1
1
|
# frozen_string_literal: true
|
|
2
2
|
|
|
3
3
|
class String
|
|
4
|
+
THOUSAND_SEPARATOR = ','
|
|
5
|
+
|
|
4
6
|
#Taken from http://codesnippets.joyent.com/posts/show/330
|
|
5
|
-
def commify(delimiter =
|
|
7
|
+
def commify(delimiter = THOUSAND_SEPARATOR)
|
|
6
8
|
gsub(/(\d)(?=(\d\d\d)+(?!\d))/, "\\1#{delimiter}")
|
|
7
9
|
end
|
|
8
10
|
end
|
data/lib/gruff/pie.rb
CHANGED
|
@@ -2,16 +2,17 @@
|
|
|
2
2
|
|
|
3
3
|
require 'gruff/base'
|
|
4
4
|
|
|
5
|
-
|
|
6
|
-
# Here's how to make a Pie
|
|
5
|
+
#
|
|
6
|
+
# Here's how to make a Gruff::Pie.
|
|
7
7
|
#
|
|
8
8
|
# g = Gruff::Pie.new
|
|
9
9
|
# g.title = "Visual Pie Graph Test"
|
|
10
10
|
# g.data 'Fries', 20
|
|
11
11
|
# g.data 'Hamburgers', 50
|
|
12
|
-
# g.write("
|
|
12
|
+
# g.write("pie_keynote.png")
|
|
13
|
+
#
|
|
14
|
+
# To control where the pie chart starts creating slices, use {#zero_degree=}.
|
|
13
15
|
#
|
|
14
|
-
# To control where the pie chart starts creating slices, use #zero_degree.
|
|
15
16
|
class Gruff::Pie < Gruff::Base
|
|
16
17
|
DEFAULT_TEXT_OFFSET_PERCENTAGE = 0.15
|
|
17
18
|
|
data/lib/gruff/scatter.rb
CHANGED
|
@@ -2,12 +2,13 @@
|
|
|
2
2
|
|
|
3
3
|
require 'gruff/base'
|
|
4
4
|
|
|
5
|
-
#
|
|
5
|
+
#
|
|
6
|
+
# Here's how to set up a Gruff::Scatter.
|
|
6
7
|
#
|
|
7
8
|
# g = Gruff::Scatter.new(800)
|
|
8
|
-
# g.data
|
|
9
|
-
# g.data
|
|
10
|
-
# g.write('
|
|
9
|
+
# g.data :apples, [1,2,3,4], [4,3,2,1]
|
|
10
|
+
# g.data 'oranges', [5,7,8], [4,1,7]
|
|
11
|
+
# g.write('scatter.png')
|
|
11
12
|
#
|
|
12
13
|
class Gruff::Scatter < Gruff::Base
|
|
13
14
|
# Maximum X Value. The value will get overwritten by the max in the
|
data/lib/gruff/side_bar.rb
CHANGED
|
@@ -3,6 +3,23 @@
|
|
|
3
3
|
require 'gruff/base'
|
|
4
4
|
|
|
5
5
|
# Graph with individual horizontal bars instead of vertical bars.
|
|
6
|
+
#
|
|
7
|
+
# Here's how to set up a Gruff::SideBar.
|
|
8
|
+
#
|
|
9
|
+
# g = Gruff::SideBar.new
|
|
10
|
+
# g.title = 'SideBar Graph'
|
|
11
|
+
# g.labels = {
|
|
12
|
+
# 0 => '5/6',
|
|
13
|
+
# 1 => '5/15',
|
|
14
|
+
# 2 => '5/24',
|
|
15
|
+
# 3 => '5/30',
|
|
16
|
+
# }
|
|
17
|
+
# g.group_spacing = 20
|
|
18
|
+
# g.data :Art, [0, 5, 8, 15]
|
|
19
|
+
# g.data :Philosophy, [10, 3, 2, 8]
|
|
20
|
+
# g.data :Science, [2, 15, 8, 11]
|
|
21
|
+
# g.write('sidebar.png')
|
|
22
|
+
#
|
|
6
23
|
class Gruff::SideBar < Gruff::Base
|
|
7
24
|
# Spacing factor applied between bars.
|
|
8
25
|
attr_accessor :bar_spacing
|
|
@@ -125,11 +142,7 @@ private
|
|
|
125
142
|
lbl = @use_data_label ? label : @labels[index]
|
|
126
143
|
|
|
127
144
|
text_renderer = Gruff::Renderer::Text.new(lbl, font: @font, size: @marker_font_size, color: @font_color)
|
|
128
|
-
|
|
129
|
-
text_renderer.render(1, 1, @graph_left - LABEL_MARGIN * 2.0, y_offset, Magick::EastGravity)
|
|
130
|
-
else
|
|
131
|
-
text_renderer.render(1, 1, -@graph_left + LABEL_MARGIN * 2.0, y_offset, Magick::EastGravity)
|
|
132
|
-
end
|
|
145
|
+
text_renderer.render(@graph_left - LABEL_MARGIN * 2, 1.0, 0.0, y_offset, Magick::EastGravity)
|
|
133
146
|
end
|
|
134
147
|
end
|
|
135
148
|
|
|
@@ -3,10 +3,25 @@
|
|
|
3
3
|
require 'gruff/side_bar'
|
|
4
4
|
require 'gruff/helper/stacked_mixin'
|
|
5
5
|
|
|
6
|
+
#
|
|
6
7
|
# New gruff graph type added to enable sideways stacking bar charts
|
|
7
8
|
# (basically looks like a x/y flip of a standard stacking bar chart)
|
|
8
9
|
#
|
|
9
|
-
#
|
|
10
|
+
# Here's how to set up a Gruff::SideStackedBar.
|
|
11
|
+
#
|
|
12
|
+
# g = Gruff::SideStackedBar.new
|
|
13
|
+
# g.title = 'SideStackedBar Graph'
|
|
14
|
+
# g.labels = {
|
|
15
|
+
# 0 => '5/6',
|
|
16
|
+
# 1 => '5/15',
|
|
17
|
+
# 2 => '5/24',
|
|
18
|
+
# 3 => '5/30',
|
|
19
|
+
# }
|
|
20
|
+
# g.data :Art, [0, 5, 8, 15]
|
|
21
|
+
# g.data :Philosophy, [10, 3, 2, 8]
|
|
22
|
+
# g.data :Science, [2, 15, 8, 11]
|
|
23
|
+
# g.write('side_stacked_bar.png')
|
|
24
|
+
#
|
|
10
25
|
class Gruff::SideStackedBar < Gruff::SideBar
|
|
11
26
|
include StackedMixin
|
|
12
27
|
include BarValueLabelMixin
|
|
@@ -34,7 +49,7 @@ class Gruff::SideStackedBar < Gruff::SideBar
|
|
|
34
49
|
|
|
35
50
|
def draw
|
|
36
51
|
@has_left_labels = true
|
|
37
|
-
|
|
52
|
+
calculate_maximum_by_stack
|
|
38
53
|
super
|
|
39
54
|
end
|
|
40
55
|
|
data/lib/gruff/spider.rb
CHANGED
|
@@ -4,7 +4,18 @@ require 'gruff/base'
|
|
|
4
4
|
|
|
5
5
|
# Experimental!!! See also the Net graph.
|
|
6
6
|
#
|
|
7
|
-
#
|
|
7
|
+
# Here's how to set up a Gruff::Spider.
|
|
8
|
+
#
|
|
9
|
+
# g = Gruff::Spider.new(30)
|
|
10
|
+
# g.title = "Spider Graph"
|
|
11
|
+
# g.data :Strength, [10]
|
|
12
|
+
# g.data :Dexterity, [16]
|
|
13
|
+
# g.data :Constitution, [12]
|
|
14
|
+
# g.data :Intelligence, [12]
|
|
15
|
+
# g.data :Wisdom, [10]
|
|
16
|
+
# g.data 'Charisma', [16]
|
|
17
|
+
# g.write("spider.png")
|
|
18
|
+
|
|
8
19
|
class Gruff::Spider < Gruff::Base
|
|
9
20
|
# Hide all text.
|
|
10
21
|
attr_reader :hide_text
|
data/lib/gruff/stacked_area.rb
CHANGED
|
@@ -3,12 +3,22 @@
|
|
|
3
3
|
require 'gruff/base'
|
|
4
4
|
require 'gruff/helper/stacked_mixin'
|
|
5
5
|
|
|
6
|
+
#
|
|
7
|
+
# Here's how to set up a Gruff::StackedArea.
|
|
8
|
+
#
|
|
9
|
+
# g = Gruff::StackedArea.new
|
|
10
|
+
# g.title = 'StackedArea Graph'
|
|
11
|
+
# g.data :Jimmy, [25, 36, 86, 39, 25, 31, 79, 88]
|
|
12
|
+
# g.data :Charles, [80, 54, 67, 54, 68, 70, 90, 95]
|
|
13
|
+
# g.data :Julie, [22, 29, 35, 38, 36, 40, 46, 57]
|
|
14
|
+
# g.write('stacked_area.png')
|
|
15
|
+
#
|
|
6
16
|
class Gruff::StackedArea < Gruff::Base
|
|
7
17
|
include StackedMixin
|
|
8
18
|
attr_accessor :last_series_goes_on_bottom
|
|
9
19
|
|
|
10
20
|
def draw
|
|
11
|
-
|
|
21
|
+
calculate_maximum_by_stack
|
|
12
22
|
super
|
|
13
23
|
|
|
14
24
|
return unless data_given?
|
data/lib/gruff/stacked_bar.rb
CHANGED
|
@@ -4,6 +4,16 @@ require 'gruff/base'
|
|
|
4
4
|
require 'gruff/helper/stacked_mixin'
|
|
5
5
|
require 'gruff/helper/bar_value_label_mixin'
|
|
6
6
|
|
|
7
|
+
#
|
|
8
|
+
# Here's how to set up a Gruff::StackedBar.
|
|
9
|
+
#
|
|
10
|
+
# g = Gruff::StackedBar.new
|
|
11
|
+
# g.title = 'StackedBar Graph'
|
|
12
|
+
# g.data :Art, [0, 5, 8, 15]
|
|
13
|
+
# g.data :Philosophy, [10, 3, 2, 8]
|
|
14
|
+
# g.data :Science, [2, 15, 8, 11]
|
|
15
|
+
# g.write('stacked_bar.png')
|
|
16
|
+
#
|
|
7
17
|
class Gruff::StackedBar < Gruff::Base
|
|
8
18
|
include StackedMixin
|
|
9
19
|
include BarValueLabelMixin
|
|
@@ -31,7 +41,7 @@ class Gruff::StackedBar < Gruff::Base
|
|
|
31
41
|
|
|
32
42
|
# Draws a bar graph, but multiple sets are stacked on top of each other.
|
|
33
43
|
def draw
|
|
34
|
-
|
|
44
|
+
calculate_maximum_by_stack
|
|
35
45
|
super
|
|
36
46
|
return unless data_given?
|
|
37
47
|
|
|
@@ -4,7 +4,7 @@ module Gruff
|
|
|
4
4
|
class Store
|
|
5
5
|
class CustomData < Struct.new(:label, :points, :color, :custom)
|
|
6
6
|
def initialize(label, points, color, custom = nil)
|
|
7
|
-
self.label = label
|
|
7
|
+
self.label = label.to_s
|
|
8
8
|
self.points = Array(points)
|
|
9
9
|
self.color = color
|
|
10
10
|
self.custom = custom
|
data/lib/gruff/store/store.rb
CHANGED
data/lib/gruff/store/xy_data.rb
CHANGED
|
@@ -4,7 +4,7 @@ module Gruff
|
|
|
4
4
|
class Store
|
|
5
5
|
class XYData < Struct.new(:label, :y_points, :color, :x_points)
|
|
6
6
|
def initialize(label, y_points, color, x_points = nil)
|
|
7
|
-
self.label = label
|
|
7
|
+
self.label = label.to_s
|
|
8
8
|
self.y_points = Array(y_points)
|
|
9
9
|
self.color = color
|
|
10
10
|
self.x_points = Array(x_points) if x_points
|
data/lib/gruff/version.rb
CHANGED
metadata
CHANGED
|
@@ -1,7 +1,7 @@
|
|
|
1
1
|
--- !ruby/object:Gem::Specification
|
|
2
2
|
name: gruff
|
|
3
3
|
version: !ruby/object:Gem::Version
|
|
4
|
-
version: 0.
|
|
4
|
+
version: 0.10.0
|
|
5
5
|
platform: java
|
|
6
6
|
authors:
|
|
7
7
|
- Geoffrey Grosenbach
|
|
@@ -9,7 +9,7 @@ authors:
|
|
|
9
9
|
autorequire:
|
|
10
10
|
bindir: bin
|
|
11
11
|
cert_chain: []
|
|
12
|
-
date: 2020-05-
|
|
12
|
+
date: 2020-05-31 00:00:00.000000000 Z
|
|
13
13
|
dependencies:
|
|
14
14
|
- !ruby/object:Gem::Dependency
|
|
15
15
|
requirement: !ruby/object:Gem::Requirement
|
|
@@ -25,6 +25,20 @@ dependencies:
|
|
|
25
25
|
- - ">="
|
|
26
26
|
- !ruby/object:Gem::Version
|
|
27
27
|
version: '0'
|
|
28
|
+
- !ruby/object:Gem::Dependency
|
|
29
|
+
requirement: !ruby/object:Gem::Requirement
|
|
30
|
+
requirements:
|
|
31
|
+
- - ">="
|
|
32
|
+
- !ruby/object:Gem::Version
|
|
33
|
+
version: '0'
|
|
34
|
+
name: histogram
|
|
35
|
+
type: :runtime
|
|
36
|
+
prerelease: false
|
|
37
|
+
version_requirements: !ruby/object:Gem::Requirement
|
|
38
|
+
requirements:
|
|
39
|
+
- - ">="
|
|
40
|
+
- !ruby/object:Gem::Version
|
|
41
|
+
version: '0'
|
|
28
42
|
- !ruby/object:Gem::Dependency
|
|
29
43
|
requirement: !ruby/object:Gem::Requirement
|
|
30
44
|
requirements:
|
|
@@ -105,6 +119,7 @@ files:
|
|
|
105
119
|
- lib/gruff/helper/bar_conversion.rb
|
|
106
120
|
- lib/gruff/helper/bar_value_label_mixin.rb
|
|
107
121
|
- lib/gruff/helper/stacked_mixin.rb
|
|
122
|
+
- lib/gruff/histogram.rb
|
|
108
123
|
- lib/gruff/line.rb
|
|
109
124
|
- lib/gruff/mini/bar.rb
|
|
110
125
|
- lib/gruff/mini/legend.rb
|